AUDUSD is trading at 0.6892; the instrument is moving below Ichimoku Cloud, thus indicating a descending tendency. The markets could indicate that the price may test the cloud’s downside border at 0.6905 and then resume moving downwards to reach 0.6805. Another signal to confirm further descending movement is the price’s rebounding from the resistance level. However, the scenario that implies further decline may be cancelled if the price breaks the cloud’s upside border and fixes above 0.6945. In this case, the pair may continue growing towards 0.7015.
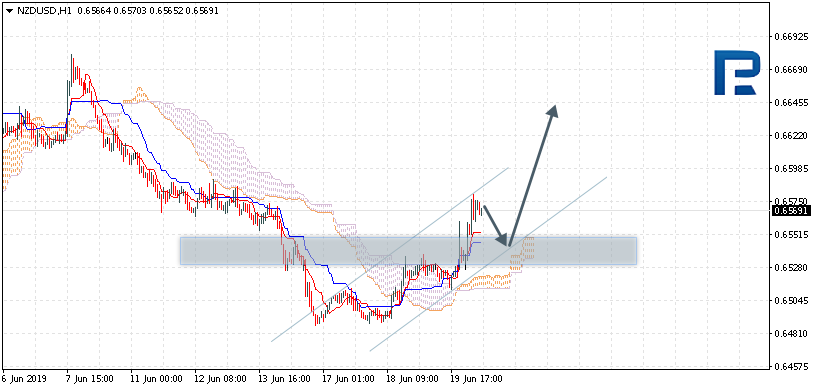
NZDUSD, “New Zealand Dollar vs US Dollar”
NZDUSD is trading at 0.6569; the instrument is moving above Ichimoku Cloud, thus indicating an ascending tendency. The markets could indicate that the price may test the cloud’s upside border at 0.6545 and then resume moving upwards to reach 0.6645. Another signal to confirm further ascending movement is the price’s rebounding from the support level. However, the scenario that implies further growth may be cancelled if the price breaks the cloud’s downside border and fixes below 0.6505. In this case, the pair may continue falling towards 0.6425.
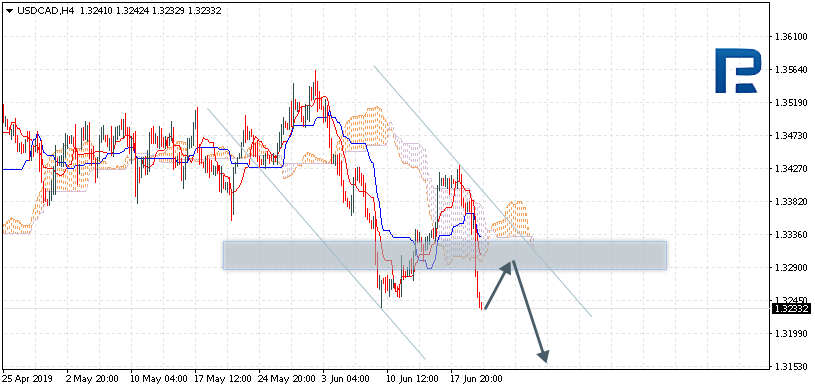
USDCAD, “US Dollar vs Canadian Dollar”
USDCAD is trading at 1.3233; the instrument is moving below Ichimoku Cloud, thus indicating a descending tendency. The markets could indicate that the price may test Tenkan-Sen and Kijun-Sen at 1.3290 and then resume moving downwards to reach 1.3155. Another signal to confirm further descending movement is the price’s rebounding from the resistance level. However, the scenario that implies further decline may be cancelled if the price breaks the cloud’s upside border and fixes above 1.3395. In this case, the pair may continue growing towards 1.3475.
Attention! Forecasts presented in this section only reflect the author’s private opinion and should not be considered as guidance for trading. RoboForex LP bears no responsibility for trading results based on trading recommendations described in these analytical reviews.
Yesterday USD got weakened against the majors. The EUR/USD set the new local maximums. As expected, the Federal Reserve kept the key interest rate at 2.25-2.50% and released mixed economic forecasts. The Central Bank made it known that it’s willing to review the softening of the monetary policy due to growing stress on the world economy and relatively weak inflation. The statement that the Central Bank is willing to remain calm about the further corrections of the interest rates disappeared from the FOMC communique. According to the CME FedWatch Tool 57.4% of market participants expect the range to decrease by 25 points in July, while 42.6% expect it to drop by 50 basis points. The key trading range for EUR/USD is 1.12400-1.12700. The quotes can grow further. You should open positions from the key levels.
At 15:30 (GMT+3:00) the Philadelfia Federal Reserve will release the Manufacturing Index.
The price fixed above 50 MA and 100 MA which points to the power of the buyers.
The MACD histogram is in the positive zone and above the signal line which gives a strong signal to buy EUR/USD.
The Stochastic Oscillator is in the overbought zone, the %K line is crossing the %D line. There are no signals at the moment.
Trading recommendations
Support levels: 1.12400, 1.12100, 1.11800
Resistance levels: 1.12700, 1.13000, 1.13250
If the price fixes above 1.12700, expect further growth towards 1.13000-1.13250.
Alternatively, the quotes can descend towards 1.12100-1.11900.
The GBP/USD currency pair
Technical indicators of the currency pair:
Prev Open: 1.25566
Open: 1.26408
% chg. over the last day: +0.78
Day’s range: 1.26259 – 1.27084
52 wk range: 1.2438 – 1.3631
GBP/USD shows agressive sales. During the last two days the quotes grew by 150 points. GBP pdated the key maximums, the demand for USD grows. GBP is testing the local resistance at 1.27150 with 1.26550 actiong as a key support. The investors are focused on the meeting of the Bank of England. The regulator will leave the monetary policy parameters the same. Keep an eye on the comments by the representatives and open positions from the key levels.
The Economic News Feed for 20.06.2019:
– Retail Sales Report (UK) – 11:30 (GMT+3:00);
– Monetary Policy Review (UK) – 14:00 (GMT+3:00);
The price fixed above 50 MA and 100 MA which points to the power of the buyers.
The MACD histogram is in the positive zone and keeps rising which gives a strong signal to buy GBP/USD.
The Stochastic Oscillator is in the overbought zone, the %K line is crossing the %D line. There are no signals.
Trading recommendations
Support levels: 1.26550, 1.26100, 1.25800
Resistance levels: 1.27150, 1.27600
If the price fixes above 1.27150, expect further growth towards 1.27600-1.27800.
Alternatively, the quotes can descend towards 1.26300-1.26000.
USD/CAD is in a strong descending trend. During the last two days the quotes fell by 140 points. The trading instrument updated the key minimums. The demand for USD weakened after the Federal Reserve meeting. CAD is supported by the positive oil quotes trends. The quotes are testing the support at 1.32250 with 1.32600 actng as the nearest resistance. The USD/CAD can descend further. Open positions from the key levels.
The Economic News Feed for 20.06.2019 is calm.
The price is below 50 MA and 100 MA which points to the power of the sellers.
The MACD histogram is in the negative zone and below the signal line which gives a strong signal to sell USD/CAD.
The Stochastic Oscillator is in the overbought zone, the %K line is crossing the %D line. There are no signals at the moment.
Trading recommendations
Support levels: 1.32250, 1.32000, 1.31700
Resistance levels: 1.32600, 1.33000, 1.3320
If the price fixes below 1.32250, expect further descend towards 1.32000-1.321700.
Alternatively, the quotes can recover towards 1.32800-1.33000.
The USD/JPY currency pair
Technical indicators of the currency pair:
Prev Open: 108.446
Open: 108.099
% chg. over the last day: -0.31
Day’s range: 107.467 – 108.143
52 wk range: 104.97 – 114.56
USD/JPY quotes started to descend after long consolidation. The quotes updated the local extremums. Right now they are consolidating around the local support at 107.500 with 107.900 acting as a mirror resistance. JPY has a tendency to grow further against the USD. Keep an eye on the US Treasury bonds’ yield and open positions from the key levels.
The Bank of Japan kept the monetary policy at the same levels, as expected.
The price fixed below 50 MA and 100 MA which points to the power of the sellers.
The MACD histogram is in the negative zone and below the signal line which gives a signal to sell USD/JPY.
The Stochastic Oscillator is in the overbought zone, the %K line is crossing the %D line. There are no signals at the moment.
Trading recommendations
Support levels: 107.550, 107.000
Resistance levels: 107.900, 108.200, 108.500
If the price fixes below 107.550, expect further descend towards 107.000.
Alternatively, the quotes can grow towards 108.100-108.300.
The US dollar weakened against a basket of major currencies after the Fed meeting. The regulator left the interest rate in the range of 2.25-2.50% per annum but made it clear that it could cut the rate even by half a percentage point before the end of the current year due to the uncertainty in the economy and the weak rate of inflation. The US currency is under pressure as a result of the news that US President Donald Trump believes that he has the authority to appoint another head of the Fed instead of Jerome Powell. The US dollar index #DX closed yesterday in the negative zone (-0.59%).
The Bank of Japan, in turn, left the main parameters of monetary policy unchanged, as well as confirmed plans to keep the key rate at the “extremely low” level until spring 2020. Today, the Bank of England meeting is in the focus of attention. As analysts forecast, the regulator will keep the interest rate unchanged at 0.75%.
The “black gold” prices are rising due to the reduction of US oil inventories. At the moment, futures for the WTI crude oil are testing the mark of $55.45 per barrel.
Market Indicators
Yesterday, the bullish sentiment was observed in the US stock market: #SPY (+0.23%), #DIA (+0.09%), #QQQ (+0.38%).
The 10-year US government bonds yield dropped significantly. At the moment, the indicator is at the level of 2.00-2.01%.
The news feed on 2019.06.20:
– Report on retail sales in the UK at 11:30 (GMT+3:00); – Bank of England interest rate decision at 14:00 (GMT+3:00); – Philadelphia Fed manufacturing index at 15:30 (GMT+3:00).
On Wednesday the 19th of June, trading on the euro closed up. The euro rose to 1.1254 in the aftermath of the FOMC meeting. The Fed maintained the Federal Funds Rate within its current range of 2.25% – 2.50% as expected. In its accompanying statement, the regulator hinted that it could ease monetary policy if the economic outlook worsens.
15:30 US: Philadelphia Fed manufacturing survey (Jun), current account (Q1), initial jobless claims (14 Jun).
17:00 Eurozone: consumer confidence (Jun).
23:00 UK: BoE’s Governor Carney speech.
Current situation:
In Thursday’s Asian session, the euro continued its recovery to reach 1.1284. The bulls are approaching the 67th degree (1.1287), and are testing the U3 MA line. I believe that this is an important resistance level, and the bulls aren’t going to break through here straight away.
The Bank of England is meeting today. All 9 members of the Monetary Policy Committee are expected to vote in favour of keeping interest rates at their current levels.
Following the FOMC meeting, and despite Mario Draghi’s dovish comments, bearish speculators began closing short positions on the euro. Keep an eye on 1.1350. If nothing changes, the pair will reach this level before the weekend.
What Wall Street knows as an incontrovertible truth is this: Fear is a bargain. And right now, there’s so much fear floating around the market that gold is back on everyone’s radar, with incredible bargains.
Gold is trading at over $1,342 an ounce right now.
So imagine buying it for $2-$3 an ounce instead.
When Wall Street goes bargain hunting, it’s looking for discount gold.
One way it does so is by targeting junior miners with major upside, setting short-term price targets that make these undervalued global gold assets ground zero for investors who are fleeing the next potential economic meltdown.
Among the well-known Wall Street bargain shoppers are Cantor Fitzgerald and GMP Research, two authorities on the street that closely follow the world’s breakthrough gold developments.
Recently, both have spotted an almost unrivaled gold bargain: Euro Sun Mining – owner of the biggest in-development gold mine in Europe. Cantor Fitzgerald’s short-term price target of $2.10, implies an upside of 406 percent. GMP Research has given it a $3.00 price target, implying a potential 641 percent increase.
That’s because when this gold gets out of the ground against a geopolitical backdrop of a massively destructive trade war and the dangerous flirtation of conflict with Iran, it may likely be the most valuable safe haven asset in the world.
This is where fear becomes opportunity
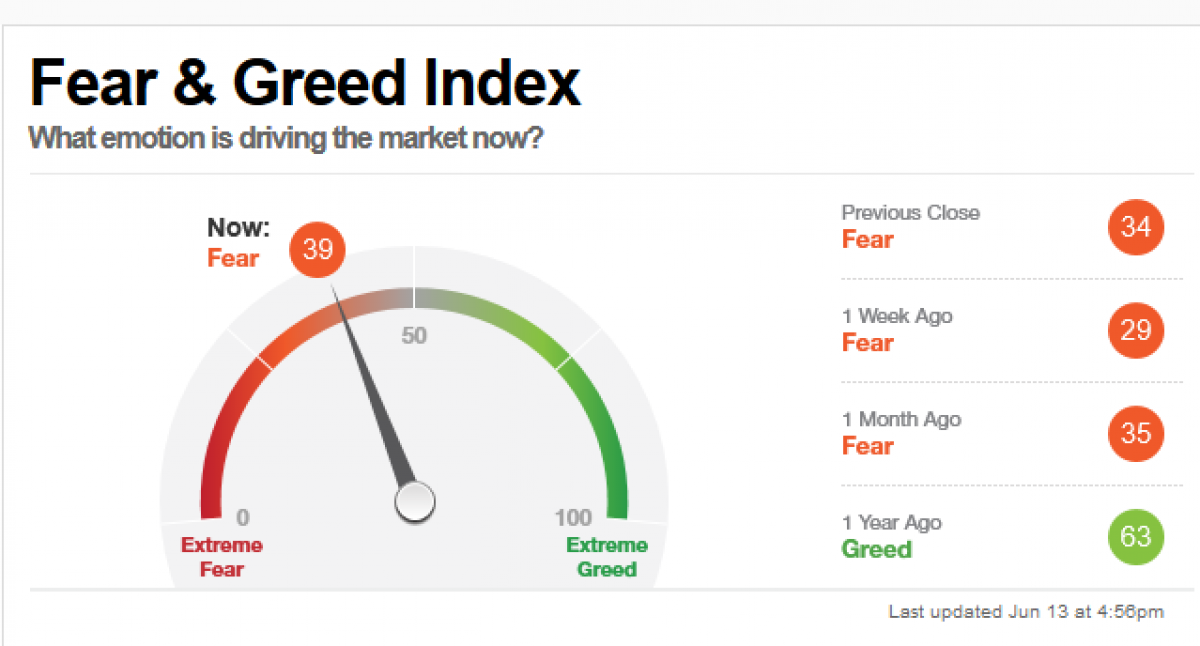
Fear has overtaken greed, and investors are running for safe havens.
Source: CNN Money
A year ago, greed ruled the day. Now, the market’s running on fumes and seems poised for an economic meltdown, powered by a trade war that knows no bounds.
If you haven’t seen the signs of a coming economic downturn… it’s about time you opened your eyes.
• The current S&P 500 P/E valuation of 21.47 is well above the historical median of 14.75 and the mean of 15.75, potentially laying the groundwork for a stock market correction.
• The labor market, which has remained red-hot for a couple of years, has recently gone cold. Only 75,000 jobs were created in May, and annual wages saw the slowest pace of growth in 8 months, while jobless claims unexpectedly spiked.
• The U.S. yield curve has already flipped. An inverted yield curve—one showing younger treasury bonds yielding more interest than older ones – is widely regarded as an ominous bellwether for an economic recession.
And those are just the side effects: We haven’t even felt the full repercussions of the U.S.-China trade war because the latest 25-percent hike on imports from China does not apply to goods already in transit.
With no deal in sight, the 4-6 week window will close in June – and all hell could break loose.
The big question then, is how best to profit from this looming crisis.
The answer?
Discount gold.
How Do You Buy Gold At A Discount?
Gold is and always has been the ultimate safe haven.
After decades of experimentation with gold alternatives, gold’s hegemony as the go-to store of value remains unchallenged.
As billionaire investor Paul Tudor recently told Bloomberg, gold has everything going for it right now and could zoom to $1,700 per ounce in a matter of months.
But the real money isn’t in buying the bullion itself…
It’s in getting exposure to gold at a discount. A technique for buying ounces of gold at cents to the dollar.
Gold mining is a tough business and getting progressively harder with the easy-hanging fruit in open pit mines now mostly gone. For every ounce a Barrick pulls out of the ground – they typically have 11-12 ounces in undeveloped projects.
A large operator might have 60-80 million ounces of gold in proven reserves.
You can generate phenomenal returns by owning shares in A+ level companies, with A+ level deposits that aren’t yet in production.
Instead of paying $1,350 per ounce from your gold broker…
You can pay $100… $50, $25…even $3 per ounce. When gold inevitably skyrockets – you’ll benefit from extraordinary leverage.
Take Euro Sun Mining for example, a company with over $10 billion worth of gold equivalent on its books. This company’s current market cap is $30 million – valuing each ounce of gold at just $3.
During the last gold boom, investors had plenty of success with this strategy as small miners enjoyed outstanding returns – Back in 2016, when gold prices soared 26% in 6 months, Mid cap miners such as Endeavour Mining Corp gained 196% in 6 months, while its Ontario based competitor IAMGold gained 256% in that same timeframe.
…but some of the real winners were the shareholders of small cap miners.
Argonault Gold’s share price jumped 298% in 6 months, and its peer Great Panther Mining saw its share price even jump by a whopping 340% in no more than 4 months after it reported a 19% in gold production.
Admittedly, a strong dollar can annihilate junior mining stocks. That’s what’s happened over the past five years, and now some of these little explorers are trading at a tiny fraction of their fair value estimates based on their existing gold reserves.
At this juncture, undervalued junior mining stocks provide the best bang for the buck, with Euro Sun Mining in particular looking incredibly cheap. Based at the company’s new mine in Rovina, Romania, Euro Sun has 400 million tons of ore, with billions of dollars in gold equivalent and copper locked inside.
There’s an art to thriving in a market downturn
Gold stocks have been beaten down for far too long, and now they are just like a high-tension spring – ready to explode at the slightest nudge.
Gold has everything going for it right now, with geopolitical and macroeconomic trends aligning in its favor.
By carefully rebalancing your portfolio to include cheap gold stocks, you can not only survive but thrive in the coming storm.
2019 is shaping up to be a banner year for gold, and the following companies have all locked in their bets:
Barrick Gold Corp. (NYSE:GOLD) (TSE:ABX) and Goldcorp Inc. (NYSE:GG): All eyes are on the billion-dollar partnership these two giants are forming in Chile’s gold belt. Goldcorp is putting up $1 billion to get in on this deal as miners scramble for new sources of growth. This joint venture will see the two giant miners operate three properties in Chile’s Maricunga region, and these will be major catalysts for both.
Newmont Mining Corp (NYSE:NEM) Founded over 100 years ago, Newmont Mining Corporation (NYSE:NEM) is one of the leading mining companies in the world. The company holds assets in Peru, Australia, Ghana, Indonesia, Mexico, and around the United States. Primarily focusing on gold and copper, Newmont has steadily carved out a name for itself among those in the industry. In Q1 2017 alone, the company secured over 1.2M ounces of gold. Definitely noteworthy for investors.
Wheaton is a company with its hands in operations all around the world. As one of the largest ‘streaming’ companies on the planet, Wheaton has agreements with 19 operating mines and 9 projects still in development. Its unique business model allows it to leverage price increases in the precious metals sector, as well as provide a quality dividend yield for its investors.
Recently, Wheaton sealed a deal with Hudbay Minerals Inc. relating to its Rosemont project. For an initial payment of $230 million, Wheaton is entited to 100 percent of payable gold and silver at a price of $450 per ounce and $3.90 per ounce respectively.
Randy Smallwood, Wheaton’s President and Chief Executive Officer explained, “With their most recent successful construction of the Constancia mine in Peru, the Hudbay team has proven themselves to be strong and responsible mine developers, and we are excited about the same team moving this project into production. Rosemont is an ideal fit for Wheaton’s portfolio of high-quality assets, and when it is in production, should add well over fifty thousand gold equivalent ounces to our already growing production profile.”
Teck Resources (NYSE:TECK) (TSX:TECK): Teck could be one of the best-diversified miners out there, with a broad portfolio of Copper, Zinc, Energy, Gold, Silver and Molybdenum assets. Its free cash flow and a lower volatility outlook for base metals in combination with a potential trade war breakthrough could send the stock higher in H2 of this year.
Teck’s share price stabilized last year and many investment banks now see the stock as undervalued. Low prices for Canadian crude and disappointing base metals prices weighed on Q4 earnings.
Despite its struggles, however, Teck Resources recently received a favorable investment rating from Fitch and Moody’s, and will likely benefit from its upgraded score. “Having investment grade ratings is very important to us and confirms the strong financial position of the company,” said Don Lindsay, President and CEO. “We are very pleased to receive this second credit rating upgrade.”
Yamana, has recently completed its Cerro Moro project in Argentina, giving its investors something major to look out for. The company plans to ramp up its gold production by 20% through 2019 and its silver production by a whopping 200%. Investors can expect a serious increase in free cash flow if precious metal prices remain stable.
Recently, Yamana signed an agreement with Glencore and Goldcorp to develop and operate another Argentinian project, the Agua Rica. Initial analysis suggests the potential for a mine life in excess of 25 years at average annual production of approximately 236,000 tonnes (520 million pounds) of copper-equivalent metal, including the contributions of gold, molybdenum, and silver, for the first 10 years of operation.
The agreement is a major step forward for the Agua Rica region, and all of the miners working on it.
Kinross Gold Corporation (NYSE:KGC) (TSX:K)
Kinross Gold Corporation is relatively new on the scene, founded in the early 90s, but it certainly isn’t lacking drive or experience. In 2015, the company received the highest ranking for of any Canadian miner in Maclean’s magazine’s annual assessment of socially responsible companies.
While Kinross posted a significant loss in the fourth quarter of 2018, the company is making strong moves to turn around its earnings, including the hiring of a new CFO, Andrea S. Freeborough.
“Andrea’s successful track record at Kinross and throughout her career, including accounting, international finance, M&A, and deep management experience, will be an excellent addition to our leadership team,” said Mr. Rollinson. “We have great talent at Kinross and succession planning is a key aspect of retaining that talent for the future success of our Company.”
By. Ian Jenkins
IMPORTANT NOTICE AND DISCLAIMER
Oilprice.com, Advanced Media Solutions Ltd, and their owners, managers, employees, and assigns (collectively “the Publisher”) has not been paid to publish this communication. This communication is not, and should not be construed to be, an offer to sell or a solicitation of an offer to buy any security. The Publisher is not, and does not purport to be, a broker-dealer or registered investment adviser. This communication is not, and should not be construed to be, personalized investment advice directed to or appropriate for any particular investor. Any investment should be made only after consulting a professional investment advisor and only after reviewing the financial statements and other pertinent corporate information about the company.
SHARE OWNERSHIP. The owner of Oilprice.com owns shares of the featured company and is therefore extremely biased and has an incentive to see its stock perform well. The owner of Oilprice.com has no present intention of selling any shares in the near future but also does not assume any obligation to notify the market when it decides to buy or sell shares.
The US dollar rally nearly half a percent today off recent support near $96.50. This upside price move confirms the capital shift we have been talking about. Foreign capital is pouring into US markets and US dollar as strength in the US economy continues to dominate.
This new upside move in the US dollar has established a new lower price channel that should continue to act as price support going forward. Fibonacci price structure dictates that a higher low and a higher high price rotation may follow. We would expect some resistance just below the $98 level and if the Fed lowers the rate the dollar will likely pullback and consolidate for a few weeks to digest the news, but investors will still see the USD as the strong currency and keep buying it longer term.
It is important to understand the strength in the US dollar and the US economy should continue unless something interrupts the growth and continued out what from the US. It is very likely capital will continue to seek out the best returns and the best safety which we believe is available only in the US right now. Eventually, things may change where foreign markets become more opportunistic for investors and capital begins to shift away from the US markets. Until that happens we believe the US markets will continue to drive higher and likely push towards new all-time highs.
The strength of the US dollar is muting the upside potential in precious metals as well as the US stock market. We believe the underlying strength and opportunities resulting from the capital shift, where capital is rushing into US markets, will eventually override the strength of the US dollar. In other words, investors will continue to pour money into US stocks and into precious metals as a protection mechanism against risk while the US dollar continues to rise. If and when the US dollar does rate below the lower price channel, the US stock market may likely breakdown as well and precious metals should skyrocket higher. Until that time, we expect a moderate price advance to continue in the US stock market major and mid-cap sectors, the US dollar, and precious metals.
Gold will likely rally from the 1340 level to just below 1380 on the next leg. Then Gold will likely cause and rotate to near 1360, pause briefly, then rally to levels above 1400. We believe this rally may happen before July 12-15, 2019.
Follow our research to stay ahead of the market moves. We’ve been warning our followers for months that 2019 and 2020 will include incredible opportunities for skilled traders. We’ve also been calling these major moves very accurately. With the US elections only 15 months away, we urge all traders and investors to pay very close attention to our research and insights.
We have recently suggested that a major price may set up in late August or early September 2019. Once we get to this date or closer to this inflection point, we’ll provide more insight as to what our modeling systems are suggesting.
UNIQUE PHYSICAL SILVER OPPORTUNITY:
I have taken advantage of the flow into the safe-haven assets like the Utility sector, and most importantly precious metals (GLD up 3.68%, GDXJ up 11.16%). I anticipated this and our XLU utilities ETF taken with members was a quick 3.11% winner. Our VIX ETF trade also hit our 25% profit target within a few days of entry.
Now, I have a few silver rounds here at my desk I am going to give away and ship out to anyone who joins me with a 1-year, or 2-year subscription to Wealth Trading Newsletter. You can upgrade to this longer-term subscription if you a current subscriber or join one of these two exciting offers below, and you will receive:
1-Year Subscription Gets One 1oz Silver Round FREE (Could be worth hundreds of dollars)
2-Year Subscription Gets TWO 1oz Silver Rounds FREE (Could be worth a lot in the future)
I only have few silver rounds I’m giving away so upgrade or join now before its too late!
The debate between the five men vying to be the UK’s next Prime Minister underscores that the pound and UK assets can be expected to fall further, affirms the boss of the world’s largest independent financial advisory organizations.
The comments from Nigel Green, founder and CEO of deVere Group, which has $12bn under advisement, comes following former Brexit Secretary Dominic Raab being eliminated in the second round of voting, ahead of a live televised debate between the remaining five: Boris Johnson, Jeremy Hunt, Michael Gove, Sajid Javid and Rory Stewart.
Mr Green notes: “The debate between the five men vying to be the UK’s next prime minister underscores that the pound can be expected to fall further.
“The chaos and uncertainty triggered by Brexit – which has recently intensified by the race to become the new Prime Minister – has put the pound on a considerable downward trajectory.
“An already battered pound has lost almost 5 per cent of its value against the U.S. dollar since the start of May. Similarly, it continues six straight weeks of falls against the euro.”
He continues: “The debate on Tuesday night – the first one in which Boris Johnson, the frontrunner, has taken part – underscores in the most dramatic way that there is still no single realistic way forward out of the Brexit quagmire.
“None of them could answer how they would get their version of Brexit over the line.
“As it stands, the facts remain that parliament will not back the deal as agreed with the EU; it will not back a no-deal scenario; and it will not back a second referendum.
“As such, there is still no path through this – and it has already been going on for three years.”
Mr Green goes on to add: “Against this backdrop of growing uncertainty and a looming deadline, the pound and UK assets will likely have further to fall.
“It is hardly surprising then that UK and international investors are responding to the Brexit-fuelled uncertainties by considering removing their wealth from the UK.”
The deVere CEO concludes: “The lack of real answers from the candidates on the most pressing issue for a generation will inevitably impact the pound and UK assets.
“Nothing has already been priced-in as there is, currently, nothing to price-in.”
About:
deVere Group is one of the world’s largest independent advisors of specialist global financial solutions to international, local mass affluent, and high-net-worth clients. It has a network of more than 70 offices across the world, over 80,000 clients and $12bn under advisement.
After breaking 1.1208, EURUSD continues moving downwards. Today, the pair may reach 1.1175 and then start a new correction to test 1.1280 from below. After that, the instrument may resume trading downwards with the short-term target at 1.1152.
GBPUSD, “Great Britain Pound vs US Dollar”
GBPUSD has broken 1.2555 to the upside and may start another correction to reach 1.2615 (an alternative scenario). The main scenario implies that the price continue trading inside the downtrend with the short-term target at 1.2450.
USDCHF, “US Dollar vs Swiss Franc”
After breaking 0.9990, USDCHF continues forming the third wave 1.0056. An alternative scenario suggests that the pair may start a new correction towards 0.9960. According to the main scenario, the instrument is expected to continue moving upwards.
USDJPY, “US Dollar vs Japanese Yen”
USDJPY is trading downwards. Possibly, the pair may continue consolidating around 108.33. Today, the price may form a new descending structure to reach 107.97 and then start another growth with the target at 108.96. Later, the market may resume trading downwards to return to 108.33.
AUDUSD, “Australian Dollar vs US Dollar”
After updating the lows, AUDUSD has broken the narrow descending channel and may start a new correction towards 0.6904 (an alternative scenario). According to the main scenario, the instrument is expected to continue trading inside the downtrend with the target at 0.6829.
USDRUB, “US Dollar vs Russian Ruble”
USDRUB has extended the third wave and almost reached the target at 63.90. Possibly, today the pair may consolidate near the lows. If later the price breaks the range to the upside, the instrument may be corrected towards 64.70; if to the downside – resume trading inside the downtrend with the target at 63.20.
XAUUSD, “Gold vs US Dollar”
After returning to 1350.00, Gold has completed the descending impulse along with the correction. Today, the pair may break the low of this impulse at 1340.00. The short-term target is at 1323.25.
BRENT
After rebounding from 60.60. Brent is forming a new ascending impulse with the first target at 63.60. After that, the instrument may start a new decline towards 61.60 and then continue growing with the short-term target at 66.40.
Attention! Forecasts presented in this section only reflect the author’s private opinion and should not be considered as guidance for trading. RoboForex LP bears no responsibility for trading results based on trading recommendations described in these analytical reviews.
As we can see in the H4 chart, after completing the short-term pullback, GBPUSD has broken the local low; right now, it is still falling towards the post-correctional extension area between 138.2% and 161.8% fibo at 1.2483 and 1.2431 respectively. The key downside target is at 1.2395. At the same time, there is a divergence on MACD, which may indicate a new correctional wave to the upside in the future. The resistance is at 1.2763.
In the H1 chart, the convergence made the pair start a new short-term rising correction, which has already reached 23.6% fibo. Possibly, the correction may yet continue towards 38.2% and 50.0% fibo at 1.2602 and 1.2631 respectively. However, if the price breaks the local low at 1.2506, the downtrend may continue.
EURJPY, “Euro vs. Japanese Yen”
As we can see in the H4 chart, after finishing the correction, EURJPY is trying to form a new descending wave to break the low 120.78 and reach 76.0% fibo at 120.25. After that, the instrument may form a new descending structure to reach the long-term low at 117.96.
In the H1 chart, the pair is nearing the low, but there is a convergence on MACD, which may indicate a new correction in the future. The possible targets of this correction may be 23.6%, 38.2%, and 50.0% fibo at 121.35, 121.70, and 121.98 respectively.
Attention! Forecasts presented in this section only reflect the author’s private opinion and should not be considered as guidance for trading. RoboForex LP bears no responsibility for trading results based on trading recommendations described in these analytical reviews.
EUR/USD keeps showing a negative trend. Yesterday the trading instrument updated the local minimums. In May, the inflation in the EU slowed down to 1.2% year-to-year. The EU is under pressure due to the comments by the head of the CBE. Mario Draghi mentioned that the regulator is willing to review additional sanctions to stimulate the economy. The quotes are consolidating around 1.11800-1.12100. The investors are waiting for the Federal Reserve to announce the new rate. It’s expected that it will remain the same. However, the meeting may be used to send some signals for the further decrease of the rates next year. Keep an eye on the comments and rhetorics of the Central Bank representatives.
At 21:00 (GMT+3:00) the Federal Reserve will announce the key interest rate.
The price fixed below 50 MA and 100 MA which points to the power of the sellers.
The MACD histogram is in the negative zone but above the signal line which gives a weak signal to sell EUR/USD.
The Stochastic Oscillator is near the oversold zone, the %K line is crossing the %D line. There are no signals at the moment.
Trading recommendations
Support levels: 1.11800, 1.11500
Resistance levels: 1.12100, 1.12400, 1.12700
If the price fixes below 1.11800, expect further descend towards 1.11500-1.11200.
Alternatively, the quotes can recover towards 1.12400-1.12700.
The GBP/USD currency pair
Technical indicators of the currency pair:
Prev Open: 1.25318
Open: 1.25566
% chg. over the last day: +0.26
Day’s range: 1.25517 – 1.25698
52 wk range: 1.2438 – 1.3631
GBP/USD stabilized after a long descend. The GBP is consolidating around 1.24450-1.25800. The market participants are waiting for the UK inflation report. Keep tracking the Brexit issue and open positions from the key levels. The quotes can correct soon.
At 11:30 (GMT+3:00) the UK will publish a consumer price index.
The indicators do not provide precise signals, the price has crossed 50 MA.
The MACD histogram is in the positive zone which points to the power of the buyers..
The Stochastic Oscillator is in the neutral zone, the %K line is below the %D line which gives a signal to sell GBP/USD.
Trading recommendations
Support levels: 1.25450, 1.25100
Resistance levels: 1.25800, 1.26100, 1.26550
If the price fixes above 1.25800, expect further correction towards 1.26100-1.26500.
Alternatively, the quotes can fall towards 1.25100-1.25000.
The USD/CAD currency pair
Technical indicators of the currency pair:
Prev Open: 1.34121
Open: 1.33780
% chg. over the last day: -0.29
Day’s range: 1.33648 – 1.33820
52 wk range: 1.2727 – 1.3664
USD/CAD started to descend after a long rally. CAD set the new local minimums. The quotes are consolidating around 1.33650-1.33900. The trading instrument can correct further. We expect important reports from Canada. Keep an eye on the US news feed and oil quotes dynamics, open positions from the key levels.
Basis consumer price index in Canada will be published at 15:30 (GMT+3:00)
The indicators do not provide precise signals, the price has crossed 100 MA.
The MACD histogram is in the negative zone but above the signal line which gives a weak signal to sell USD/CAD.
The Stochastic Oscillator is in the overbought zone, the %K line is crossing the %D line. There are no signals at the moment.
Trading recommendations
Support levels: 1.33650, 1.33450, 1.33200
Resistance levels: 1.33900, 1.34200, 1.34350
If the price fixes below 1.33650, expect further correction towards 1.33450-1.33200.
Alternatively, the quotes can grow towards 1.34200-1.34400.
The USD/JPY currency pair
Technical indicators of the currency pair:
Prev Open: 108.523
Open: 108.446
% chg. over the last day: +0.26
Day’s range: 108.256 – 108.618
52 wk range: 104.97 – 114.56
The safe haven currencies keep moving sideways. The technical picture remains ambiguous. The quotes are testing the levels at 108.200 and 108.450. The market participants are waiting for the Federal Reserve to announce a key interest rate. Keep an eye on US Treasury bonds` yield. Open positions from the key levels.
During the Asian session, Japan published mixed reports on the trading balance.
The indicators do not provide precise signals, 50 MA is crossing 100 MA.
The MACD histogram is close to 0.
The Stochastic Oscillator is in the oversold zone, the %K line is below the %D line which gives a weak signal to sell USD/JPY.
Trading recommendations
Support levels: 108.200, 108.000, 107.850
Resistance levels: 108.450, 108.600, 108.750
If the price fixes below 108.200, expect a descend towards 108.000-107.850.
Alternatively, the quotes can grow towards 108.600-108.750.