The US dollar fell slightly against the basket of major currencies before the Fed meeting. Financial market participants expect the regulator to keep the interest rate at the current level of 2.25-2.5%. However, it is possible that in July the Fed will reduce the interest rate due to the deteriorating situation in the global economy. The US dollar index #DX closed in the negative zone (-0.25) yesterday.
Yesterday, at the annual ECB forum, the head of the regulator, Mario Draghi, said that the Eurozone economy would need new expansionary actions if its future growth and inflation forecasts turned out to be just as weak. The ECB is ready to reduce interest rates and resume asset purchases. US President Donald Trump blamed the ECB, and at the same time, the Chinese government, in an attempt to weaken their national currencies to gain a competitive advantage over the United States.
The British pound is still under pressure due to the possibility of “hard” Brexit. The sentiment of financial markets will depend on the upcoming economic events. Today, the consumer price index will be published in the UK, and tomorrow the Bank of England will decide on the interest rate.
The “black gold” prices are consolidating after a significant increase the day before. At the moment, futures for the WTI crude oil are testing the mark of $54.00 per barrel. At 17:30 (GMT+3:00), a report on crude oil inventories will be published in the US.
Market Indicators
Yesterday, the bullish sentiment was observed in the US stock market: #SPY (+1.05%), #DIA (+1.39%), #QQQ (+1.45%).
The 10-year US government bonds yield rose slightly. Currently, the indicator is at the level of 2.06-2.07%.
The news feed on 2019.06.19:
– Statistics on inflation in the UK at 11:30 (GMT+3:00); – Core consumer price index in Canada at 15:30 (GMT+3:00); – Fed interest rate decision at 21:30 (GMT+3:00).
We also recommend paying attention to the speech by the ECB President Draghi.
Today, the eyes of the market will be on the Fed rate decision. And due to the yield sensitivity of the JPY, we want to focus on the USD/JPY.
After the weak NFPs, and the dovish comments from Fed chairman Powell around two or so weeks ago, combined with markets aggressively pricing in three rate cuts from the Fed until December – and we increasingly expect the first steps in that direction today. However, such expectations cooled a bit over yesterday, in response to the Atlanta Fed Tracker jumping to 2.1% from 1.4% after last Friday’s Retail Sales data.
While the US dollar gained some momentum against the Euro or GBP, the JPY traded stable against the dollar which seems to come as a surprise, probably suggesting that bond and JPY traders are still very careful and consider a surprising cut from the Fed a serious option.
That said, any dovish rhetoric and/or surprising rate cut today is a potential bearish driver for the USD/JPY, leaving the currency pair vulnerable to a significant drop below 108.00 respectively the significant support region around 107.50/70.
Such a break lower levels the path down to the January Flash Crash lows around 105.00, especially if in addition to this outlook geopolitical tensions between the US and Iran keep on rising, triggering a risk-off move and leaving market participants unwinding their carry trades in JPY.
Technically speaking a drop lower stays an option as long as we trade below 110.70 on a daily time-frame:
Source: Admiral Markets MT5 with MT5-SE Add-on USD/JPY Daily chart (between March 19, 2018, to June 18, 2019). Accessed: June 18, 2019, at 10:00pm GMT – Please note: Past performance is not a reliable indicator of future results, or future performance.
In 2014, the value of the USD/JPY increased by 13.7%, in 2015, it increased by 0.5%, in 2016, it fell by 2.8%, in 2017, it fell by 3.6%, in 2018, it fell by 2.7%, meaning that after five years, it was up by 4.1%.
Investing in Forex with Admiral Markets
Admiral Markets offers professional traders the ability to trade with a custom, upgraded version of MetaTrader 5, allowing you to experience trading at a significantly higher, more rewarding level. Experience benefits such as the addition of the Market Heat Map, so you can compare various currency pairs to see which ones might be lucrative investments, access real-time trading data, and so much more. Click the banner below to start your FREE download of MT5 Supreme Edition!
Disclaimer: The given data provides additional information regarding all analysis, estimates, prognosis, forecasts or other similar assessments or information (hereinafter “Analysis”) published on the website of Admiral Markets. Before making any investment decisions please pay close attention to the following:
This is a marketing communication. The analysis is published for informative purposes only and are in no way to be construed as investment advice or recommendation. It has not been prepared in accordance with legal requirements designed to promote the independence of investment research, and that it is not subject to any prohibition on dealing ahead of the dissemination of investment research.
Any investment decision is made by each client alone whereas Admiral Markets shall not be responsible for any loss or damage arising from any such decision, whether or not based on the Analysis.
Each of the Analysis is prepared by an independent analyst (Jens Klatt, Professional Trader and Analyst, hereinafter “Author”) based on the Author’s personal estimations.
To ensure that the interests of the clients would be protected and objectivity of the Analysis would not be damaged Admiral Markets has established relevant internal procedures for prevention and management of conflicts of interest.
Whilst every reasonable effort is taken to ensure that all sources of the Analysis are reliable and that all information is presented, as much as possible, in an understandable, timely, precise and complete manner, Admiral Markets does not guarantee the accuracy or completeness of any information contained within the Analysis. The presented figures refer that refer to any past performance is not a reliable indicator of future results.
The contents of the Analysis should not be construed as an express or implied promise, guarantee or implication by Admiral Markets that the client shall profit from the strategies therein or that losses in connection therewith may or shall be limited.
Any kind of previous or modeled performance of financial instruments indicated within the Publication should not be construed as an express or implied promise, guarantee or implication by Admiral Markets for any future performance. The value of the financial instrument may both increase and decrease and the preservation of the asset value is not guaranteed.
The projections included in the Analysis may be subject to additional fees, taxes or other charges, depending on the subject of the Publication. The price list applicable to the services provided by Admiral Markets is publicly available from the website of Admiral Markets.
Leveraged products (including contracts for difference) are speculative in nature and may result in losses or profit. Before you start trading, you should make sure that you understand all the risks.
As our research team continues to pour over the charts and look for any signs of direction regarding tomorrow’s Fed news, we put together a couple the charts that may highlight some expectations and in at what the markets may do the rest of the week.
The expectations that the US Federal Reserve may maintain rates at current levels or potentially drop rates by a quarter percent leaves an open interpretation as to how the global markets will digest this news. Obviously, leaving rates unchanged would be the most benign action the Fed could take. Often though, the markets interpret this as a sign of weakness. Whereas a quarter percent decrease in the US fed rates would suggest that the Fed is preparing for future economic weakness in the US and potential global economy, yet investors may consider this as a very bullish reaction to the Fed.
Our belief is that the Fed will leave rates unchanged and possibly hint at adjusting rates lower later this year or early next year in preparation for the US presidential elections. The US economy is still moderately strong and the recent trade deal with Mexico as well as policy advancement in DC leads us to believe the Fed has no reason to adjust rates right now. Of course, a quarter percent decrease would allow the Fed to spur additional economic growth and potentially jump-start the waning housing market in the US.
This first chart of the YM, the Dow E-mini futures, highlights key price technical support and resistance that will likely come into play over the next 3 to 10 weeks. We ask you to pay special attention to the dual resistance levels above 26,500. These double resistance levels act as a double ceiling in regards to price advancement. In other words, some type of strong price advance of 27,000 would have to take place in order for the price to move beyond these resistance areas.
Should the Fed surprised the market and the market interpreted this move as strongly bullish, there is a moderate chance that the YM could advance beyond 27,000 before the end of this week or early next week. We believe the Fed news tomorrow will be interpreted as a protectionist stance and the market made move lower from current highs. Any big rotation lower after the Fed announcement tomorrow could prompt a new downside trend to retest our pennant/flag formation base near 25,000. Either way, our automated technical analysis prediction software will keep or get on the right side of the market.
Additionally, after the Fed announcement tomorrow, it is very likely that the US dollar may, under some pricing pressure and that precious metals could rocket hire and continue their advance towards $1450. Any market reaction to the downside in the US stock market and/or the US dollar would likely push precious metals well above recent highs. It all depends on how the market reacts to the US Fed announcement tomorrow, June 19.
We believe we have positioned our gold trades appropriately for the Fed news tomorrow. Either way, we believe gold, precious metals, and the miners will advance after the Fed news tomorrow. A close above $1375 in gold will prompt a very quick rallied towards $1440.
We’ll continue to watch how the markets react to the Fed news tomorrow with the knowledge that precious metals and gold should advance either way as fear and greed drive the metals higher. We’ll look for new trades near the end of next week after the Fed news shakes out the short term traders. There is nothing wrong with being on the right side of a profitable trade in precious metals and miners.
If you want to trade profitably with us and fellow traders from in 87 other countries be sure to join our Wealth Building Newsletters Today!
The Technical Traders Ltd has identified a unique price to volatility relationship between the SP500 and VIX index. The calculations required to compute the VIX index are composed of a number of factors. That final value of the VIX index is reported on an annualized basis. This means that VIX index as already internalized the past 12 months price volatility into the current VIX levels.
We believe this increased VIX volatility expectation could be muting future VIX spikes and trading systems focus on the VIX Index. The fact that the VIX as likely to internalized that large October to December 2018 price rotation and will not move beyond this price range until well after April or May of 2020 creates a unique problem for VIX systems and analysts. In short, the VIX has normalized a 20% price volatility expectation, or more, and will not reduce this expectation until well after April or May of 2020.
Taking a look at this weekly VIX chart clearly highlights the large 472% increase in January and February 2018. The reason why the VIX increased by this incredible amount is that the prior 12 months price volatility was extremely muted. The price rotation in the SPX was -343, for a total of -12%. The second VIX Spike between October and December of 2018 resulted in a 227% increase while price rotated more than 600 points, -20.61%, in the SPX. Obviously, the larger price movement in October through December 2018 would have likely resulted in a large VIX move if prior volatility expectations had remained the same.
It is our belief that the January to February 2018 price volatility rotation increase the VIX volatility expectations by at least 30 to 40%. The second, much larger, price rotation during October to December 2018 pushed the VIX volatility expectations higher by at least 10 to 15%. Our researchers believe the normalized VIX levels representing current price volatility are likely to stay above 12 or 13 until well after November or December 2019 if price volatility and expectations stay rather muted. Any additional large price rotations, to the downside, will likely continue to normalize or internalize increased VIX level volatility expectations.
This SPX chart helps to compare the relative VIX price increases in relation to the true SPX price volatility. We’ve also drawn a 12-month price window, as a red box on this chart, to highlight how the VIX attempts to normalize the past 12 months volatility going forward. It is our belief that a move above 500 to 600 points in the SPX may only prompt a rally in the VIX to near 28 to 30. Whereas, the same price swing from October to December 2018 prompted a VIX move to about 36. We would need to see the SPX move at least 900 points before the VIX will spike above 25 again. Remember after January or February of 2020 the VIX may begin to contract again as price volatility stays muted for the rest of this year.
We currently believe a large price rotation may be set up for near the end of 2019. Our proprietary cycle modeling systems and extended research are suggesting this downside move may begin sometime near August or September of 2019. Remember, this new VIX research suggests that any large price downswing may result in a very moderate VIX price increase at first. In other words, things could get very interesting towards the end of 2019 for traders.
Please take a minute to visit www.TheTechnicalTraders.com and see how we have been navigating, trading and profiting from the market over the past 17 months, I think you will be pleasantly surprised. Our research team believes the US stock market will likely form an extended pennant formation over the next 60+ days. Now is the time for us to plan and prepare for what may become a very volatile second half of 2019 and early 2020.
As we can see in the H4 chart, the ascending tendency continues. EURUSD has formed several Hammer reversal patterns close to the channel’s downside border, which may indicate a stronger signal. Right now, the pair is rebounding from the support level and may continue growing towards 1.1347. However, one shouldn’t exclude a possibility that the price may break the channel and resume falling to reach 1.1200.
USDJPY, “US Dollar vs. Japanese Yen”
The situation in the H4 chart hasn’t changed much over the last several trading sessions. After completing Shooting Star reversal pattern, USDJPY is trading sideways and testing the support level. Right now, bulls are trying to push the pair upwards, but they aren’t strong enough. Still, there is a possibility that they may yet beat bears and reach 109.15. However, one shouldn’t exclude another scenario, according to which the price may break the support level and fall towards at 107.50.
Attention! Forecasts presented in this section only reflect the author’s private opinion and should not be considered as guidance for trading. RoboForex LP bears no responsibility for trading results based on trading recommendations described in these analytical reviews.
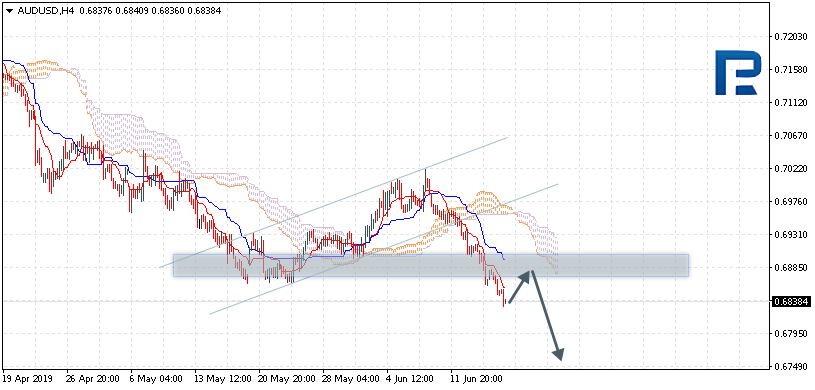
AUDUSD is trading at 0.6834; the instrument is moving below Ichimoku Cloud, thus indicating a descending tendency. The markets could indicate that the price may test Tenkan-Sen and Kijun-Sen at 0.6875 and then resume moving downwards to reach 0.6745. Another signal to confirm further descending movement is the price’s rebounding from the resistance level. However, the scenario that implies further decline may be cancelled if the price breaks the cloud’s upside border and fixes above 0.6945. In this case, the pair may continue growing towards 0.7015.
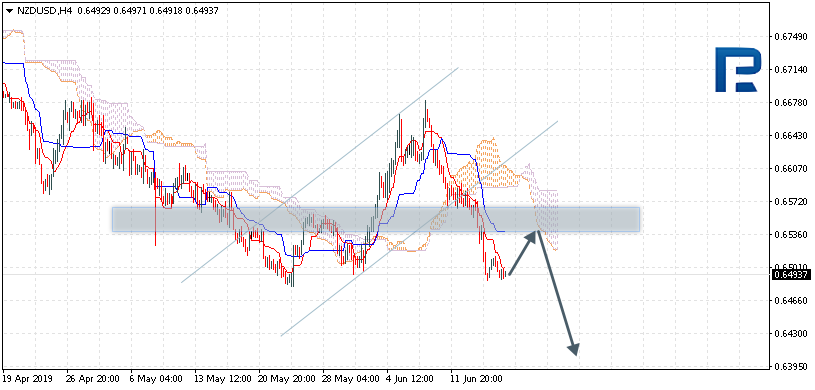
NZDUSD, “New Zealand Dollar vs US Dollar”
NZDUSD is trading at 0.6493; the instrument is moving below Ichimoku Cloud, thus indicating a descending tendency. The markets could indicate that the price may test the cloud’s downside border at 0.6535 and then resume moving downwards to reach 0.6420. Another signal to confirm further descending movement is the price’s rebounding from the resistance level. However, the scenario that implies further decline may be cancelled if the price breaks the cloud’s upside border and fixes above 0.6605. In this case, the pair may continue growing towards 0.6705.
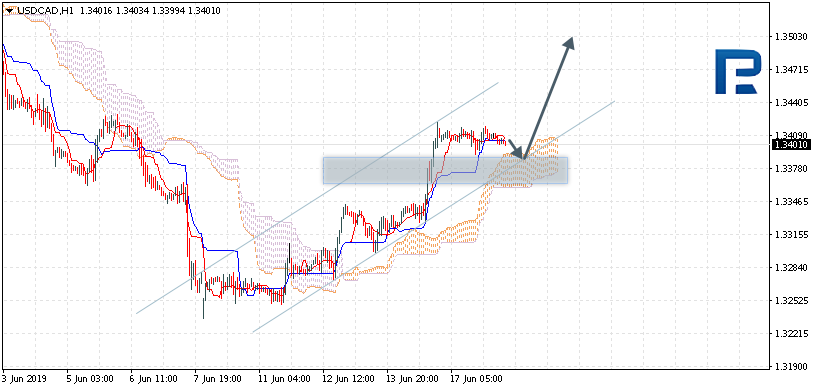
USDCAD, “US Dollar vs Canadian Dollar”
USDCAD is trading at 1.3401; the instrument is moving above Ichimoku Cloud, thus indicating an ascending tendency. The markets could indicate that the price may test the cloud’s upside border at 1.3395 and then resume moving upwards to reach 1.3505. Another signal to confirm further ascending movement is the price’s rebounding from the channel’s downside border. However, the scenario that implies further growth may be cancelled if the price breaks the cloud’s downside border and fixes below 1.3340. In this case, the pair may continue falling towards 1.3255.
Attention! Forecasts presented in this section only reflect the author’s private opinion and should not be considered as guidance for trading. RoboForex LP bears no responsibility for trading results based on trading recommendations described in these analytical reviews.
EUR/USD stabilized after a sharp descend at the end of last week. Right now the quotes are consolidating in the 1.12150-1.12400 range. The market participants are waiting for the Federal Reserve meeting. Some experts expect Jerome Powell to use this meeting as a signal for lowering the interest rate next year. Consider today`s economic releases and open positions from the key levels.
The Economic News Feed for 18.06.2019:
– Economic Mood Index by ZEW (GER) – 12:00 (GMT+3:00);
– Inflation Report (EU) – 12:00 (GMT+3:00);
– Real Estate Market Report (US) – 15:30 (GMT+3:00);
The indicators do not provide precise signals, the price has crossed 50 MA.
The MACD histogram is close to 0.
The Stochastic Oscillator is in the overbought zone, the %K line is crossing the %D line. There are no signals at the moment.
Trading recommendations
Support levels: 1.12150, 1.12000
Resistance levels: 1.12400, 1.12700, 1.12850
If the price fixes below 1.12150, expect the quotes to descend towards 1.11800-1.11600.
Alternatively, the quotes can recover towards 1.12600-1.12800.
The GBP/USD currency pair
Technical indicators of the currency pair:
Prev Open: 1.25798
Open: 1.25318
% chg. over the last day: -0.42
Day’s range: 1.25116 – 1.25441
52 wk range: 1.2438 – 1.3631
GBP/USD shows a clear descending trend. The GBP is consolidating near the annual minimums. The local support and resistance levels are 1.25150 and 1.25500. GBP can descend further. Boris Johnson can replace Theresa May as an acting Prime Minister due to having the most support by far as a potential leader of the Conservative party. Earlier the official promised to remove the UK from the EU with agreement or without it by October 31. You should open positions from the key levels.
The Economic News Feed for 18.06.2019 is calm.
The indicators point to the power of the buyers, the price fixed below 50 MA and 100 MA.
The MACD is in the negative zone but above the signal line which points a weak signal to sell GBP/USD.
The Stochastic Oscillator is in the neutral zone.
Trading recommendations
Support levels: 1.25150, 1.25000, 1.24600
Resistance levels: 1.25500, 1.25800, 1.26100
If the price fixes below 1.25150 expect further descend towards 1.24700-1.24500.
Alternatively, the quotes can correct towards 1.25800-1.26000.
The USD/CAD currency pair
Technical indicators of the currency pair:
Prev Open: 1.34068
Open: 1.34121
% chg. over the last day: +0.03
Day’s range: 1.34005 – 1.34127
52 wk range: 1.2727 – 1.3664
USD/CAD stabilized after sharp growth last week. There is no defined trend, the quotes are consolidating around 1.34000. The pressure on the CAD is calused by the negative oil quotes. The trading instrument can grow further, you should open positions from the key levels.
The Economic News Feed for 18.06.2019 is calm.
The price fixed above 50 MA and 100 MA which points to the power of the buyers.
The MACD histogram is close to 0. There are no signals at the moment.
The Stochastic Oscillator is in the oversold zone, the %K line has crossed the %D line. There are no signals at the moment.
Trading recommendations
Support levels: 1.33900, 1.33650, 1.33450
Resistance levels: 1.34200, 1.34500
If the price fixes above 1.34200, expect further growth around 1.34500-1.34700.
Alternatively, the quotes can descend towards 1.33600-1.33400.
The USD/JPY currency pair
Technical indicators of the currency pair:
Prev Open: 108.497
Open: 108.523
% chg. over the last day: +0.03
Day’s range: 108.252 – 108.583
52 wk range: 104.97 – 114.56
USD/JPY keeps trading in a long flat. There is no defined trend. The local support and resistance are 108.200 and 108.450. The investors are waiting for additional drivers. Keep an eye on the US Treasury bonds’ yield and open positions from the key levels.
The Economic News Feed for 18.06.2019:
The indicators do not provide precise signals, 50 MA is crossing 100 MA.
The MACD histogram is in the negative zone and keeps descending which points to the bearish mood.
The Stochastic Oscillator is in the oversold zone, the %K line is crossing the %D line. There are no signals at the moment.
Trading recommendations
Support levels: 108.200, 108.000, 107.850
Resistance levels: 108.450, 108.700, 108.800
If the price fixes below 108.200, expect further descend towards 108.000-107.850.
Alternatively, the quotes can grow towards 108.600-108.800.
The whole of last week was positive for USD and negative for oil. Why is it important here? The reason for this is that the price of oil is very influential for the Canadian dollar. CAD is considered to be a commodity currency, so it rises when the prices of commodities (metals, energy) go up. Conversely, CAD loses out when commodity prices decline. So in a situation like this, we should see some nice gains on the USDCAD pair. Is that really the case right now?
Yes! USDCAD is climbing higher despite the strong sell signal from the 7th of June. Wait, what? Yes, on the 7th of June, we received a crucial sell signal for this instrument, but it happened to be a fake one. False breakouts are considered to be very good trading occasions. Trading in the opposite direction to the original breakout. In our case, that means buy. Our bullish outlook is additionally strengthened by the fact that USDCAD is already back above FOUR recent supports. We have a major upwards trend line, then the horizontal support at 1.33 and 1.338. On top of that, we are also back above the lower line of the small upwards channel formation (green).
Price action is telling us that the vast majority of traders here are bullish. Positive sentiment towards this instrument will be cancelled if we get a breakout of the blue support. This option currently seems less likely to happen.
Last week, the US dollar recovered some losses against a basket of world currencies. At the moment, investors have taken a wait-and-see attitude before the Fed meeting. Some experts believe that the head of the Central Bank, Jerome Powell, may use this meeting to give signals about a possible reduction in interest rates in the current year. According to the CME FedWatch Tool, more than 60% of financial market participants believe that the Fed may cut interest rates at a meeting in July.
The British pound has dropped significantly against the US dollar due to growing concerns about the fact that Boris Johnson, the leading candidate for the post of British Prime Minister, could lead the UK to exit from the European Union without a deal with Brussels. Johnson, a former foreign secretary, gained Matt Hancock’s support, that strengthened his position in the fight for leadership. This news surprised investors since Johnson was the face of the official campaign for Brexit in the 2016 referendum and promised to exit the UK from the EU with or without an agreement.
The bearish sentiment is still prevailing in the “black gold” market. At the moment, futures for the WTI crude oil are testing the mark of $51.85 per barrel. At 23:30 (GMT+3:00) a report on the API weekly crude oil stock will be published.
Market Indicators
Yesterday, the bullish sentiment was observed in the US stock market: #SPY (+0.04%), #DIA (+0.07%), #QQQ (+0.60%).
The 10-year US government bonds yield has been declining. Currently, the indicator is at the level of 2.05-2.06%.
The news feed on 2019.06.18:
– German ZEW economic sentiment index at 12:00 (GMT+3:00); – Data on Eurozone inflation at 12:00 (GMT+3:00); – Statistics on the real estate market in the US at 15:30 (GMT+3:00).
We also recommend paying attention to the speech by the ECB President Draghi.
On Monday, trading on the euro closed slightly up. Following Friday’s drop, the pair corrected to 1.1247 during yesterday’s European session. Sales recommenced from the balance line. This was to be expected, as the MA channels indicated a new bearish trend.
Market activity was low as traders began turning their attention towards the FOMC meeting, which begins today. The regulator could drop some hints as to when they will lower interest rates. Markets have already factored in a rate slash at the end of the year, but it could come sooner than expected.
15:30 US: building permits (May), housing starts (May).
17:00 UK: BoE’s Governor Carney speech.
17:00 Eurozone: ECB’s President Draghi speech.
23:30 US: API weekly crude oil stock (14 Jun).
Current situation:
Yesterday’s expectations were met in full. The pair recovered to the LB balance line (SMA with a period of 55). After dropping to 1.1214, the pair again returned to the trend line (started from the 1.1344 high).
At the time of writing, the euro is trading at 1.1234. Since the euro crosses are trading up, and the stochastic is in the sell zone, I’m expecting to see a breakout of the trend line, with the pair subsequently being dragged to 1.1250, followed by a drop to the lower boundary of the horizontal channel. The Fed will make an interest rate decision on Wednesday, so the rate is unlikely to stray far from 1.1235. I think the pair will keep trading within the blue channel shown on the chart.