The demand for safe assets is still at a fairly high level due to the US conflict with Iran. Yesterday, US President Donald Trump imposed sanctions against Iran’s Supreme Leader Ayatollah Ali Khamenei. The President noted that the sanctions would also affect the Ayatollah’s entourage. Donald Trump believes that the new sanctions will not allow Khamenei to use the American financial system. Trump also accused Khamenei of Iran’s hostile behavior. The US president said the sanctions were “strong and proportionate response to Iran’s increasingly provocative actions.”
In response, Iranian Foreign Ministry Spokesman Abbas Mousavi said that these sanctions signify the end of diplomatic relations between the US and Iran. He also noted that the Trump government was destroying all established international mechanisms for maintaining world peace and security. The US dollar index #DX closed in the negative zone (-0.24%).
Today, investors will assess a number of economic reports from the United States. So, CB consumer confidence index, as well as new home sales, will be published in the US. Financial market participants expect a meeting of the leaders of the US and China during the G20 summit, which will be held on June 28-29 in Osaka.
The “black gold” prices are consolidating after a sharp rise the day before. At the moment, futures for the WTI crude oil are testing the mark of $58.00 per barrel. At 23:30 (GMT+3:00) the API weekly crude oil stock will be published.
Market Indicators
Yesterday, there was a variety of trends in the US stock market: #SPY (-0.12%), #DIA (+0.03%), #QQQ (-0.22%).
The 10-year US government bonds yield is 2.02-2.03%.
The news feed on 2019.06.25:
– CB consumer confidence index in the US at 17:00 (GMT+3:00); – New home sales in the US at 17:00 (GMT+3:00).
We also recommend paying attention to the speech by Fed Chairman Powell.
On Monday the 24th of June, trading on the euro closed up by 0.26%. The pair moved upwards within a 24-pip corridor. There was no significant economic news planned for Monday. The euro was held up above 1.1370 thanks to the euro crosses along with a declining US dollar, which has been under pressure since the FOMC meeting.
16:00 US: S&P/Case-Shiller home price indices (Apr).
17:00 US: Richmond Fed manufacturing index (Jun), new home sales (May).
20:00 US: Fed’s Chair Powell speech.
20:15 Eurozone: ECB’s Cœuré speech.
Current situation:
Yesterday didn’t turn out as expected. I’m not sure why speculators still have an appetite for risk with the meeting between the leaders of China and the US looming (the coming weekend). It’s as if the major players already know what’s going to happen there. And what about the ECB’s loose monetary policy?
US President Donald Trump has ordered new economic sanctions against Iran. The increased tensions have boosted the oil market, which in turn has boosted commodity currencies.
I’m not changing the forecast I made yesterday. The only thing is that after hitting a fresh high, the 45th degree has shifted upwards. The pair has broken the lower boundary of the channel and is now trading at 1.1389. I’m expecting a drop to 1.1365. If a sharp upwards rebound doesn’t follow, we can expect a drop to around 1.1340.
EURUSD continues rising. On Monday June 24th, the instrument is mostly trading close to 1.1376. Market players aren’t as active as usual, but it may change in a moment.
The USD still remains under significant pressure after the US Federal Reserve gave very clear signals last week that it was ready to cut the rate in case the country’s economy slowed down. On one hand, it means that the USA are ready to continue its trade wars against China and others and for this purpose they require quite soft monetary policy in the country to avoid any slowdowns in its economy and inflation. On the other hand, the USA don’t need their currency to be strong right now, so they may kill two birds with one stone.
Other members of the FOMC are also saying that it’s the high time to cut the rate, by 50 basis points. Of course, it sounds too negative for the USD.
This week, the macroeconomic calendar is quite empty. As always, all interesting reports at the end of the month are centered on Friday.
As we can see in the H4 chart, after completing the five-wave rising structure, EURUSD is consolidating at its top. Possibly, the pair may form a reversal patterns close to the highs. After breaking 1.1355, the price may start a new descending wave (as a correction) to reach 1.1222. From the technical point of view, this scenario is confirmed by Stochastic Oscillator, as its signal line is trading inside the “overbought area”. To confirm the above-mentioned wave, the indicator must leave the area.
In the H1 chart, EURUSD is consolidating around 1.1375. Possible, the pair may extend the ascending structure towards 1.1394. After reaching this level, the price may start a new decline towards 1.1355 and, as a result, break the ascending channel and start a new wave to the downside with the first target at 1.1305. From the technical point of view, this scenario is confirmed by MACD Oscillator, as its signal line is ready to move downwards and reach 0. After breaking is, the instrument may quicken its decline towards 1.1222.
Disclaimer
Any predictions contained herein are based on the authors’ particular opinion. This analysis shall not be treated as trading advice. RoboForex shall not be held liable for the results of the trades arising from relying upon trading recommendations and reviews contained herein.
EURUSD is still consolidating above 1.1365. Possibly, today the pair may test this level from above. If the price breaks it, the instrument may start another correction with the first target at 1.1344. Later, the market may form one more ascending structure to return to 1.1365 and then start a new decline to reach 1.1266.
GBPUSD, “Great Britain Pound vs US Dollar”
GBPUSD is consolidating around 1.2746. According to the main scenario, the instrument is expected to form one more ascending structure towards 1.2760 and then resume trading downwards to reach 1.2727. If later the price breaks this level, the instrument may continue trading inside the downtrend with the first target at 1.2700.
USDCHF, “US Dollar vs Swiss Franc”
USDCHF is still consolidating above 0.9750. Today, the pair may form one more ascending structure with the first target at 0.9800.
USDJPY, “US Dollar vs Japanese Yen”
USDJPY is consolidating around 107.33. Possibly, today the pair may grow to reach 107.55 and then form a new descending structure towards 107.22. If later the price breaks this level, the instrument may continue trading inside the downtrend with the short-term target at 106.90.
AUDUSD, “Australian Dollar vs US Dollar”
After forming another consolidation range above 0.6907, AUDUSD broke it upwards; by now, it has extended the third wave towards 0.6960. Today, the pair may fall towards 0.6935 and then start another growth to reach 0.6983.
USDRUB, “US Dollar vs Russian Ruble”
USDRUB is still consolidating around 63.24. Possibly, today the pair may form a new descending structure towards 62.77. After that, the instrument may start a new growth with the target at 64.00.
XAUUSD, “Gold vs US Dollar”
Gold is consolidating around 140.00. If later the price breaks the range to the upside, the instrument may extend the structure towards 1418.20; if to the downside – start another decline with the target at 1366.00.
BRENT
Brent is still trading upwards; right now, it is forming another continuation pattern at 65.20. The short-term target is at 66.60. After that, the instrument may start a new correction to return to 64.20 and then continue growing with the first target at 67.70.
Attention! Forecasts presented in this section only reflect the author’s private opinion and should not be considered as guidance for trading. RoboForex LP bears no responsibility for trading results based on trading recommendations described in these analytical reviews.
In case of XAUUSD, it’s better to analyze the current situation using the daily chart. From the technical point of view, we can see that the pair has reached the post-correctional extension area between 138.2% and 161.8% fibo. At the same, we should note that the price is getting closer to long-term correctional 50.0% fibo at 1422.00. The support is the previous low at 1346.68. At the same time, there is a divergence on MACD, which may indicate a possible reverse soon.
In the H4 chart, there is a divergence on MACD, which indicates a possible pullback in the nearest future. The downside targets are 23.6%, 38.2%, and 50.0% fibo at 1378.30, 1357.40, 1324.30, and 1340.60 respectively. The resistance is the high at 1411.85.
USDCHF, “US Dollar vs Swiss Franc”
Let’s consider the long-term scenario of USDCHF on the daily chart. There was a divergence on MACD, which made the pair reverse and start a new descending tendency. By now, it has already reached 38.2 fibo. The next downside targets may be 50.0% and 61.8% fibo at 0.9712 and 0.9589 respectively. The resistance is at 23.6% fibo at 0.9987.
In the H4 chart, the downtrend continues; the pair has already reached the post-correctional extension area between 138.2% and 161.8% fibo. The next target may be 50.0% fibo at 0.9712. At the same time, there is a convergence on MACD, which indicates a possible pullback soon.
Attention! Forecasts presented in this section only reflect the author’s private opinion and should not be considered as guidance for trading. RoboForex LP bears no responsibility for trading results based on trading recommendations described in these analytical reviews.
EUR\USD remains in a bullish mood. Last week, the euro updated key extremes and reached three-month highs. The demand for Greenback has weakened significantly since the Fed meeting. The regulator is ready to consider the question of lowering interest rates at upcoming meetings. Additional support for the single currency provide positive data on business activity in the euro area, which were published on Friday. At the moment, EUR/USD quotes are consolidating. Local levels of support and resistance are 1.13550 and 1.13850, respectively. Trading instrument has the potential for further growth. Positions must be opened from key levels.
The Economic News Feed for 24.06.2019:
– IFO Business climate index (EU) – 00:00 (GMT+3:00);
The price fixed above 50 MA and 100 MA which points to the power of the buyers.
The MACD histogram is in the positive zone but below the key line which gives a weak signal t buy EUR\USD
The Stochastic Oscillator is in the neutral zone, the %K line is below the %D line which points to a correction of EUR\USD.
Trading recommendations
Support levels: 1.13550, 1.13400, 1.13100
Resistance levels: 1.13850, 1.14000, 1.14400
If the price fixes above 1.13850, expect a growth towards 1.14200-1.14400.
Alternatively, the quotes can correct towards 1.13200-1.14400.
The GBP/USD currency pair
Technical indicators of the currency pair:
Prev Open: 1.27033
Open: 1.27328
% chg. over the last day: +0.32
Day’s range: 1.27297 – 1.27595
52 wk range: 1.2438 – 1.3631
GBP/USD shows a steady uptrend. Currently, sterling is consolidating near monthly highs. GBP/USD quotes are testing local resistance at 1.27600. 1.27250 is already a “mirror” support. Demand for the USD remains at a fairly low level. Trading instrument has the potential for further growth. We recommend to keep track of current information on the issue of Brexit. Positions must be opened from key levels.
The Economic News Feed for 24.06.2019 is calm.
The price fixed above 50 MA and 100 MA which points to the power of the buyers.
The MACD histogram is in the positive zone and keeps rising which gives a strong signal to buy GBP\USD.
The Stochastic Oscillator is in the neutral zone, the %K line is crossing the %D line. There are no signals at the moment.
Trading recommendations
Support levels: 1.27250, 1.26750, 1.26450
Resistance levels: 1.27600, 1.28000
If the price fixes above 1.27600, expect further growth towards 1.28000.
Alternatively, the quotes can descend towards 1.26900-1.26600.
The USD/CAD currency pair
Technical indicators of the currency pair:
Prev Open: 1.31897
Open: 1.32137
% chg. over the last day: +0.24
Day’s range: 1.31817 – 1.32164
52 wk range: 1.2727 – 1.3664
USD/CAD continues to consolidate. There is no unidirectional trend. CAD is testing local supply and demand zones: 1.31500-1.31750 and 1.32250-1.32500, respectively. USD/CAD quotes can decline further. Additional support for the CAD is provided by the positive dynamics of oil prices. Positions must be opened from key levels.
The Economic News Feed for 24.06.2019 is calm.
The indicators do not provide precise signals, the price has crossed 50 MA.
The MACD histogram started to descend which points to the bearish mood.
The Stochastic Oscillator is in the oversold zone, the %K line is crossing the %D line. There are no signals at the moment.
Trading recommendations
Support levels: 1.31750, 1.31500, 1.31200
Resistance levels: 1.32250, 1.32500, 1.33000
If the price fixes below 1.31750, expect further descend towards 1.31400-1.31200.
Alternatively, the quotes can grow towards 1.32600-1.32800.
The USD/JPY currency pair
Technical indicators of the currency pair:
Prev Open: 107.288
Open: 107.304
% chg. over the last day: +0.02
Day’s range: 107.266 – 107.481
52 wk range: 104.97 – 114.56
The USD / JPY currency pair stabilized after a sharp decline last week. The technical picture is ambiguous. At the moment, the USD / JPY quotes are consolidating. Local levels of support and resistance are: 107.250 and 107.500, respectively. The yen has the potential for further growth against the US dollar. We recommend to pay attention to the dynamics of the yield of US government securities. Positions must be opened from key levels.
The Economic News Feed for 24.06.2019 is calm.
The indicators do not provide precise signals, the price has crossed 50 MA.
The MACD histogram is close to 0. There are no signals.
The Stochastic Oscillator is in the overbought zone, the %K line is crossing the %D line. There are no signals.
Trading recommendations
Support levels: 107.250, 107.000
Resistance levels: 107.500, 107.700, 107.850
If the price fixes below 107.250, expect further descend towards 107.000-106.800.
Alternatively, the quotes can grow towards 107.800-108.000.
After the incredible week we’ve seen, with the Fed leaving rates unchanged and precious metals rocketing higher above their previous five-year highs, it’s time we pay attention to what’s happening in the financial sector and the US stock market majors. Closing out this week, we heard all traders and investors pay very close attention to the US dollar, precious metals, and the US major indexes.
There are a number of major factors taking place throughout the world that will likely drive future price trends over the next 30 to 60 days. Tensions in the Middle East, debt issues in China and Europe, central bank actions throughout the world and the US, and the ultimate driver of price moves – fear and greed. We’ve mentioned to a number of associates recently that our research focuses on the transition of traders from fear into greed. Our belief is that as traders begin to fear certain events or price trends, the price action tends to become more volatile. As this volatility increases and trends accelerate, traders transition this fear into greed where they attempt to take advantage of opportunities generated by large price swings.
We believe the global markets are entering a fear cycle populated by many of the issues and uncertainties we mentioned above. The fact that a number of unsettled, and potentially dangerous, global economic and political issues are taking place increases the fear component in the markets. This increased fear, and combination with increased volatility, will transition into increased greed as price trends accelerate.
This XLF weekly chart, below, highlights a price pattern formation, the Pennant/Flag formation, that we believe is nearly complete. This price formation is setting up an apex pattern that should complete near July 12 through July 20. It is very likely that a breakout or break down price reaction will take place before July 20. Our researchers believe the dominant price trend of the breakout will be to the downside and that a possible 15 to 25% downside price move in the financial sector is likely.
This type of downside price rotation would likely push price lower, towards the November/December 2018 lows before finding support.
This Goldman Sachs weekly chart highlights a similar price pattern as the XLF above. When we see these types of patterns across multiple charts, it lends credibility to the overall analysis and research we are conducting. In other words, when we see the same thing setting up across multiple charts it becomes almost impossible to misinterpret. Please pay special attention to the Fibonacci projected target levels, the extended lines, and colored squares to the right of prices, to understand the type of volatility that is currently within the markets.
When volatility is narrow, price expansion or contraction is also fairly narrow. When volatility is excessive, price expansion or contraction is also labeled as excessive. Currently, in all of these charts, we are seeing price volatility, based on our proprietary Fibonacci price modeling system, in the range of 10% to 20% or more.
Our researchers believe the markets are setting up for a breakdown price swing, potentially retesting lows near November/December 2018, and shaking out the markets. It is very common for the US stock market to experience price volatility and downwards price trends 8 to 20 months prior to a US Presidential election. We’ve authored a number of articles regarding this phenomenon. As we move closer to the actual election date, prices tend to stabilize an advance as outcomes and policies become more clear.
We believe a breakdown in the financial sector, as well as the US stock market, could only be a few weeks away. Our longer-term super cycle analysis suggests a possible peak in August or early September 2019. You can see from this SPY weekly chart, below, the SPY has already reached new all-time high again.
Given the dates of our super cycle research and the near completion of these pennant/flag formations, we believe the next 4 to 7 weeks of trading could be extremely volatile and attempt to create a very short term sideways flag formation on the daily charts that will prompt our price peak near the end of August or early September.
Any price breakdown in the US stock market will prompt a price anomaly pattern to set up where the price will move away from historical and predictive price ranges, base after finding support, then rally back towards new all-time highs again. Therefore, much like November/December 2018, we believe the downside rotation we are expecting after the breakout of the pennant/flag formation will react in a similar manner. We believe the next 3 to 5 weeks could be full of volatile sideways price rotation, ultimately attempting a new washed out price high in the SPY, ES, and DOW (possibly above the psychological level of $300, $3000 or $30,000) followed by an immediate -12 to -18% downside price move.
Ultimately, based on our research, the downside price move could be in excess of -20 to -25% or more. We believe the December 2018 lows will likely hold as ultimate support. Yet the reality of price volatility is that any fear/greed price swing could move well beyond these lows while attempting to hammer out a bottom.
We urge all traders to be very cautious over the next 3 to 5 weeks. Ultimately, this upside price swing will likely end near the psychological levels we’ve suggested and, as fear turns into greed, price rotation will likely push the global markets dramatically lower starting sometime in August or September 2019. This means we have about 5 to 7 weeks of volatile sideways trading near a pennant/flag apex that will likely result in large price rotation and the set up of a shorter-term pennant/flag formation on Daily charts. We believe this short-term pennant/flag formation set up will create the ultimate peak in late August or early September and prompt the larger downside move we are expecting.
Skilled traders will not get married to their long positions or short positions until this washout volatility is completed and tends really begin to take shape. Our advice to skilled traders is to expect some increased volatility, some wild price rotation, and a shakeout new-high, new-low type price formation (setting up the new short-term pennant/flag pattern) over the next few weeks. This is really becoming more of a traders market where short-term targets and trades will be keys to success. Longer-term trends and trend following systems will likely get chewed up over the next 45 to 65+ days.
Our super cycle research has given us a very clear picture as to what to expect over the next 24 months or longer.
I am going to give away and ship out silver rounds to anyone who buys a 1-year, or 2-year subscription to my Wealth Trading Newsletter. You can upgrade to this longer-term subscription or if you are new, join one of these two plans listed below, and you will receive:
Have been turning decidedly negative on USD of late, I stated at the start of the year that I expected the USD to moderate through 2019. However, as we all know currencies don’t do things in halves. Thus, a year of moderation will likely mean a period of strong declines coupled with period of strength.
We a clearly entering a period of declines for two reasons
First, market and economic fundamental reasoning. This being monetary policy shifts coupled with significantly weak US data falling US bond yields (the US 10-year yield fell below 2% for the first time in 3 years last week).
Last Wednesday the Federal Reserve for the first time since it’s GFC ‘response’ is now forecasting a rate cut rather than a hike.
It is only one by the end of 2020, but the market is forecasting 4 over the same period – this will begin to weigh on the USD and don’t be surprised to see the Fed downgrade its outlook further still as the year progresses.
However, it is more than just the Fed’s rates forecasting – it’s the fact the supply side of the US economy is slowing.
The Empire State manufacturing PMI fell at its most rapid pace on record for the month of June and recorded its lowest level since the trough of 2016.
The US home-builder survey decline for the first time this year. The decline was blamed on rising construction costs coupled with a shortage of construction workers and rising trade concerns.
This is a weakening outlook for the US and will force the Fed to act and will see the USD lower.
The second reason is geopolitical – The President is revitalising the term ‘Currency Wars’.
We have officially entered the race for the 2020 Presidential election. It is clear from the President’s re-election ‘speech’ coupled with a typical Twitter tirade basically accusing the ECB of currency manipulation that he is looking to bring the USD down in his next term.
Tweet 1: “Mario Draghi just announced more stimulus could come, which immediately dropped the Euro against the Dollar, making it unfairly easier for them to compete against the USA. They have been getting away with this for years, along with China and others,”
Tweet 2: “German DAX way up due to stimulus remarks from Mario Draghi. Very unfair to the United States!”
This has the potential to become quite problematic as the mechanisms at his disposal to physically pull the USD down are ‘limited’. But, trade threats, sanctions and even international litigation with the likes of the WTO are not out of realm of possibility for this President. Will be an interesting 18 months leading into November 2020.
When you combine these two factors – USD weakness is coming.
EURUSD is consolidating around 1.1288. If later the price breaks the range to the upside, the instrument may extend the structure towards 1.1339; if to the downside – start another correction with the target at 1.1264.
GBPUSD, “Great Britain Pound vs US Dollar”
GBPUSD is consolidating around 1.2697. According to the main scenario, the instrument is expected to form a new descending structure to break 1.2671 and then continue trading inside the downtrend with the first target at 1.2616.
USDCHF, “US Dollar vs Swiss Franc”
USDCHF has the daily descending structure. Today, the pair may form one more ascending structure with the predicted target at 0.9915. After that, the instrument may be corrected towards 0.9853 and then start a new growth to reach 1.0040.
USDJPY, “US Dollar vs Japanese Yen”
USDJPY has finished another descending structure of the third wave to the downside at 107.40. Possibly, today the pair may consolidate near the lows and even update 106.99. If later the price breaks the range to the upside, the instrument may form one more ascending structure with the first target at 107.85.
AUDUSD, “Australian Dollar vs US Dollar”
AUDUSD has finished the correctional structure of Flag pattern. Today, the pair may fall towards 0.6881 and then start another growth to reach 0.6911. Later, the market may form a new descending structure with the target at 0.6829.
USDRUB, “US Dollar vs Russian Ruble”
There was a gap down during the market opening and USDRUB is still trading downwards; it has already completed the structure with the short-term target at 62.92. Possibly, the pair may be corrected towards 63.87 and then resume trading inside the downtrend with the key target of the third descending wave at 62.77.
XAUUSD, “Gold vs US Dollar”
Gold has almost completed the extension of the daily ascending structure. Possibly, today the pair may consolidate close to the highs. If the price breaks the range to the downside, the instrument may form a new descending structure with the first target at 1374.85. Later, the market may grow towards 1393.33 and then resume trading downwards with the short-term target at 1339.20.
BRENT
After breaking 64.10, Brent is still trading upwards; right now, it is forming a continuation pattern right where it broke the descending channel. Today, the pair may grow with the short-term target at 66.60. After that, the instrument may start a new correction to return to 64.10 and then continue growing with the first target at 67.70.
Attention! Forecasts presented in this section only reflect the author’s private opinion and should not be considered as guidance for trading. RoboForex LP bears no responsibility for trading results based on trading recommendations described in these analytical reviews.
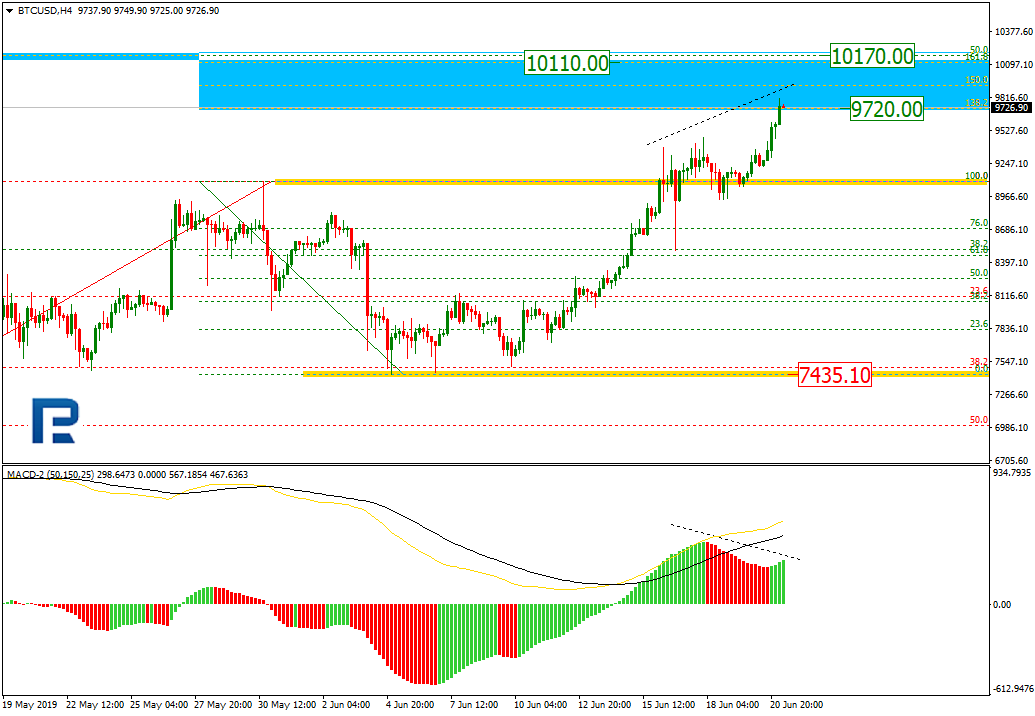
As we can see in the H4 chart, the ascending tendency continues. After breaking its previous high, BTCUSD has moved into the post-correctional extension area between 138.2% and 161.8% fibo at 9720.00 and 10110.00 respectively. The next upside target may be mid-term 50.0% fibo at 10170.00. The key support is at 7435.10. At the same time, there is a divergence on MACD, which may indicate a trend reverse.
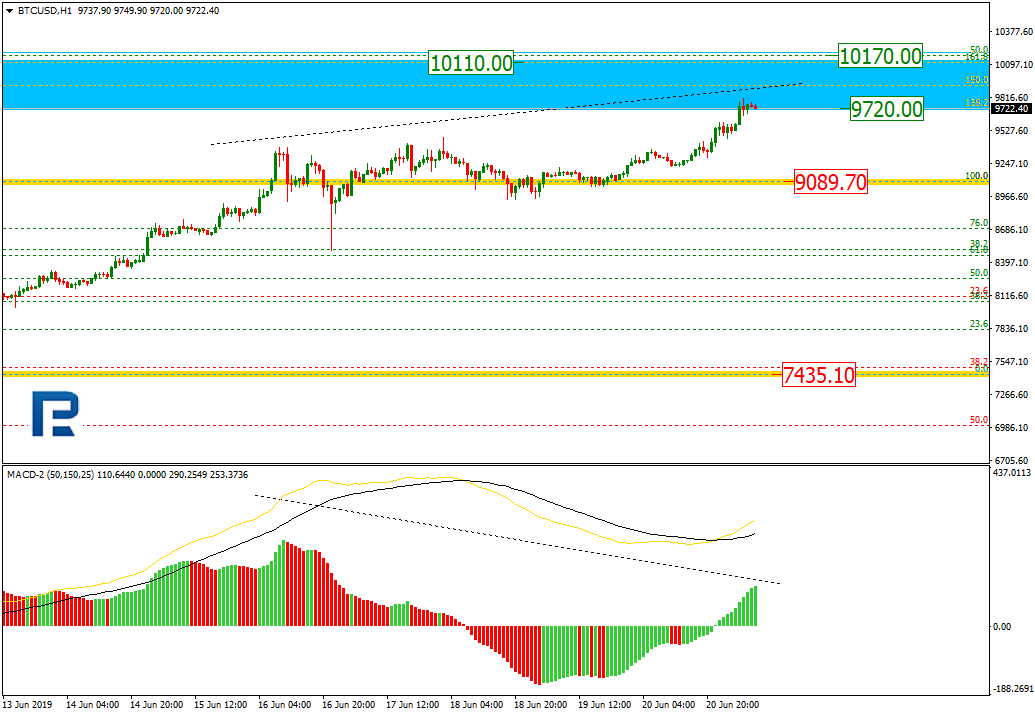
The H1 chart shows more detailed structure of the current uptrend.
ETHUSD, “Ethereum vs. US Dollar”
As we can see in the H4 chart, ETHUSD is about to reach its significant high at 288.82. If the price breaks it, the instrument may continue growing towards the post-correctional extension area between 138.2% and 161.8% fibo at 313.00 and 327.50 respectively. The support is the low at 226.56.
In the H1 chart, the pair is getting closer to the high at 288.82. At the same time, there is a divergence on MACD.
Attention! Forecasts presented in this section only reflect the author’s private opinion and should not be considered as guidance for trading. RoboForex LP bears no responsibility for trading results based on trading recommendations described in these analytical reviews.
 Current situation: