Author Archive for InvestMacro – Page 117

Is This The Next Great Oil Frontier?

By OilPrice.com – Nigeria has long been known for its oil riches.

Angola has too, but decades of entrenched corruption have chased foreign investors away.

Now Namibia is joining the African oil conversation with one of the most oil-friendly regimes on the continent. It’s offering 5% royalties on what might just be a very productive shale play in Reconnaissance Africa’s (RECO.V) Kavango Basin.

Emerging markets are where oil upside might be found these days but navigating them is a challenge.

Nigeria: How To Push Away Investors

Take Nigeria, for instance.

As Africa’s largest producer of oil, Nigeria has outsized status in the hydrocarbons world. But the party is coming to an end from an investor’s standpoint.

Nigeria is home to about 37 billion barrels in oil reserves. And while it’s got some 32 active oil rigs out there, only 81 wells were completed last year – down from 141 in 2014.

Since oil prices started tumbling in 2014, the government has been taking more from oil companies, with back taxes and new legislation. Now, it wants majors Chevron, Shell and French Total SA to pay them around $62 billion. It claims in was short-changed under a revenue-sharing agreement dating back to the 1990s.

Chevron (NYSE:CVX) is seeking to sell several Nigerian oilfields, and it isn’t the first: Exxon and Shell (NYSE:RDS.A) have both been reducing their footprint in the country.

And it might get worse.

Now, Nigeria is proposing new legislation that would increase taxation on the oil industry. The bill would add another 3-10 percent in royalty rates at oil prices between $50 and $80 per barrel. Nigeria’s current system gives Nigeria between 60 percent and 70 percent of all deepwater revenues, which includes taxes, royalties, along with state-run Nigerian National Petroleum Corporation’s share of production.

Angola: Reforms That Might Not Be Enough

Angola, too, is a tough sell right now. Even though it’s Africa’s second-largest producer, it’s been mired in decades of highly entrenched corruption, and while there is a new regime in power and reforms are on the books, investors aren’t 100-percent sold on the idea.

Angola is hoping to sell stakes in state-run Sonangol oil company and a string of other energy companies. To do that, it’s banking on major economic reforms to attract investors and bring in much-needed cash.

No one’s forgotten the gross mismanagement of Sonangol under its previous leadership, though, so the Angolan government is going to have to make people believe things have changed. Sonangol has a history it needs to overcome.

The goal is an IPO for Sonangol in 2022. Beyond that, the government is also hoping to lure investors into stakes in Puma Energy, the China-Sonangol oil venture, and the Ivory Coast SIR refinery. But it’s only been two years since we saw a change of regime in Angola, and investors don’t seem thoroughly convinced just yet.

In 2017, Joao Lourenco took power, ending the four-decade power play of Jose Eduardo dos Santos, along with his daughter’s destructive leadership of Sonangol. But two years may not be enough time to convince investors.

The government has made it easier for investors to repatriate money via commercial banks; it’s made it possible to invest in the sector without a local partner; and it cut taxes on some oilfields by 50%, creating an independent body for managing oil and gas concessions. The first litmus test will likely come later this year with the attempted sale of stakes in the SIR refinery.

But in the meantime, some bigger potential has emerged on the continent:

Namibia: Starting From Zero

Namibia – a country that has never produced a barrel – is the newest venue reaching the investment radar screen.

That’s because it has potential for new discoveries at a time when they are increasingly hard to come by.

Even better when it’s in an investor-friendly regime.

The so-called “Land of the Brave” has has an oil and gas friendly regime with only 5% royalties.

That’s why Exxon (NYSE:XOM) recently acquired an additional 7 million net acres from the government for a block extending from the shoreline to about 135 miles offshore in water depths up to 13,000 feet, with exploration activities to begin by the end of this year.

What Exxon’s banking on is that Namibia, which according to theory once fit together with Brazil, shares the same geology as Brazil’s pre-salt basins, Santos and Campos, which have already proved resource-rich, according to Deloitte.

But there’s also something onshore that has good potential.

Shale, and a basin that’s similar in size to the Eagle Ford basin in Texas.

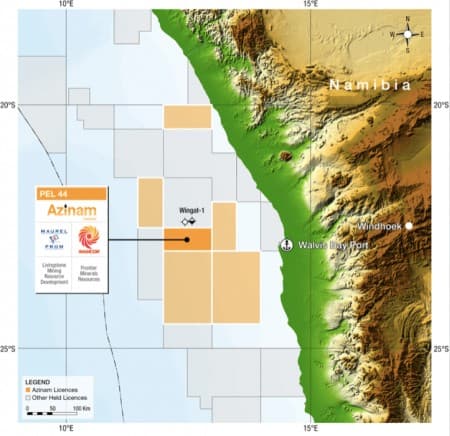
Welcome to the Kavango Basin.

Namibia’s Kavango Basin is part of the Karoo SuperGroup geology, and it’s also considered to have the same depositional environment as Shell’s Whitehill Permian shale play in South Africa.

Kavango is a 6.3-million-acre basin that potentially holds undeveloped shale and conventional plays. The entire basin is owned by a junior company called Reconnaissance Energy Africa (RECO.V) that recently received a 90% interest in the Petroleum Exploration Permit for the Kavango basin. The remaining 10% is owned by the Namibian state petroleum company.

When Reconnaissance Energy Africa took aeromagnetic data from the basin to the go-to geophysical interpreter Bill Cathey, according to Reconnaissance, Cathey said the data showed up to a 30,000 foot sedimentary basin.

The exploration permit is for 25,000 square kilometers (6.3 million acres). Usually, many companies hold the rights to such a large area whereas the Kavango is held by one company, Reconnaissance Energy Africa.

The reason for Reconnaissance Energy Africa (RECO.V) to take a chance on this is the fact that Kavango likely holds similar geology, deposited by the same Permian seaway, as Shell’s massive Permian shale play in South Africa, one of the top 10 shale plays in the world.

Recon is targeting for the same Permian shales at the lower portion of the Karoo Supergroup.

So far, Recon’s interpretation suggests that Kavango could be a big shale play in the Karoo Supergroup of rocks.

When it comes to exploration, Africa is one of the final frontiers for oil investors. And if it’s a junior explorer who makes a discovery and ends up sitting on a viable shale play, that becomes leverage for investors.

There are a lot of new companies in Namibia, but none with an entire basin as large as this.

Not only do they own the entire basin, but Reconnaissance Energy Africa (RECO.V) also has a 4-year exploration license for the basin, leading to a 25-year production license if there is a commercial production discovery.

Sproule–a tier 1 resource assessment company–estimated that Kavango has a potential 12 billion barrels of oil and 119 trillion cubic feet of natural gas. That’s for the shale, and there is also conventional potential.

The first well at Kavango is planned to be drilled in the second quarter of 2020, and this junior explorer Recon (RECO.V) is hoping for good results.

Other companies looking to find the next oil frontier:

Halliburton (NYSE:HAL) is one of the largest oilfield services companies in the world. The company has secured its place in the oil and gas industry. But it didn’t happen overnight.
The oilfield services sector is highly competitive and ripe with innovation. In order to stay ahead, companies must be on the absolute cutting edge of technology. And that’s exactly what Halliburton has done.

Schlumberger (NYSE:SLB) posted strong financials for the second quarter, with both revenue and earnings beating expectations. The oilfield services giant was hit hard by the oil market downturn, but will be one of the biggest beneficiaries of the rebound.
The international market is set to improve, meaning Schlumberger will profit on the shale drilling rush, but also on more drilling around the world.

Husky Energy Inc (TSX:HSE): This integrated oil and gas company out of Western Canada lives up to its name, fierce and driven for success. It’s already got a presence in some of the most well-known oil regions on the planet, but it hasn’t stopped there. It’s even positioned itself in Europe, Africa and as remote as the South China Sea.

Suncor Energy (TSX:SU): As one of the biggest names in energy, Suncor has adopted a number of high tech solutions for finding, pumping, storing, and delivering its resources.
While its primarily based out of North America, its assets in Africa and the Middle East should not be ignored. Though the oil downturn has weighed on the company’s share price this year, many analysts are pointing to a turnaround, from which Suncor is likely to benefit.

Tourmaline Oil Corp (TSX:TOU) is another Canadian resource producer focusing on exploration, production, development and acquisition within Western Canadian Sedimentary Basin. The company is in possession of an extensive undeveloped land position with long-term growth opportunities and a large multi-year drilling inventory.
Tourmaline’s strong leadership make the company a promising pick for investors looking to take advantage of the tremendous Canadian oil opportunities which are due for a strong rebound as oil prices inch higher.

Imperial Oil (TSX:IMO) still has some of the lowest cost producing oil sands in Canada and that is going to pay off as oil prices continue to rise and new tech breakthroughs bring breakeven prices even lower.
The management is well known for being conservative, but that certainly shouldn’t put investors off in a time when recovery is the buzzword of the day and consistency is sure to be rewarded.

Gibson Energy (TSX:GEI): has a long history in Canada’s oil and gas game. Established in 1953, Gibson knows the industry inside and out. The company has a diverse portfolio which includes transportation, storage, processing, marketing and distribution of oil, condensates, oilfield waste, refined products and natural gas.
With Gibson’s huge array of assets and its multi-platform sales strategies, investors look to Gibson with confidence.

Link to article: https://oilprice.com/Energy/Energy-General/Is-This-The-Next-Great-Oil-Frontier.html

By Meredith Taylor

**IMPORTANT! BY READING OUR CONTENT YOU EXPLICITLY AGREE TO THE FOLLOWING. PLEASE READ CAREFULLY**

Forward-Looking Statements. Statements contained in this document that are not historical facts are forward-looking statements that involve various risks and uncertainty affecting the business of Recon. Such statements can be generally, but not always, identified by words such as “expects”, “plans”, “anticipates”, “intends”, “estimates”, “forecasts”, “schedules”, “prepares”, “potential” and similar expressions, or that events or conditions “will”, “would”, “may”, “could” or “should” occur. All estimates and statements with respect to Recon’s operations, its plans and projections, oil prices, recoverable oil, production targets, production and other operating costs and likelihood of oil recoverability are forward-looking statements under applicable securities laws and necessarily involve risks and uncertainties including, without limitation: risks associated with oil and gas exploration, development, exploitation and production, geological risks, marketing and transportation, availability of adequate funding, volatility of commodity prices, imprecision of reserve and resource estimates, environmental risks, competition from other producers, government regulation, dates of commencement of production and changes in the regulatory and taxation environment. Actual results may vary materially from the information provided in this document, and there is no representation that the actual results realized in the future will be the same in whole or in part as those presented herein. Other factors that could cause actual results to differ from those contained in the forward-looking statements are also set forth in filings that Recon and its technical analysts have made, We undertake no obligation, except as otherwise required by law, to update these forward-looking statements except as required by law.

Exploration for hydrocarbons is a speculative venture necessarily involving substantial risk. Recon’s future success will depend on its ability to develop its current properties and on its ability to discover resources that are capable of commercial production. However, there is no assurance that Recon’s future exploration and development efforts will result in the discovery or development of commercial accumulations of oil and natural gas. In addition, even if hydrocarbons are discovered, the costs of extracting and delivering the hydrocarbons to market and variations in the market price may render uneconomic any discovered deposit. Geological conditions are variable and unpredictable. Even if production is commenced from a well, the quantity of hydrocarbons produced inevitably will decline over time, and production may be adversely affected or may have to be terminated altogether if Recon encounters unforeseen geological conditions. Adverse climatic conditions at such properties may also hinder Recon’s ability to carry on exploration or production activities continuously throughout any given year.

DISCLAIMERS

ADVERTISEMENT. This communication is not a recommendation to buy or sell securities. Oilprice.com, Advanced Media Solutions Ltd, and their owners, managers, employees, and assigns (collectively “the Company”) may in the future be paid by the profiled company to disseminate future communications if this communication proves effective. In this case the Company has not been paid for this article. But the potential for future compensation is a major conflict with our ability to be unbiased, more specifically:

This communication is for entertainment purposes only. Never invest purely based on our communication. We have not been compensated but may in the future be compensated to conduct investor awareness advertising and marketing for TSXV:RECO. Therefore, this communication should be viewed as a commercial advertisement only. We have not investigated the background of the company. Frequently companies profiled in our alerts experience a large increase in volume and share price during the course of investor awareness marketing, which often end as soon as the investor awareness marketing ceases. The information in our communications and on our website has not been independently verified and is not guaranteed to be correct.

SHARE OWNERSHIP. The owner of Oilprice.com owns shares of this featured company and therefore has an additional incentive to see the featured company’s stock perform well. The owner of Oilprice.com will not notify the market when it decides to buy more or sell shares of this issuer in the market. The owner of Oilprice.com will be buying and selling shares of this issuer for its own profit. This is why we stress that you conduct extensive due diligence as well as seek the advice of your financial advisor or a registered broker-dealer before investing in any securities.

NOT AN INVESTMENT ADVISOR. The Company is not registered or licensed by any governing body in any jurisdiction to give investing advice or provide investment recommendation.

ALWAYS DO YOUR OWN RESEARCH and consult with a licensed investment professional before making an investment. This communication should not be used as a basis for making any investment.

PAST PERFORMANCE IS NOT INDICATIVE OF FUTURE RESULTS. Investing is inherently risky. Don’t trade with money you can’t afford to lose. This is neither a solicitation nor an offer to Buy/Sell securities. No representation is being made that any account will or is likely to achieve profits similar to those discussed.


The Analytical Overview of the Main Currency Pairs on 2020.01.03

by JustForex

The EUR/USD currency pair

Technical indicators of the currency pair:
  • Prev Open: 1.12087
  • Open: 1.11714
  • % chg. over the last day: -0.37
  • Day’s range: 1.11640 – 1.11785
  • 52 wk range: 1.0879 – 1.1572

The EUR/USD currency pair has been declining. The trading instrument has set new local lows. At the moment, EUR/USD quotes are testing local support of 1.11650. Round level of 1.12000 is the nearest resistance. The current technical pattern signals a further correction of the EUR/USD currency pair. Sentiment in financial markets has improved amid prospects for a settlement of the trade conflict between Washington and Beijing. Donald Trump set January 15 as the date of signing the phase one trade deal with China. We expect important economic releases. We recommend opening positions from key levels.

The Economic News Feed for 03.01.2020:

  • – Labor market report in Germany at 10:55 (GMT+2:00);
  • – ISM manufacturing PMI in the US at 17:00 (GMT+2:00).
EUR/USD

The price has fixed below 100 MA, which signals the power of sellers.

The MACD histogram is in the negative zone, but above the signal line, which gives a weak signal to sell EUR/USD.

Stochastic Oscillator is in the neutral zone, the %K line is below the %D line, which indicates the bearish sentiment.

Trading recommendations
  • Support levels: 1.11650, 1.11400, 1.11100
  • Resistance levels: 1.12000, 1.12350

If the price fixes below 1.11650, further correction of the EUR/USD quotes is expected. The movement is tending to 1.11400-1.11200.

An alternative could be the growth of the EUR/USD currency pair to 1.12250-1.12500.

The GBP/USD currency pair

Technical indicators of the currency pair:
  • Prev Open: 1.32482
  • Open: 1.31367
  • % chg. over the last day: -0.81
  • Day’s range: 1.31054 – 1.31602
  • 52 wk range: 1.1959 – 1.3516

The bearish sentiment is prevailing on the GBP/USD currency pair. During yesterday’s and today’s trading sessions, the drop in quotes exceeded 130 points. The trading instrument has reached local lows. The British pound is currently consolidating in the range of 1.31000-1.31600. The GBP/USD currency pair has the potential for further decline. Market participants expect up-to-date information on Brexit. Positions should be opened from key levels.

At 11:30 (GMT+2:00), construction PMI will be published in the UK.

GBP/USD

Indicators do not give accurate signals: the price has crossed 100 MA.

The MACD histogram is in the negative zone and continues to decline, which indicates the bearish sentiment.

Stochastic Oscillator has reached the oversold zone, the %K line has crossed the %D line. There are no signals at the moment.

Trading recommendations
  • Support levels: 1.31000, 1.30550, 1.30000
  • Resistance levels: 1.31600, 1.32250

If the price fixes below the round level of 1.31000, further decline in GBP/USD quotes is expected. The movement is tending to 1.30600-1.30400.

An alternative could be the growth of the GBP/USD currency pair to 1.32000-1.32300.

The USD/CAD currency pair

Technical indicators of the currency pair:
  • Prev Open: 1.29858
  • Open: 1.29851
  • % chg. over the last day: -0.01
  • Day’s range: 1.29755 – 1.29993
  • 52 wk range: 1.2949 – 1.3566

The USD/CAD currency pair has become stable after a continuous fall. The trading instrument is currently consolidating. Unidirectional trend is not observed. The key range is 1.29600-1.30100. Demand for the Canadian dollar is still at a fairly high level amid positive dynamics of oil prices. We do not exclude a further decline in the USD/CAD currency pair. We recommend opening positions from key levels.

The news feed on the Canada’s economy is calm.

USD/CAD

Indicators do not give accurate signals: the price has crossed 50 MA.

The MACD histogram is near the 0 mark. There are no signals at the moment.

Stochastic Oscillator is near the overbought zone, the %K line has crossed the %D line. There are no accurate signals.

Trading recommendations
  • Support levels: 1.29600, 1.29200
  • Resistance levels: 1.30100, 1.30500, 1.30800

If the price fixes below the support level of 1.29600, a further drop in the USD/CAD quotes is expected. The movement is tending to 1.29300-1.29100.

An alternative could be the growth of the USD/CAD currency pair to 1.30400-1.30600.

The USD/JPY currency pair

Technical indicators of the currency pair:
  • Prev Open: 108.727
  • Open: 108.558
  • % chg. over the last day: -0.14
  • Day’s range: 108.005 – 108.630
  • 52 wk range: 104.45 – 113.53

There are aggressive sales on the USD/JPY currency pair. During yesterday’s and today’s trading session, the drop in quotes exceeded 60 points. At the moment, the trading instrument is testing a round level of 108.000. The 108.300 mark is already a “mirror” resistance. Demand for “safe haven” currencies is still high due to rising tensions in the Middle East. The USD/JPY quotes have the potential for further decline. Today, we recommend paying attention to economic reports from the US. Positions should be opened from key levels.

Japan’s financial markets are closed due to the holiday.

USD/JPY

Indicators signal the power of sellers: the price has fixed below 50 MA and 100 MA.

The MACD histogram is in the negative zone and below the signal line, which gives a strong signal to sell USD/JPY.

Stochastic Oscillator is in the neutral zone, the %K line is above the %D line, which indicates the bullish sentiment.

Trading recommendations
  • Support levels: 108.000, 107.600
  • Resistance levels: 108.300, 108.500, 108.850

If the price fixes below the round level of 108,000, a further drop in the USD/JPY quotes is expected. The movement is tending to 107.700-107.500.

An alternative could be the growth of the USD/JPY currency pair to 108.500-108.700.

by JustForex

US Currency Retreated From Local Lows

by JustForex

The US dollar retreated from local lows and started gaining strength against major currencies. The dollar index (#DX) closedin the green yesterday (+ 0.49%). Support for the US currency was provided by sudden clarity in the trade relations between the USA and China. Keep in mind that the US President D. Trump confirmed that the conclusion of the first stage of the negotiations will be held on January 15.

Mixed economic data from the US was also released yesterday. The number of initial jobless claims fell to 222K, while experts expected 225K. However, the manufacturing activity index (PMI) in the US fell in December to 52.4 instead of the forecasted value of 52.5.

Business activity indices for the manufacturing sectors of Germany and the UK were also published yesterday. The index of business activity in the manufacturing sector (PMI) in Germany amounted to 43.7 in December and was better than the predicted value of 43.4. The index of business activity in the manufacturing sector (PMI) in the UK amounted to 47.5 in December and turned out to be worse than the forecasted value of 47.6.

Prices for oil continue to rise due to tensions in the Middle East. At the moment, WTI crude oil futures are testing $62.95 per barrel. At 18:00 (GMT+2:00), a report on the crude oil inventories will be published.

Market Indicators

The US stock market is in a bullish mood: #SPY (+0,94%), #DIA (+1,23%), #QQQ (+1,67%).

Yields on 10-year US government bonds declined. At the moment, the indicator is at 1.83-1.84%.

The Economic News Feed for 03.01.2020:
  • – Change in the number of unemployed in Germany – 10:55 (GMT+2:00);
  • – Business activity index in the construction sector (PMI) of the UK – 11:30 (GMT+2:00);
  • – ISM’s business activity index in the manufacturing sector (PMI) of the USA – 17:00 (GMT+2:00).

by JustForex

ADL Gold Prediction Confirms Targets

By TheTechnicalTraders.com

The Gold rally we predicted to happen in late 2018 took place, almost perfectly, based on our ADL predictive modeling systems results.  This rally took place in May through September 2019 and pushed  Gold up to levels near $1600.  The rest of the year, Gold consolidated near $1500 as a strong US Stock Market rally took hold in Q4 of 2019.  Our original prediction was that Gold would rally to levels near $1750 before the end of 2019 based on our Adaptive Dynamic Learning predictive modeling system (ADL).  This did not happen in 2019 as out ADL modeling systems suggested, but it appears Gold is setting up for another massive upside rally in 2020.

Taking a look at our ADL predictive modeling systems on Monthly charts for Gold and Silver, we see two very interesting suggestions setting up :

_  First, Gold may attempt a rally to a level above $1700 before March/April 2020 and potentially extend this rally to well above $1850 by August/September 2020.

_  Second, Silver appears to lag behind this Gold rally by about 7 to 8 months.  Silver does not appear to want to start a rally will well after July or August 2020.

If we consider what happened in 2008/09 with the global credit market crisis, both Gold and Silver contracted lower near the start of this crisis (in late 2008).  Eventually, Gold began to move higher in August/September 2009 (well into the crisis event).  Silver didn’t really start to accelerate higher will August 2010 – a full 12 months after the Gold rally started.

Our ADL system is suggesting that the Silver rally will lag behind the gold rally by about 10 to 14 months given the ADL predictions for price activity in 2020.  Thus, Gold may continue to rally much higher fairly early in 2020, yet we won’t see much upside movement in Silver till after July 2020.

Monthly Gold ADL Chart

This first Monthly Gold ADL chart highlights the ADL predictive modeling systems suggestion related to future price targets.  We can see the upside move in Gold should begin with an upside target near $1600~1625 over the next 60+ days.  After that, the rally should accelerate higher in April/May 2020 with another move higher towards $1700~1725.  By August/September 2020, Gold should attempt a rally to levels above $1800~1850 and then begin to consolidate above $1800 for a few months.

Silver Monthly ADL Chart

This Silver Monthly ADL chart suggests that Metals will react very similar in 2020 to what happened in 2008-09.  While Gold began to rally in August 2009, Silver did not begin to accelerate higher till August/September 2010.  This delay in the understanding that Silver presents valid protection against risk may take place in this current upside rally in Gold.  If the ADL predictions are accurate, then Silver will continue to provide buying opportunities for many months near $17.50~$18 before a major upside price advance begin.

By July 2020, Our ADL predictive modeling system is suggesting Silver will advance to levels above $18.25, then begin a major price advance to levels above $19~20 fairly quickly.  Please keep in mind the scope of these predictions related to the global markets and the US Presidential elections.  We read into this that a lot of chaos/turmoil may be taking place in the US/World after June/July 2020.

Weekly Gold Chart

This last chart is a Weekly Gold chart highlighting our Fibonacci Price Amplitude Arcs and the major resistance level that has just been broken in Gold.  The heavy GREEN arc and the BLACKLINE that we’ve drawn on this chart represent massive resistance originating from the lows near August 2018 in Gold.  We believe this resistance level, once broken, will prompt a major upside price move in Gold to levels closer to or above $1700.  If this price advance in Gold aligns well with our ADL predictions, then we believe fear will continue to drive future a future price advance in Gold and that fear may be related to continued Global stock market concerns and the US elections.

2020 may be a very good year for precious metals traders who are able to identify solid entry trades for these moves.  If our ADL predictions are accurate, Gold should rally over 25% before the end of 2020.  Silver may rally as much as 15% before the end of 2020.  The timing of these moves suggests Gold traders will have opportunities for bigger price advanced early in 2020 and will begin a larger upside price move after February/March 2020.  Silver will begin an upside price move after basing near the March/April 2020.

2020 is going to be a fantastic year for skilled technical traders.  Join us and our valued members in finding great trades and incredible opportunities in the markets by joining TheTechnicalTraders.com.

Chris Vermeulen


8 out of 10 millennials now prioritize responsible investing – and they’re right

By George Prior

Almost eight out of 10 millennials now prioritize socially responsible and impactful investing, according to a new global survey.

Some 77% of millennials – people who were born in the time period ranging from the early 1980s to the mid-1990s and early 2000s – cite Environmental, Social and Governance (ESG) investing as their top priority when considering investment opportunities.

The global poll of 1,125 people was carried out by deVere Group, one of the world’s largest independent financial services and advisory organizations, across the UK, Western Europe, the Middle East, Africa, North America, Australia, India, ASEAN and East Asia.

deVere CEO and founder, Nigel Green, comments: “This survey underscores that whilst traditional factors – such as anticipated returns (10%), past performance (7%), risk tolerance (4%) and tactical allocation (2%) – are important factors in millennial respondents’ investment decision-making, they are no longer enough.

“Indeed, Environmental Social and Governance considerations now sit at the heart of that process.”

Let’s break down the ESG acronym to understand the matters that millennials deem deserving of their investment. ‘E’ is for ‘environment’ and includes issues such as climate change policies, carbon footprint, and use of renewable energies. ‘S’ is for ‘social’ and includes workers’ rights and protections. ‘G’ is for ‘governance’ and includes executive compensations, diversity of the board and corporate transparency.

Mr Green continues: “Millennials appear to be leading the charge in socially responsible and impactful investing. They are keen to look for investment solutions that are progressive and forward-looking.

“And they might be right to do so too.  Research has shown that investments that score well in terms of ESG credentials often out-perform the market and have lower volatility over the long-run.”

He goes on to say: “For this reason and, importantly, because the biggest-ever generational transfer of wealth – likely to be around $30trn – from baby boomers to millennials will take place in the next couple of years, ESG investing is set to grow exponentially in the 2020s.

“As responsible investing becomes increasingly mainstream, and millennials become the major beneficiaries of the transfer of wealth, we can also expect institutional investors, such as pension funds, amongst others, to pile into ESG over the next few years.”

The deVere CEO concludes: “Environmental, social and governance issues are now the top priority for millennials.

“They understand that it is perfectly possible – and increasingly necessary – to make a profit while positively and proactively protecting people and the planet.

“These principles will fundamentally reshape the retail and institutional investment landscape in the next decade.”

About:

deVere Group is one of the world’s largest independent advisors of specialist global financial solutions to international, local mass affluent, and high-net-worth clients.  It has a network of more than 70 offices across the world, over 80,000 clients and $12bn under advisement

Phase-One Trade Deal Between the US and China Will be Signed on January 15

by JustForex

The dollar index (#DX) ended this year with a decrease (-0.36%). However, today the US dollar is growing against a basket of major currencies. The news that the phase-one trade deal between the US and China will be signed at the White House on January 15 has supported the US currency. The deal will reduce some US tariffs on Chinese goods. China, in turn, will increase purchases of US agricultural, industrial, and energy products by about $200 billion over the next two years. After signing the phase-one trade deal, Trump will go to China for further negotiations.

Today, during the Asian trading session, weak economic data have been published in China. Thus, Chinese Caixin manufacturing PMI counted to 51.5 in December, while experts forecasted 51.8.

The “black gold” prices are rising. Currently, futures for the WTI crude oil are testing the $61.25 mark per barrel.

Market Indicators

Yesterday, the US stock market was closed due to the New Year celebration.

The 10-year US government bonds yield has risen slightly. At the moment, the indicator is at the level of 1.93-1.94%.

The Economic News Feed for 02.01.2020:
  • – German manufacturing PMI at 10:55 (GMT+2:00);
  • – Manufacturing PMI in the UK at 11:30 (GMT+2:00);
  • – Initial jobless claims in the US at 15:30 (GMT+2:00);
  • – ISM manufacturing PMI at 16:45 (GMT+2:00);
  • – FOMC meeting minutes at 21:00 (GMT+2:00).

by JustForex


What To Expect In Early 2020

By TheTechnicalTraders.com – The US stock market has recently rallied throughout most of the last year after the very deep downside price rotation in late 2018.  Our researchers believe there is a very high likelihood of this trend continuing in early 2020, yet we would need to see confirmation across various broader indicators before we could determine the strength of this upside price trend.

We warned that a downside price rotation may happen near the end of 2019 – which never really materialized.  The August 2019 downside price rotation looked like it may turn into a deeper downside price move, but the news cycle ended that move as the US Fed decreased rates again and the news of a pending US/China trade deal continued to be pushed into the news cycle.  Here we are 3+ months later and we really have no US/China trade deal signed yet.

It is hard to argue with the Christmas Rally thinking that investors simply piled into the US stock market near the end of this year expecting prices to continue to rally.  Obviously, this happened in 2019 even though our underlying data charts suggest this move was relatively weak.  Let’s get into the charts/data to explore why we believe volatility and rotation may be heightened in early 2020.

This first chart is a Weekly SPY chart showing one of our proprietary price modeling tools.  We can see the longer-term trend is still bullish and that the current upside price rally is nearing the midpoint of the two Fibonacci price expansion levels.  Price has been rallying solidly for the past 7+ months with only two minor price retracements in 2019.  Will this continue in early 2020?

Our Custom Smart Cash Index chart highlights the upside breakout in October/November was validated by the upside price move in our Smart Cash index recently.  The current price bars on our Smart Cash Index chart are much weaker overall and suggest the continued price advance over the past 2+ weeks maybe a tailwind trend and not supported by true price factors.

Our Custom Valuation Index Chart continues to show the US stock market is setting up in a Pennant/Flag formation from September 2019.  This type of price pattern suggests that price has yet to really breakout of this consolidation pattern into a real trend.  This one chart concerns us quite a bit because we believe early 2020 may result in a downside price rotation near the apex of this Flag formation prompting a massive spike in price volatility.

Ultimately, as you can see throughout most of 2019 when this Custom Valuation Index rallies, the US Stock Market prices rally as well.  This is because the true valuation levels of stocks are increasing as investors expect increased earnings, profits and share prices.  When this Custom Index consolidates or moves lower, it is a measure of investor sentiment related to future earnings/profit/valuation potential.  Right now, it appears global traders have very little confidence in the future capabilities of increased valuations for the US Stock Market.

If this chart were to immediately begin a new rally, then our research team would suggest investors are turning more confident in future earnings/profit capabilities.  If this chart were to collapse, then our research team would suggest the bottom is falling out of the current market price valuation levels – be cautious.

Lastly, our Custom Volatility Index chart suggests the end of year rally has stalled near the 20 level – which is typically an area where price tops or price rotation sets up.  As you can see from our highlighted MAGENTA arcs on this chart, when this Custom Volatility Index rallies up toward these upper levels, price tends to stall before a moderate downside price rotation begins.

Sometimes, this setup prompts a major downside price move – such as the Jan/Feb 2018 price collapse and the Oct/Nov 2018 price collapse.  Right now, this chart is suggesting that the end of year rally is weakening and could setup into another deeper downside price rotation.

What does this mean for early 2020?  If the Smart Cash Index and the Valuation Index rally in early 2020, then we believe investors are turning decidedly bullish related to future earnings, profits and future valuation levels of the US stock market.  If, as we expect, 2020 starts off with a moderate downside price rotation where the Smart Cash Index and the Valuation Index fall near the Apex of the Flag formation, then we could start 2020 with a decidedly weaker price move (possibly similar to what happened in January 2018).

The Custom Volatility Index will, most likely, attempt to fall to levels below 12~14 fairly early in 2020 which would accomplish two critical price components.  First, it would establish a new price support level after the rally we’ve just experienced throughout the end of 2019.  Second, it would complete a price rotation event that may allow for a new price trend to establish in early 2020.  Both of these outcomes could prompt a potentially large spike in price volatility (VIX) as well as deliver a wake-up call for traders in early 2020.

Be prepared for a surprising spike in volatility in early 2020 with a moderately strong potential for an early 2020 downside price rotation which prompts a new price trend and possibly an early test of support (near 280 on the SPY chart).  2020 is going to be a fantastic year for skilled traders – get ready for some incredible price action.

I urge you visit my Wealth Building Newsletter and if you like what I offer, join me with the 1 or 2-year subscription to lock in the lowest rate possible and ride my coattails as I navigate these financial markets and build wealth while others lose nearly everything they own.

As a technical analysis and trader since 1997 I have been through a few bull/bear market cycles, I have a good pulse on the market and timing key turning points for both short-term swing trading and long-term investment capital. The opportunities are massive/life-changing if handled properly.

Chris Vermeulen TheTechnicalTraders.com


Ichimoku Cloud Analysis 31.12.2019 (AUDUSD, NZDUSD, USDCAD)

Article By RoboForex.com

AUDUSD, “Australian Dollar vs US Dollar”

AUDUSD is trading at 0.7003; the instrument is moving above Ichimoku Cloud, thus indicating an ascending tendency. The markets could indicate that the price may test the cloud’s upside border at 0.6990 and then resume moving upwards to reach 0.7055. Another signal to confirm further ascending movement is the price’s rebounding from the rising channel’s downside border. However, the scenario that implies further growth may be canceled if the price breaks the cloud’s downside border and fixes below 0.6940. In this case, the pair may continue falling towards 0.6870.

AUDUSD
Risk Warning: the result of previous trading operations do not guarantee the same results in the future

NZDUSD, “New Zealand Dollar vs US Dollar”

NZDUSD is trading at 0.6729; the instrument is moving above Ichimoku Cloud, thus indicating an ascending tendency. The markets could indicate that the price may test the cloud’s upside border at 0.6705 and then resume moving upwards to reach 0.6785. Another signal to confirm further ascending movement is the price’s rebounding from the support level. However, the scenario that implies further growth may be canceled if the price breaks the cloud’s downside border and fixes below 0.6655. In this case, the pair may continue falling towards 0.6580.

NZDUSD
Risk Warning: the result of previous trading operations do not guarantee the same results in the future

USDCAD, “US Dollar vs Canadian Dollar”

USDCAD is trading at 1.3049; the instrument is moving below Ichimoku Cloud, thus indicating a descending tendency. The markets could indicate that the price may test the cloud’s downside border at 1.3070 and then resume moving downwards to reach 1.2975. Another signal to confirm further descending movement is the price’s rebounding from the descending channel’s upside border. However, the scenario that implies further decline may be canceled if the price breaks the cloud’s upside border and fixes above 1.3110. In this case, the pair may continue growing towards 1.3190.

USDCAD

Article By RoboForex.com

Attention!
Forecasts presented in this section only reflect the author’s private opinion and should not be considered as guidance for trading. RoboForex LP bears no responsibility for trading results based on trading recommendations described in these analytical reviews.

Japanese Candlesticks Analysis 31.12.2019 (EURUSD, USDJPY)

Article By RoboForex.com

EURUSD, “Euro vs. US Dollar”

As we can see in the H4 chart, the ascending channel continues. By now, EURUSD has formed several reversal candlestick patterns, including Hanging Man, close to the channel’s upside border. We may assume that later the price may reverse and get back to 1.1136 to continue the ascending tendency. However, one shouldn’t exclude a possibility that the price may continue growing towards 1.1257.

EURUSD
Risk Warning: the result of previous trading operations do not guarantee the same results in the future

USDJPY, “US Dollar vs. Japanese Yen”

As we can see in the H4 chart, the pair is trading near the rising channel’s downside border and has already formed Hammer pattern. The current situation implies that the price may reverse and then resume growing towards 109.60 to continue the ascending tendency. At the same time, the pair may choose another scenario and start a new decline to reach 108.50.

USDJPY

Article By RoboForex.com

Attention!
Forecasts presented in this section only reflect the author’s private opinion and should not be considered as guidance for trading. RoboForex LP bears no responsibility for trading results based on trading recommendations described in these analytical reviews.

EURUSD: new high likely before any deep correction

By Alpari.com

On Monday the 30th of December, the euro was 23 points up at the end of trading (+0.20%). The US dollar has remained under pressure throughout the holiday season. The euro rose to 1.1211 in Asian trading and resumed its growth up to 1.1221 in the US session.

Day’s events (GMT+3):

  • 17:00 USA: S&P/Case-Shiller Home Price Indices (YoY) (Oct).
  • 17:45 USA: Housing Price Index (MoM) (Oct).
  • 18:00 USA: Consumer Confidence.

Рис. 1Current situation:

After hitting a new high, the price consolidated within a narrow range for 14 hours. The market remains optimistic about the US-China trade deal. According to reports, Liu He, China’s Vice Premier, will visit Washington over the weekend to sign an agreement. Market activity has calmed down around news concerning the trade deal, so after the New Year, market players will shift their focus to Brexit.

On Tuesday, the news calendar offers up two housing price indices and the consumer confidence indicator out of the US. Many traders and investors left their positions before Christmas. We believe that reactions to the publication of these statistics should not be expected.

According to the forecast, we expect multidirectional dynamics from the euro: a decline to 1.1190 with a subsequent increase to 1.1223. The pair is technically ready for correction, but since the market is thin, it is more profitable to consider the continuation of upwards movement rather than a decline in value.

By Alpari.com