Author Archive for InvestMacro – Page 118

Metals & Miners Prepare For An Early 2020 Liftoff

By TheTechnicalTraders.comOver the moderately quiet 2019 Christmas holiday season, while the US and global stock markets continue to push higher, precious metals and miners have begun to move dramatically higher as fear settles into the markets.  Our researchers believe this upside move in metals and miners represents a measured increase in investor concern related to early 2020 and the global economy.

Our research team believes the current rally in the US stock market is an enthusiastic upside price move that does not have true fundamental support.  We’ve authored a number of articles and research posts that highlight our belief and we suggest this upside move in Gold and miners is a sign of underlying fear that is growing in the global markets.

JUNE 24, 2019: NEXT BULL AND BEAR MARKETS ARE NOW SET UP

December 16, 2019: CURRENT EQUITIES RALLY SIMILARITIES TO 1999

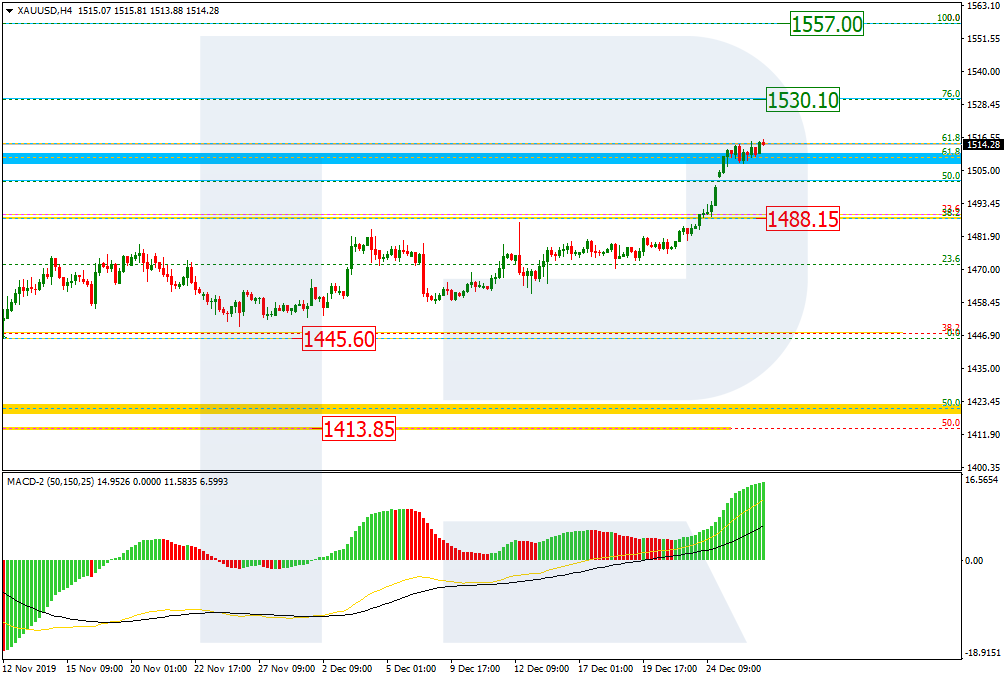
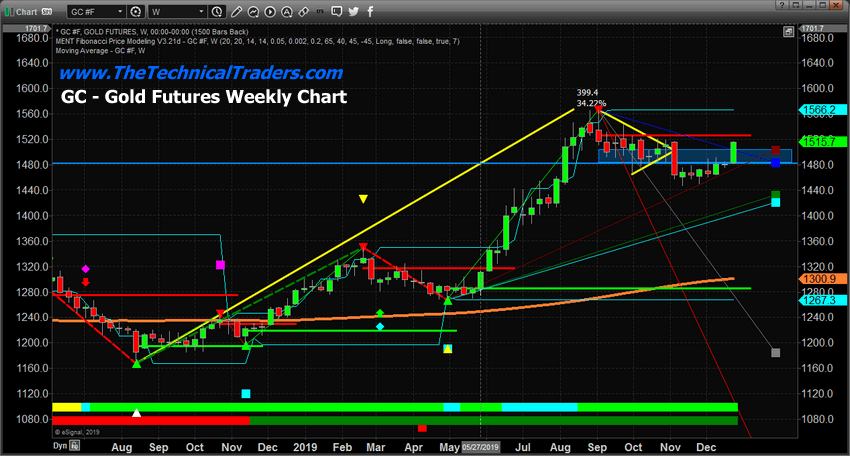
This Weekly Gold chart highlights our proprietary Fibonacci Price Amplitude Arcs and the recent downside price move in Gold along the Red Fibonacci Price Arc.  This level of resistance was recently broken in early December and the current upside price rally in Gold has already rallied up to the heavy Green Price Arc.  This current Green Price Arc should act as a major resistance level in an uptrend.  Once this level is broken, it is very likely that Gold will continue to accelerate higher – well beyond the $1600 price level.

Should Gold rally above $1600, possibly targeting $1750 or higher, in early 2020, a shock-wave would sound across the globe that Metals are signaling absolute fear in the markets.  If our expectations are correct, $1750 will be one of the first basing areas for Gold before a move to levels well above $2000.

This JNUG Weekly chart highlights our Adaptive Fibonacci Price Modeling system and clearly shows the upside potential/targets base on Weekly price rotation.  The bottom setup near $52.40 in early November sets up a price range from the peak in early August to the bottom in early November.  This range suggests an upside price rally may take place in JNUG that targets $124.50, $155.65, and $176.00.  These levels are based on the adaptive Fibonacci price theory applied to the expanding price rotations over the past 2+ years.

As you can see from this chart, the recent rallies on this chart are bigger and include more price volatility than previous moves.  This range expansion suggests upside price targets based on Fibonacci theory will be 1x or 2x traditional 100% measured moves.

This GDXJ Weekly chart provides a less volatile option for skilled traders to trade this upside price move in Metals and miners.  It is very clear to see the upside resistance on this chart near $43.10 and the fact that the current upside price rally bar is targeting that level.  Once this level is broken, we believe upside target levels near $46.50, 51.24, and $60.80 are likely.  Each of these upside price targets represents a moderately strong upside potential in Gold and is contingent on a strong rally taking place breaking the initial Green Fibonacci Price Amplitude Arc as we suggested near the top of this article.

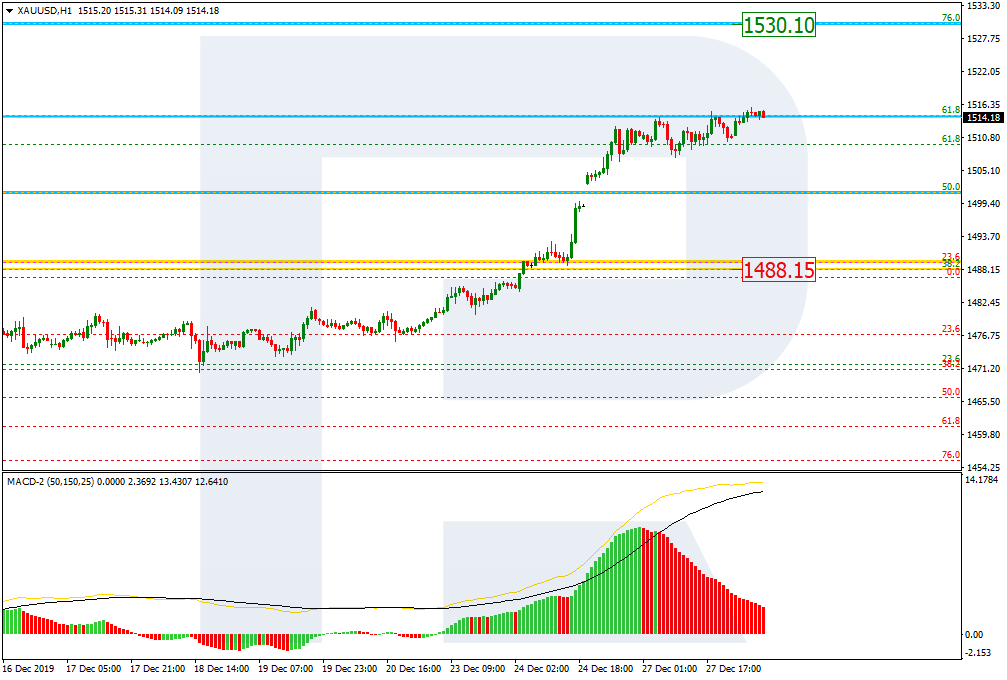
This last Weekly chart of Gold highlights the Weekly Fibonacci Price Modeling system and the core support near $1480 to $1510 (the Blue Box/Line).  This level of support is identified by the BLUE Fibonacci Price Modeling System retracement target (Square).  We believe the breakdown in price after the Pennant/Flag formation in late October was investor/news-driven as the US Fed announced lower interest rates and the new cycle continued to push “US/China Trade Deals Soon” topics.  This was a way to settle investor’s nerves and distract them from the underlying market dynamics.

Now, 2+ months later and about to start into 2020, we believe investors are starting to get ahead of the true market valuation levels and understand that precious metals are truly undervalued given the amount of risk in the markets currently.

We authored a powerful article about precious metals cycles and how they can drive incredible investment opportunity in early December.  You can find our link to that research post below.

December 7, 2019:  7 YEAR CYCLES CAN BE POWERFUL AND GOLD JUST STARTED ONE

We believe this upside move in metals and miners is just getting started.  We believe a move to levels just below $1650~1700 will be complete the initial upside price leg, then a second upside price leg will push prices upward towards $1800.

You really don’t want to miss this big setup/move.  Please pay attention to the opportunities that are set up for skilled traders.

As a technical analysis and trader since 1997 I have been through a few bull/bear market cycles, I have a good pulse on the market and timing key turning points for both short-term swing trading and long-term investment capital. The opportunities are massive/life-changing if handled properly.

I urge you visit my Wealth Building Newsletter and if you like what I offer, join me with the 1 or 2-year subscription to lock in the lowest rate possible and ride my coattails as I navigate these financial markets and build wealth while others lose nearly everything they own.

Chris Vermeulen – TheTechnicalTraders.com


Forex Technical Analysis & Forecast 30.12.2019 (EURUSD, GBPUSD, USDCHF, USDJPY, AUDUSD, USDRUB, USDCAD, GOLD, BRENT, BTCUSD)

Article By RoboForex.com

EURUSD, “Euro vs US Dollar”

After completing the ascending wave at 1.1133 and forming an upside continuation pattern around 1.1140, EURUSD has broken 1.1150 to reach 1.1210. After that, the instrument may start a new correction towards 1.1188 (at least) and then form one more ascending structure with the target at 1.1213.

EURUSD
Risk Warning: the result of previous trading operations do not guarantee the same results in the future

GBPUSD, “Great Britain Pound vs US Dollar”

GBPUSD has broken 1.3048 upwards. Possibly, today the pair may reach 1.3130 and then start a new correction to return to 1.3048. Later, the market may resume trading upwards with the target at 1.3190.

GBPUSD
Risk Warning: the result of previous trading operations do not guarantee the same results in the future

USDCHF, “US Dollar vs Swiss Franc”

After finishing the descending wave at 0.9770 and forming a downside continuation pattern around it, USDCHF has broken 0.9750. Possibly, the pair may continue falling towards 0.9708. Today, the price may reach this level and then form one more ascending structure to return to 0.9770. After that, the instrument may resume trading downwards with the target at 0.9700.

USDCHF
Risk Warning: the result of previous trading operations do not guarantee the same results in the future

USDJPY, “US Dollar vs Japanese Yen”

USDJPY has reached 109.14 to complete the correction. Possibly, today the pair may consolidate near the current lows. According to the main scenario, the price is expected to resume moving upwards with the target at 109.41.

USDJPY
Risk Warning: the result of previous trading operations do not guarantee the same results in the future

AUDUSD, “Australian Dollar vs US Dollar”

AUDUSD is still moving upwards; it has formed another consolidation range around 0.6984. Possibly, the pair may expand the range towards 0.7007 and then start a new decline with the target at 0.6914.

AUDUSD
Risk Warning: the result of previous trading operations do not guarantee the same results in the future

USDRUB, “US Dollar vs Russian Ruble”

USDRUB is consolidating above 62.00. the main scenario implies that the price may fall towards 61.40 and then start another correction to reach 64.00. Later, the market may resume trading inside the downtrend with the short-term target at 59.40.

USDRUB
Risk Warning: the result of previous trading operations do not guarantee the same results in the future

USDCAD, “US Dollar vs Canadian Dollar”

USDCAD has reached the short-term downside target at 1.3070. Today, the pair may start a new correction towards 1.3118 and then resume trading downwards with the target at 1.3055.

USDCAD
Risk Warning: the result of previous trading operations do not guarantee the same results in the future

XAUUSD, “Gold vs US Dollar”

Gold is consolidating around 1512.50. Possibly, today the pair may expand the range up to 1519.25 and then start a new correction towards 1489.00 (at least).

GOLD
Risk Warning: the result of previous trading operations do not guarantee the same results in the future

BRENT

Brent is still moving upwards. Possibly, today the pair may reach 68.20 and then start another correction towards 67.10. After that, the market may resume trading upwards with the short-term target at 68.62.

BRENT
Risk Warning: the result of previous trading operations do not guarantee the same results in the future

BTCUSD, “Bitcoin vs US Dollar”

BTCUSD has reached 7490.00. Today, the pair may start a new correction towards 7245.00. Later, the market may resume trading inside the uptrend with the short-term target at 7900.00.

BTCUSD

Article By RoboForex.com

Attention!
Forecasts presented in this section only reflect the author’s private opinion and should not be considered as guidance for trading. RoboForex LP bears no responsibility for trading results based on trading recommendations described in these analytical reviews.

Fibonacci Retracements Analysis 30.12.2019 (GOLD, USDCHF)

Article By RoboForex.com

XAUUSD, “Gold vs US Dollar”

As we can see in the H4 chart, after breaking 38.2% fibo, XAUUSD transformed the correctional uptrend into a proper rising wave with the target at 1557.00. By now, the pair has already reached 61.8% fibo and may later continue moving towards 76.0% fibo at 1530.10. The support is 38.2% fibo at 1488.16.

GOLD_H4
Risk Warning: the result of previous trading operations do not guarantee the same results in the future

In the H1 chart, after reaching 61.8% fibo, the pair is testing it. In this case, the price is expected to start a new pullback towards 38.2% fibo at 1488.15.

GOLD_H1
Risk Warning: the result of previous trading operations do not guarantee the same results in the future

USDCHF, “US Dollar vs Swiss Franc”

In the H4 chart, after completing the short-term correction and starting a new descending wave, USDCHF has broken 76.0% fibo; right now, it is moving towards the fractal low at 0.9660. at the same time, there is a convergence on MACD, which may indicate a new pullback after the pair reaches the low. The closest correctional target is 50.0% fibo at 0.9844.

USDCHF_H4
Risk Warning: the result of previous trading operations do not guarantee the same results in the future

As we can see in the H1 chart, the instrument has broken 76.0% fibo. The next downside target is the low at 0.9660.

USDCHF_H1

Article By RoboForex.com

Attention!
Forecasts presented in this section only reflect the author’s private opinion and should not be considered as guidance for trading. RoboForex LP bears no responsibility for trading results based on trading recommendations described in these analytical reviews.

Forex Technical Analysis & Forecast 27.12.2019 (EURUSD, GBPUSD, USDCHF, USDJPY, AUDUSD, USDRUB, USDCAD, GOLD, BRENT, BTCUSD)

Article By RoboForex.com

EURUSD, “Euro vs US Dollar”

EURUSD has formed an upside continuation pattern around 1.1100; right now, it is growing to reach 1.1121. After that, the instrument may start a new correction towards 1.1109 and then form one more ascending structure with the short-term target at 1.1133.

EURUSD
Risk Warning: the result of previous trading operations do not guarantee the same results in the future

GBPUSD, “Great Britain Pound vs US Dollar”

GBPUSD has formed the consolidation range around 1.2985; right now, it is moving upwards. Possibly, the pair may reach 1.3050 and then start a new correction towards 1.3017. Later, the market may resume trading upwards with the target at 1.3067.

GBPUSD
Risk Warning: the result of previous trading operations do not guarantee the same results in the future

USDCHF, “US Dollar vs Swiss Franc”

USDCHF has formed the consolidation range around 0.9807; right now, it is moving downwards. Possibly, the pair may break 0.9797 and then continue falling towards 0.9783.

USDCHF
Risk Warning: the result of previous trading operations do not guarantee the same results in the future

USDJPY, “US Dollar vs Japanese Yen”

USDJPY has reached 109.60; right now, it is falling. Possibly, today the pair may break 109.45 to the downside and then continue moving downwards with the target at 109.14.

USDJPY
Risk Warning: the result of previous trading operations do not guarantee the same results in the future

AUDUSD, “Australian Dollar vs US Dollar”

AUDUSD is still moving upwards. Possibly, the pair may reach 0.6957 and then start a new correction towards 0.6930. Later, the market may form one more ascending structure with the target at 0.6979.

AUDUSD
Risk Warning: the result of previous trading operations do not guarantee the same results in the future

USDRUB, “US Dollar vs Russian Ruble”

USDRUB has returned to 62.25; right now, it is consolidating below it. Today, the pair may break the range to the downside and reach 62.00. Later, the market may start another growth towards 62.38 and then resume trading inside the downtrend with the target at 61.47.

USDRUB
Risk Warning: the result of previous trading operations do not guarantee the same results in the future

USDCAD, “US Dollar vs Canadian Dollar”

USDCAD has broken 1.3131 downwards; right now, it is still falling to reach 1.3072. Later, the market may start a new correction towards 1.3118 and then resume trading downwards with the target at 1.3050.

USDCAD
Risk Warning: the result of previous trading operations do not guarantee the same results in the future

XAUUSD, “Gold vs US Dollar”

Gold has been able to fix above 1507.70; right now, it is still trading upwards to reach 1515.70. After that, the instrument may start a new correction to return to 1507.70 and then extend this ascending wave towards 1518.45.

GOLD
Risk Warning: the result of previous trading operations do not guarantee the same results in the future

BRENT

After reaching 67.28 and forming an upside continuation pattern, Brent is still moving upwards. Possibly, today the pair may reach 67.77 and then start a new correction towards 67.28. After that, the market may resume trading upwards with the target at 68.04.

BRENT
Risk Warning: the result of previous trading operations do not guarantee the same results in the future

BTCUSD, “Bitcoin vs US Dollar”

BTCUSD has rebounded from 7350.00 downwards; right now, it is still falling to reach 7000.00. Later, the market may resume trading inside the uptrend to return to 7350.00.

BITCOIN

Article By RoboForex.com

Attention!
Forecasts presented in this section only reflect the author’s private opinion and should not be considered as guidance for trading. RoboForex LP bears no responsibility for trading results based on trading recommendations described in these analytical reviews.

Fibonacci Retracements Analysis 27.12.2019 (BITCOIN, ETHEREUM)

Article By RoboForex.com

BTCUSD, “Bitcoin vs US Dollar”

As we can see in the H4 chart, the convergence made the pair reverse and start a new rising correction, which has already reached 23.6% fibo and may yet continue towards 38.2% and 50.05% fibo at 7995.00 and 8480.00 respectively. However, if the price breaks the local low at 6430.30, BTCUSD may continue falling to reach mid-term 76.0% fibo at 5700.00. The key mid-term downside target is still the low at 3121.90.

BTCUSD_H4
Risk Warning: the result of previous trading operations do not guarantee the same results in the future

In the H1 chart, the pair is correcting after the divergence on MACD. The price has already reached 38.2% fibo; right now, it is trading close to this level. The next descending impulse may fall to reach 50.0% and 61.8% fibo at 7059.00 and 6910.00 respectively. The resistance is the high at 7687.30.

BTCUSD_H1
Risk Warning: the result of previous trading operations do not guarantee the same results in the future

ETHUSD, “Ethereum vs. US Dollar”

As we can see in the daily chart, the downtrend continues to reach a psychologically-crucial level of 100.00. At the same time, there is a convergence on MACD, which may indicate a new pullback towards the resistance (61.8% fibo at 189.00).

ETHUSD_D1
Risk Warning: the result of previous trading operations do not guarantee the same results in the future

The H4 chart shows a short-term growth towards 23.6% fibo at 135.68 after the convergence. In case it breaks this level, the current rising movement may continue to reach 38.2% and 50.0% fibo at 147.70 and 157.57 respectively. However, if the pair breaks the low, it may test the support at 100.00.

ETHEREUM_H4

Article By RoboForex.com

Attention!
Forecasts presented in this section only reflect the author’s private opinion and should not be considered as guidance for trading. RoboForex LP bears no responsibility for trading results based on trading recommendations described in these analytical reviews.

The Analytical Overview of the Main Currency Pairs on 2019.12.27

by JustForex

The EUR/USD currency pair

Technical indicators of the currency pair:
  • Prev Open: 1.10908
  • Open: 1.10961
  • % chg. over the last day: +0.09
  • Day’s range: 1.10942 – 1.11222
  • 52 wk range: 1.0879 – 1.1572

Yesterday, the USD weakened against the basket of world currencies. This movement is largely due to technical factors. EUR / USD quotes updated local highs. At the moment, the trading instrument is testing the resistance level of 1.11200. 1.10950 is already a mirror support. The EUR has a potential for further recovery. We recommend opening positions from key levels.

The Economic News Feed for 27.12.2019 is calm.

EUR/USD

The price has fixed above 100 MA, which signals the strength of buyers.

The MACD histogram is in the positive zone and continues to rise, indicating a bullish sentiment.

The Stochastic Oscillator is in the overbought zone, the %K line crossed the %D line. There are no signals at the moment.

Trading recommendations
  • Support levels: 1.10950, 1.10750, 1.10650
  • Resistance levels: 1.11200, 1.11400, 1.11550

If the price consolidates above 1.11200, expect further growth toward 1.11400-1.11600.

Alternatively, the quotes could descend toward 1.10750-1.10600.

The GBP/USD currency pair

Technical indicators of the currency pair:
  • Prev Open: 1.29523
  • Open: 1.29909
  • % chg. over the last day: +0.31
  • Day’s range: 1.29682 – 1.30143
  • 52 wk range: 1.1959 – 1.3516

An ambiguous technical pattern has developed on the GBP/USD currency pair. The trading instrument is consolidating. The local support and resistance levels are 1.29500 and 1.30150, respectively. In the near future, correction of the GPB/USD quotes after a prolonged fall is not ruled out. Market participants expect up-to-date information on Brexit. Open positions from key levels.

The publication of important economic reports from the UK is not planned.

GBP/USD

Indicators do not give accurate signals: the price crossed 50 MA and 100 MA.

The MACD histogram is close to the 0.

The Stochastic Oscillator is close to the overbought zone, the %K line crossed the %D line. There are no signals at the moment.

Trading recommendations
  • Support levels: 1.29500, 1.29000, 1.28500
  • Resistance levels: 1.30150, 1.30650, 1.31350

If the price consolidates above 1.30150, expect the quotes to recover toward 1.30650-1.31000.

Alternatively, the quotes could descend toward 1.29200-1.28800.

The USD/CAD currency pair

Technical indicators of the currency pair:
  • Prev Open: 1.31567
  • Open: 1.31122
  • % chg. over the last day: -0.40
  • Day’s range: 1.31021 – 1.31205
  • 52 wk range: 1.3014 – 1.3664

The USD/CAD currency pair went down. During yesterday’s and today’s trading, the drop in quotations exceeded 50 points. The trading instrument reached a round level of 1.31000. 1.31200 acts as local resistance. Demand for the Canadian dollar is supported by the positive dynamics of oil prices. We do not exclude the further strengthening of CAD. We recommend opening positions from key levels.

The Economic News Feed for 27.12.2019 is calm.

USD/CAD

Indicators signal the power of sellers: the price has fixed below 50 MA and 100 MA.

The MACD histogram is in the negative zone, but above the signal line, which gives a weak signal to sell USD/CAD.

The Stochastic Oscillator is in the oversold zone, the %K line crossed the %D line. There are no signals at the moment.

Trading recommendations
  • Support levels: 1.31000, 1.30700
  • Resistance levels: 1.31200, 1.31400, 1.31600

If the price consolidates below the round level of 1.31000, expect the quotes to fall toward 1.30700-1.30500.

Alternatively, the quotes could grow toward 1.31400-1.31600.

The USD/JPY currency pair

Technical indicators of the currency pair:
  • Prev Open: 109.358
  • Open: 109.546
  • % chg. over the last day: +0.16
  • Day’s range: 109.432 – 109.584
  • 52 wk range: 104.45 – 113.53

The USD/JPY currency pair is in lateral movement. The technical picture is ambiguous. Participants in financial markets expect additional drivers. At the moment, the following local support and resistance levels can be distinguished: 109.400 and 109.550, respectively. We recommend that you pay attention to the dynamics of yield on US government bonds. Open positions from key levels.

Series of mixed economic reports from Japan were published during the Asian trading session.

USD/JPY

Indicators do not give accurate signals: the price crossed 50 MA and 100 MA.

The MACD histogram is close to the 0 mark.

The Stochastic Oscillator is in the neutral zone, the %K line is above the %D line, which indicates a bullish sentiment.

Trading recommendations
  • Support levels: 109.400, 109.300, 109.200
  • Resistance levels: 109.550, 109.650, 109.900

If the price consolidates above 109.550, expect the quotes to grow toward 109.700-109.900.

Alternatively, the quotes could drop toward 109.300-109.200.

by JustForex

The Dollar Index Has Been Declining

by JustForex

Greenback is losing ground relative to a basket of world currencies. Yesterday, the dollar index (#DX) moved away from local highs and closed in the red zone (-0.14%). Investors began to partially fix positions in the US dollar. Demand for risky assets resumed amid prospects for a settlement of the trade conflict between Washington and Beijing. The US currency has the potential to further decline relative to its main competitors.

It should be recalled that earlier the United States and China agreed to conclude the phase one trade agreement, which can be signed in early January. On Thursday, US President Donald Trump announced that a signing ceremony would be held soon and that the deal was being completed. These reports strengthened the demand for a group of commodity currencies. We also recommend following current information on the Brexit issue.

There is the bullish sentiment in the “black gold” market. Oil quotes reached three-month highs. At the moment, futures for the WTI crude oil are testing the $61.90 mark per barrel.

Market Indicators

Major US stock indices have set new historical highs.

The 10-year US yield government bonds continue to decline. At the moment, the indicator is at the level of 1.88-1.89%.

The Economic News Feed for 27.12.2019:
  • Today, the publication of important economic releases is not planned.

by JustForex

Euro strengthens in thin market

By Alpari.com

On Thursday the 26th of December, the euro 11 points up (1.1096) at the close of trading. There was no news to explain the recovery in price. Rising global stock indices and the general weakening of the dollar after Christmas helped to strengthen risky assets. These include the euro. Stock indices set new historic highs amid optimism in US-Chinese relations. Trump says the trade agreement is being translated into Chinese and will be concluded in early January 2020.

Day’s events (GMT+3):

  • 12:00 Eurozone: Economic Bulletin.
  • 19:00 USA: EIA Crude Oil Stocks Change (Dec 20).
  • 21:00 USA: Baker Hughes US Oil Rig Count.

Рис. 1Current situation:

In Asian trading, the euro was up by 22 points (1.1122). The market will remain thin until the New Year. Yesterday, we wrote that we are more inclined see a strengthening in the euro until the end of December. According to seasonal cycles, statistics show that in the last week of December, the euro has strengthened 16 times (80%) out of 20 since 1999.

The Forex market remains in a festive mood after Christmas, bulls broke through the trend line. The price went up within the upwards channel. Stopped at 45 degrees from the low of 1.1069. In theory, the price should jump back up to the 67th degree – 1.1145.

Рис. 1We are concerned about several points, because of these points we do not like to trade in a thin market:

  • Decline in growth;
  • The euro index ran into resistance near the trend line, which passes through 102.11. We need a news item to provide the reason for a breakthrough before the weekend. The news calendar is empty, so you do not know what will act as a trigger for the offensive;
  • Stochastic is already in the sales area;
  • A third peak was formed at AO.

If the euro index breaks resistance, the growth of EURUSD pair will accelerate. By the end of the year, we predict strengthening of the euro.

By Alpari.com

Forex Technical Analysis & Forecast 26.12.2019 (EURUSD, GBPUSD, USDCHF, USDJPY, AUDUSD, USDRUB, USDCAD, GOLD, BRENT, BTCUSD)

Article By RoboForex.com

EURUSD, “Euro vs US Dollar”

EURUSD continues growing; right now, it is forming the second ascending impulse with the short-term target at 1.1100. After that, the instrument may form an upside continuation pattern and break this level upwards. The key target of the second impulse is at 1.1133.

EURUSD
Risk Warning: the result of previous trading operations do not guarantee the same results in the future

GBPUSD, “Great Britain Pound vs US Dollar”

GBPUSD has broken 1.2957 upwards. Possibly, the pair may start a new correction towards 1.3010 and then resume trading downwards to return to 1.2957.

GBPUSD
Risk Warning: the result of previous trading operations do not guarantee the same results in the future

USDCHF, “US Dollar vs Swiss Franc”

USDCHF is trading to break 0.9800 downwards. Possibly, the pair may form a downside continuation pattern. The target of this structure is at 0.9780.

USDCHF
Risk Warning: the result of previous trading operations do not guarantee the same results in the future

USDJPY, “US Dollar vs Japanese Yen”

USDJPY has broken 109.45 upwards. Possibly, today the pair may grow to reach 109.60 and then form a new descending structure towards 108.99 to finish the correction. After that, the instrument may resume trading inside the uptrend with the target at 109.70.

USDJPY
Risk Warning: the result of previous trading operations do not guarantee the same results in the future

AUDUSD, “Australian Dollar vs US Dollar”

AUDUSD is still moving upwards. Possibly, the pair may break 0.6930 and then continue growing to reach 0.6944, at least. Later, the market may form a new descending structure with the first target at 0.6858.

AUDUSD
Risk Warning: the result of previous trading operations do not guarantee the same results in the future

USDRUB, “US Dollar vs Russian Ruble”

USDRUB continues falling. Today, the pair may reach 61.63 and then start another correction towards 61.90. After that, the instrument may resume trading inside the downtrend with the target at 61.47.

USDRUB
Risk Warning: the result of previous trading operations do not guarantee the same results in the future

USDCAD, “US Dollar vs Canadian Dollar”

USDCAD is moving downwards. Possibly, the pair may break 1.3150 and then continue falling to reach 1.3131 and complete the correction. Later, the market may form one more ascending structure with the target at 1.3180.

USDCAD
Risk Warning: the result of previous trading operations do not guarantee the same results in the future

XAUUSD, “Gold vs US Dollar”

Gold is trading upwards. Today, the pair may reach 1507.70 (an alternative scenario). The main scenario implies that the price may start plunging at any moment.

GOLD
Risk Warning: the result of previous trading operations do not guarantee the same results in the future

BRENT

Brent is moving upwards. Possibly, today the pair may reach 67.00 and then start a new correction towards 66.36. After that, the market may resume trading upwards with the target at 67.22.

BRENT
Risk Warning: the result of previous trading operations do not guarantee the same results in the future

BTCUSD, “Bitcoin vs US Dollar”

BTCUSD has broken 7200.00 downwards. The main scenario implies that the pair may continue the correction towards 7000.00 and then then resume growing to break 7350.00. Later, the market may continue trading inside the uptrend with the target at 8200.00.

BITCOIN

Article By RoboForex.com

Attention!
Forecasts presented in this section only reflect the author’s private opinion and should not be considered as guidance for trading. RoboForex LP bears no responsibility for trading results based on trading recommendations described in these analytical reviews.

Ichimoku Cloud Analysis 26.12.2019 (AUDUSD, NZDUSD, USDCAD)

Article By RoboForex.com

AUDUSD, “Australian Dollar vs US Dollar”

AUDUSD is trading at 0.6927; the instrument is moving above Ichimoku Cloud, thus indicating an ascending tendency. The markets could indicate that the price may test the cloud’s upside border at 0.6890 and then resume moving upwards to reach 0.7015. Another signal to confirm further ascending movement is the price’s rebounding from the rising channel’s downside border. However, the scenario that implies further growth may be canceled if the price breaks the cloud’s downside border and fixes below 0.6850. In this case, the pair may continue falling towards 0.6765.

AUDUSD
Risk Warning: the result of previous trading operations do not guarantee the same results in the future

NZDUSD, “New Zealand Dollar vs US Dollar”

NZDUSD is trading at 0.6648; the instrument is moving above Ichimoku Cloud, thus indicating an ascending tendency. The markets could indicate that the price may test Tenkan-Sen and Kijun-Sen at 0.6600 and then resume moving upwards to reach 0.6745. Another signal to confirm further ascending movement is the price’s rebounding from the rising channel’s downside border. However, the scenario that implies further growth may be canceled if the price breaks the cloud’s downside border and fixes below 0.6550. In this case, the pair may continue falling towards 0.6465.

NZDUSD
Risk Warning: the result of previous trading operations do not guarantee the same results in the future

USDCAD, “US Dollar vs Canadian Dollar”

USDCAD is trading at 1.3153; the instrument is moving inside Ichimoku Cloud, thus indicating a sideways tendency. The markets could indicate that the price may test the cloud’s upside border at 1.3180 and then resume moving downwards to reach 1.3045. Another signal to confirm further descending movement is the price’s rebounding from the descending channel’s upside border. However, the scenario that implies further decline may be canceled if the price breaks the cloud’s upside border and fixes above 1.3205. In this case, the pair may continue growing towards 1.3305.

USDCAD

Article By RoboForex.com

Attention!
Forecasts presented in this section only reflect the author’s private opinion and should not be considered as guidance for trading. RoboForex LP bears no responsibility for trading results based on trading recommendations described in these analytical reviews.