Author Archive for InvestMacro – Page 116

Fibonacci Retracements Analysis 08.01.2020 (GBPUSD, EURJPY)

Article By RoboForex.com

GBPUSD, “Great Britain Pound vs US Dollar”

As we can see in the daily chart, there was a divergence on MACD, which made the pair reverse downwards after reaching 61.8% fibo. GBPUSD got very close to the support at 38.2% fibo (1.2883), but couldn’t test it. The current growth may be considered as a correction. However, taking into account a divergence on MACD, we may assume that the next descending impulse may break the support. Still, we shouldn’t exclude an opposite scenario: the instrument may start another rising wave towards 76.0% fibo at 1.3794.

GBPUSD_D1
Risk Warning: the result of previous trading operations do not guarantee the same results in the future

The H4 chart shows that the descending wave has corrected the previous uptrend by 38.2% fibo; the current growth may be considered as a correction, which has already reached 61.8% fibo and may continue towards 76.0% fibo at 1.3368 and the high at 1.3514. However, right now the price is falling to break the low at 1.2904. if it succeeds, the instrument may continue its mid-term decline towards 50.0% and 61.8% fibo at 1.2856 and 1.2700 respectively.

GBPUSD_H4
Risk Warning: the result of previous trading operations do not guarantee the same results in the future

EURJPY, “Euro vs. Japanese Yen”

In the daily chart, there was a divergence on MACD, which made the pair reverse downwards after reaching 50.0% fibo. Right now, EURJPY is testing the mid-term local support. If the price breaks 38.2 fibo and fixes below it, the instrument will continue falling towards the low at 115.86. An alternative scenario implies that the price may rebound from the support and resume trading upwards to reach 61.8% and 76.0% fibo at 123.05 and 124.69 respectively.

EURJPY_D1
Risk Warning: the result of previous trading operations do not guarantee the same results in the future

The H4 chart shows more detailed structure of the current descending correction. The pair is getting close to 38.2% fibo at 120.06. The next downside targets may be 50.0% and 61.8% fibo at 119.25 and 118.46 respectively. The resistance is the high at 122.65.

EURJPY_H4

Article By RoboForex.com

Attention!
Forecasts presented in this section only reflect the author’s private opinion and should not be considered as guidance for trading. RoboForex LP bears no responsibility for trading results based on trading recommendations described in these analytical reviews.

Middle East Conflict Is in the Focus of Attention

by JustForex

The US dollar strengthened against a basket of major currencies. Yesterday, the dollar index (#DX) closed in the green zone (+0.37%). The conflict between the US and Iran is in the focus of attention. It should be recalled that last week, US President Donald Trump ordered the airstrike in Baghdad. As a result, Iranian General Qasem Soleimani was killed, that caused tensions between the countries. On Monday, US Secretary of Defense Mark Esper said the United States had not planned to withdraw troops from Iraq. On Wednesday, Iran carried a series of missile strikes at two US air bases in Iraq. After the attack, Iran vowed revenge and stated that it was considering 13 different ways to create a “historical nightmare” for the United States. These events support the demand for safe-haven currencies.

Optimistic economic data from the US were published yesterday. ISM non-manufacturing PMI counted to 55.0 in December, while experts expected 54.5. Today we expect a report on ADP nonfarm employment change. In December, the Canadian Ivey PMI slowed down from 60.0 to 51.9.

The “black gold” prices are rising after fall the day before. Currently, futures for the WTI crude oil are testing the $62.85 mark per barrel. At 17:30 (GMT+2:00), US crude oil inventories will be published.

Market Indicators

Yesterday, there was the bearish sentiment in the US stock market: #SPY (-0.28%), #DIA (-0.43%), #QQQ (-0.01%).

The 10-year US government bonds yield has declined. At the moment, the indicator is at the level of 1.79-1.80%.

The Economic News Feed for 08.01.2020:
  • – ADP nonfarm employment change at 15:15 (GMT+2:00).

by JustForex

The Analytical Overview of the Main Currency Pairs on 2020.01.08

by JustForex

The EUR/USD currency pair

Technical indicators of the currency pair:
  • Prev Open: 1.11953
  • Open: 1.11510
  • % chg. over the last day: -0.37
  • Day’s range: 1.11441 – 1.11683
  • 52 wk range: 1.0879 – 1.1572

The EUR/USD currency pair is dominated by bearish sentiment. During yesterday’s trading, the drop in quotes exceeded 50 points. The trading instrument is currently consolidating. The local support and resistance levels are 1.11350 and 1.11650, respectively. We do not exclude a further decline in the EUR/USD currency pair. In December, the ISM U.S. Purchasing Managers Index accelerated from 53.9 to 55.0. Financial market participants continue to monitor developments in the Middle East. We recommend opening positions from key levels.

At 15:15 (GMT+2:00) the US will publish a report on the number of employees in the non-agricultural sector by ADP.

EUR/USD

The price has fixed below 100 MA, which signals the strength of sellers.

The MACD histogram is in the negative zone and continues to decline, which sends a strong signal to sell EUR/USD.

The Stochastic Oscillator is near the oversold zone, the %K line has crossed the %D line. There are no signals at the moment.

Trading recommendations
  • Support levels: 1.11350, 1.11100
  • Resistance levels: 1.11650, 1.12000, 1.12350

If the price consolidates below 1.11350, expect a further drop to 1.11000-1.10800.

Alternatively the quotes could grow to a round level of 1.12000.

The GBP/USD currency pair

Technical indicators of the currency pair:
  • Prev Open: 1.31683
  • Open: 1.31194
  • % chg. over the last day: -0.42
  • Day’s range: 1.31044 – 1.31471
  • 52 wk range: 1.1959 – 1.3516

An ambiguous technical pattern has developed on the GBP/USD currency pair. The trading instrument is in lateral movement. There is no defined trend. The pound is testing local support and resistance levels 1.31000 and 1.31600, respectively. Expect up-to-date information on Brexit. Open positions from key levels.

Today, the news background on the UK economy is quite calm.

GBP/USD

Indicators do not give accurate signals: the price has crossed 50 MA and 100 MA.

The MACD histogram is in the negative zone but above the signal line, which gives a weak signal to sell GBP/USD.

The Stochastic Oscillator is in the neutral zone, the %K line has crossed the %D line. There are no signals at the moment.

Trading recommendations
  • Support levels: 1.31000, 1.30550, 1.30000
  • Resistance levels: 1.31600, 1.32250

If the price consolidates below the round level of 1.31000, expect the quotes to fall toward 1.30600-1.30400.

Alternatively, the quotes could grow toward 1.32000-1.32300.

The USD/CAD currency pair

Technical indicators of the currency pair:
  • Prev Open: 1.29658
  • Open: 1.29851
  • % chg. over the last day: +0.25
  • Day’s range: 1.29802 – 1.30072
  • 52 wk range: 1.2949 – 1.3566

The USD/CAD currency pair continues to consolidate after a long fall. There is no defined trend. The local support and resistance levels are 1.29600 and 1.30000, respectively. In the near future, technical correction of the trading instrument is not ruled out. In December, the Canadian business activity index from Ivey slowed from 60.0 to 51.9. We recommend that you pay attention to the dynamics of prices for oil. Open positions from key levels.

The news background on the Canadian economy is calm.

USD/CAD

Indicators do not give accurate signals: the price has crossed 50 MA and 100 MA.

The MACD histogram is near the 0 mark. There are no signals at the moment.

Stochastic Oscillator is in the neutral zone, the %K line is above the %D line, which indicates bullish sentiment.

Trading recommendations
  • Support levels: 1.29600, 1.29200
  • Resistance levels: 1.30000, 1.30250, 1.30500

If the price consolidates above the round level of 1.30000, expect a correction toward 1.30300

An alternative could be a decrease in the USD/CAD currency pair to 1.29400-1.29200.

The USD/JPY currency pair

Technical indicators of the currency pair:
  • Prev Open: 108.327
  • Open: 108.447
  • % chg. over the last day: +0.07
  • Day’s range: 107.651 – 108.513
  • 52 wk range: 104.45 – 113.53

Since the beginning of this week, trading on the USD/JPY currency pair has been very active. The focus is on geopolitical tensions in the Middle East. Demand for “safe haven” currencies remains at a fairly high level. At the moment, the following local support and resistance levels can be distinguished: 108.150 and 108.600, respectively. We recommend that you pay attention to the dynamics of yield on US government bonds. Open positions from key levels.

The news background on the Japanese economy is calm.

USD/JPY

Indicators do not give accurate signals: the price has crossed 50 MA and 100 MA.

The MACD histogram has approached the 0 mark. There are no signals at the moment.

The Stochastic Oscillator is near the overbought zone, the %K line has crossed the %D line. There are no signals at the moment.

Trading recommendations
  • Support levels: 108.150, 107.800
  • Resistance levels: 108.600, 108.850, 109.000

If the price consolidates below 108.150, expect the quotes to fall toward 107.800-107.600.

Alternatively, the quotes could grow toward 109.000.

by JustForex

Markets roil on Iran attack: Investors urged to be cautious and consistent

By George Prior

Investors should remain “cautious and consistent” as Iran retaliates against the U.S. for killing one of its most revered military generals.

The message from Nigel Green, founder and CEO of deVere Group, comes as global financial markets roil on the news that an Iranian rocket attacked U.S. forces based in Iraq.

Mr Green comments: “Geopolitical tensions are certainly heightening, and this always creates uncertainty – something which markets typically loathe as it becomes more difficult to know where things are headed. In other words, they can’t price uncertainty.

“In many regards, the U.S.-Iran situation has now surpassed the trade war as the biggest risk to financial markets. This has been reflected in the current volatility.”

He continues: “Investors must, of course, monitor the U.S.-Iran situation, what has led to it and where it might play out.

“They need to ensure that their portfolios are properly diversified by geography, industrial sector and asset class in order to manage risk, to navigate the increasing volatility and also to take advantage of potential opportunities when they arise.

“If their portfolio is indeed well-diversified, for the time being at least I would urge investors to remain cautious and consistent.  If portfolios are not properly diversified, recent events could serve as a wake-up call to reposition.”

He continues: “In terms of what investors should do against a fast-moving backdrop with many potential and far-reaching consequences, it is not ‘sell in a panic’, or the opposite reaction: ‘buy excessively’.

“It’s almost impossible to forecast what the market is going to do in the immediate future – and it is much too early to say what happens next and how investor sentiment will affect markets.”

He goes on to add: “However, what we do know is that over the longer-term the performance of stock markets is fairly predictable: they go up.

“For this reason, over a longer time horizon, investing in equities is almost universally recognized as one of the best ways people can accumulate wealth.”

The deVere CEO concludes: “It is often said that the key to investment success is to buy low and sell high.  The only problem with that theory is that trying to accurately time the weakest point in the cycle is impossible.

“As such, it is best to just feed the money in over time in a measured way in order to take advantage of the long-term trend of stock markets to deliver long-term capital growth.

“History has shown us that panic-selling or panic-buying can be potentially financially damaging for investors.”

About:

deVere Group is one of the world’s largest independent advisors of specialist global financial solutions to international, local mass affluent, and high-net-worth clients.  It has a network of more than 70 offices across the world, over 80,000 clients and $12bn under advisement


Gold with a very bullish start into 2020 – 1,650/700 USD as target activated

By Admiral Markets

Source: Economic Events January 8, 2020 – Admiral Markets’ Forex Calendar

Driven by the recent developments in the Middle East last beginning last Friday and continuing through to today, as fears rise that a war between the US and Iran could be about to start, Gold profited from the resulting risk-off mode.

As 10-year US-Treasury yields drop, Gold took on momentum, driven also by the bullish seasonal window from Mid-December through Mid-January (displayed in orange).

While the mode looks a little extended on the upside, the yield-sensitive precious metal is also known for its trend stability, meaning that we could see a direct push up to the next potential target region of around 1,650/700 USD.

Technically, the break above the 2019 yearly highs around 1,557 USD is a clear bullish sign, with 1,557 USD and below 1,520/525 USD acting as potential long trigger.

On a daily time-frame Gold stays bullish as long as we trade above 1,440/450 USD:

Source: Admiral Markets MT5 with MT5-SE Add-on Gold Daily chart (between October 5, 2018, to January 7, 2020). Accessed: January 7, 2020, at 10:00pm GMT – Please note: Past performance is not a reliable indicator of future results, or future performance.

In 2015, the value of Gold fell by 10.4%, in 2016, it increased by 8.1%, in 2017, it increased by 13.1%, in 2018, it fell by 1.6%, in 2019, it increased by 18.9%, meaning that after five years, it was up by 28%.

Discover the world’s #1 multi-asset platform

Admiral Markets offers professional traders the ability to trade with a custom, upgraded version of MetaTrader 5, allowing you to experience trading at a significantly higher, more rewarding level. Experience benefits such as the addition of the Market Heat Map, so you can compare various currency pairs to see which ones might be lucrative investments, access real-time trading data, and so much more. Click the banner below to start your FREE download of MT5 Supreme Edition!

Download MetaTrader 5 and begin trading today!

Disclaimer: The given data provides additional information regarding all analysis, estimates, prognosis, forecasts or other similar assessments or information (hereinafter “Analysis”) published on the website of Admiral Markets. Before making any investment decisions please pay close attention to the following:

  1. This is a marketing communication. The analysis is published for informative purposes only and are in no way to be construed as investment advice or recommendation. It has not been prepared in accordance with legal requirements designed to promote the independence of investment research, and that it is not subject to any prohibition on dealing ahead of the dissemination of investment research.
  2. Any investment decision is made by each client alone whereas Admiral Markets shall not be responsible for any loss or damage arising from any such decision, whether or not based on the Analysis.
  3. Each of the Analysis is prepared by an independent analyst (Jens Klatt, Professional Trader and Analyst, hereinafter “Author”) based on the Author’s personal estimations.
  4. To ensure that the interests of the clients would be protected and objectivity of the Analysis would not be damaged Admiral Markets has established relevant internal procedures for prevention and management of conflicts of interest.
  5. Whilst every reasonable effort is taken to ensure that all sources of the Analysis are reliable and that all information is presented, as much as possible, in an understandable, timely, precise and complete manner, Admiral Markets does not guarantee the accuracy or completeness of any information contained within the Analysis. The presented figures refer that refer to any past performance is not a reliable indicator of future results.
  6. The contents of the Analysis should not be construed as an express or implied promise, guarantee or implication by Admiral Markets that the client shall profit from the strategies therein or that losses in connection therewith may or shall be limited.
  7. Any kind of previous or modeled performance of financial instruments indicated within the Publication should not be construed as an express or implied promise, guarantee or implication by Admiral Markets for any future performance. The value of the financial instrument may both increase and decrease and the preservation of the asset value is not guaranteed.
  8. The projections included in the Analysis may be subject to additional fees, taxes or other charges, depending on the subject of the Publication. The price list applicable to the services provided by Admiral Markets is publicly available from the website of Admiral Markets.
  9. Leveraged products (including contracts for difference) are speculative in nature and may result in losses or profit. Before you start trading, you should make sure that you understand all the risks.

By Admiral Markets

Crude Oil Reverses Lower Again After US Missile Attack

By TheTechnicalTraders.com

Normally, after tensions between Iran/Iraq and the US flare-up, Oil and Gold rally quite extensively but reversed sharply lower by the end of the session.

Yes, Gold is 1% higher today and was up over $35 overnight, but Crude Oil has actually moved lower today which is a fairly strong indication that disruptions in oil supply from the Middle East are not as concerning as they were 10+ years ago. Traders and investors don’t believe this isolated targeted missile attack will result in any extended aggression between the US and Iran.

When past conflicts in the Middle East happened, Oil would typically rally and Gold would spike higher as well.  Consider this a reflex action to uncertain oil supply issues and concerns that global market uncertainty could crash the markets.  Gold seems like an easy expectation related to this type of uncertainty as it continues to act as a hedge against many risks like missiles/war, financial uncertainties etc…

In my pre-market video report to subscribers today (Monday, Jan 6th) I pointed out how the price of crude oil was testing a critical resistance area form the last time there were missiles fired. Today’s reversal is not a huge surprise and in fact, it looks like an exhaustion top.

Oil, on the other hand, has experienced one of the longer price declines in recent history, from the peak price near $147 near July 2008 to levels currently near $63.  But we saw a low price for oil below $30 (near February 2016).

Crude Oil Daily Chart

I believe a technical resistance channel may be pushing Oil prices lower today as the price has continued to rotate lower after moving into this extended Resistance Channel.  It may be that global traders don’t believe this conflict with Iran will result in any type of massive oil supply disruption or risk for the global markets right away.  The Resistance Channel, between $63 and $65.50, has continued to act as a price ceiling over the past 7+ months.

Crude Oil Weekly Chart

Our proprietary Fibonacci Price Modeling system is highlighting similar levels near $64 and $50.  This price modeling system maps and tracks price rotation using a proprietary adaptive Fibonacci price theory model.  These levels, highlighted on this chart, represent immediate price target levels for any upside move (CYAN, already reached) and any downside move (BLUE, suggesting a move back towards $50 may be in the works).

If Oil is not capable of breaking above this Resistance Channel, then Fibonacci Price Theory would suggest price must turn lower and attempt to establish a new LOW PRICE level that is below recent low price levels.

If this Resistance Channel continues to act as a solid price ceiling, Crude Oil may turn lower over the first few quarters of 2020 and attempt to target levels near or below $50 fairly soon.  Skilled traders should prepare for this type of move and identify opportunities for profits in the near future.

In fact, I also gave subscribers a head up that GDXJ and TLT were going to gap higher and likely be under pressure all session. Also, I showed how the SP500 was going to gap lower deep into oversold territory and likely rally strongly just like last Friday, all of these things happened perfectly today.

Pre-market GDXJ, SPY, TLT warning of price gaps into extreme territories beyond the small colored lines: Red (overbought level), and Green (oversold level)

Pre-Market Chart Analysis

End Of Day Market Movements

My point is my team and I have a good pulse on the major markets and can profit during times when most others can’t which is why you should join my Wealth Trading Newsletter for index, metals, and energy trade alerts. Visit our website to learn how you can see what this research is telling us.

I am going to give away and ship out silver and gold rounds to anyone who buys a 1-year, or 2-year subscription to my Wealth Trading Newsletter. You can upgrade to this longer-term subscription or if you are new, join one of these two plans listed below, and you will receive:

1oz Silver Round FREE 1-Year Subscription 
1/2 Gram Gold Bar FREE 2-Year Subscription

SUBSCRIBE TO MY TRADE ALERTS AND 
GET YOUR FREE BULLION!
Free Shipping!

Chris Vermeulen

TheTechnicalTraders.com

Bitcoin price to surge amid heightening geopolitical tensions

By George Prior

Escalating tensions between the U.S. and Iran are likely to drive the price of Bitcoin higher, affirms the CEO of one of the world’s largest independent financial services and advisory organizations.

The comments from Nigel Green, the chief executive and founder of deVere Group, come as Tehran threatens “revenge” on the U.S. over the killing of Qassem Soleimani, the commander of Iran’s elite Quds Force, who was in charge of the country’s regional security strategy.

It remains uncertain how, when, or if Iran will respond, but any retaliation is unlikely until after the end of three days of mourning.

Mr Green notes: “Bitcoin, the world’s largest cryptocurrency by market capitalization, jumped 5 per cent as news of the strikes broke around the world on Friday. Simultaneously, the price of gold – known as the ultimate safe-haven asset – also moved higher.

“We’ve seen Bitcoin price surges before during times of heightened geopolitical tensions. For instance, in August it jumped as global stocks were rocked by the devaluation of China’s yuan during the trade war with the U.S.

“This latest Bitcoin price increase underscores a mounting consensus that Bitcoin is becoming a flight-to-safety asset.

“Bitcoin is living up to its reputation as ‘digital gold’. Bitcoin – which shares gold’s characteristics of being a store of value and scarcity and of being perceived as being resistant to inflation – could potentially dethrone gold in the future as the world becomes increasingly digitalized.”

He continues: “With an escalation in geopolitical turbulence, which typically unsettles traditional markets, it can be expected that a growing number of investors will decide to increase their exposure to decentralized, non-sovereign, secure currencies, such as Bitcoin, to help protect them from the turmoil.

“The serious concerns created by geopolitical issues, such as the U.S.- Iran issue will likely prompt an increasing number of institutional and retail investors to diversify their portfolios and hedge against those risks by investing in crypto assets.

“This will push the price of Bitcoin higher. In turn, due to the market influence of Bitcoin, other major digital currencies will receive a price boost.”

The deVere CEO concludes: “Bitcoin was one of the best-performing assets of 2019 and we can expect to see its investment appeal further strengthen as it becomes known as a safe-haven asset during periods of heightened geopolitical tensions.”

About:

deVere Group is one of the world’s largest independent advisors of specialist global financial solutions to international, local mass affluent, and high-net-worth clients.  It has a network of more than 70 offices across the world, over 80,000 clients and $12bn under advisement


DAX30 CFD being pushed below 13,000 out of US-Iran war fears?

By Admiral Markets

Source: Economic Events January 6, 2020 – Admiral Markets’ Forex Calendar

The DAX30 CFD had a prosperous start for the new year, but gave surrendered all its gains and more last Friday.

The main driver for this bearish action came from recent developments in the Middle East last Friday, when the Pentagon launched an airstrike that killed Iranian commander Soleimani, sparking fears that a war between the US and Iran could be about to start, increasing chances of a broad risk-off mode and break below 13,000 points on the table.

In addition to that, White House advisor Peter Navarro mentioned during his CNBC interview that the US is “going to try to get something going with Great Britain, Vietnam, Europe and anybody else who wants to fairly trade with the United States of America”.

If, based on these comments, speculation among market participants infer that Europe could be attacked with tariff announcement from the US in the near future, the German index could quickly see further selling pressure.

On the other hand; as the Fed to continues to flood markets with liquidity in the hopes of avoiding avoid a funding crisis, particularly in the repo market, (and will thus extend the Fed balance sheet to new record highs by mid-January) the downside should be limited and only a drop below 13,080/100 points would significantly darken the technical picture on H1.

The main focus on the upside stays on 13,480/500 points, and a break higher should be considered clearly bullish, making a test of the current all-time highs around 13,600 points likely:

Source: Admiral Markets MT5 with MT5-SE Add-on DAX30 CFD Hourly chart (between December 10, 2019, to January 3, 2020). Accessed: January 3, 2020, at 10:00pm GMT

Source: Admiral Markets MT5 with MT5-SE Add-on DAX30 CFD Daily chart (between September 20, 2018, to January 3, 2020). Accessed: January 3, 2020, at 10:00pm GMT – Please note: Past performance is not a reliable indicator of future results, or future performance.

In 2015, the value of the DAX30 CFD increased by 9.56%, in 2016, it increased by 6.87%, in 2017, it increased by 12.51%, in 2018, it fell by 18.26%, in 2019, it increased by 26.44% meaning that after five years, it was up by 34.2%.

Discover the world’s #1 multi-asset platform

Admiral Markets offers professional traders the ability to trade with a custom, upgraded version of MetaTrader 5, allowing you to experience trading at a significantly higher, more rewarding level. Experience benefits such as the addition of the Market Heat Map, so you can compare various currency pairs to see which ones might be lucrative investments, access real-time trading data, and so much more. Click the banner below to start your FREE download of MT5 Supreme Edition!

Download MetaTrader 5 and begin trading today!

Disclaimer: The given data provides additional information regarding all analysis, estimates, prognosis, forecasts or other similar assessments or information (hereinafter “Analysis”) published on the website of Admiral Markets. Before making any investment decisions please pay close attention to the following:

  1. This is a marketing communication. The analysis is published for informative purposes only and are in no way to be construed as investment advice or recommendation. It has not been prepared in accordance with legal requirements designed to promote the independence of investment research, and that it is not subject to any prohibition on dealing ahead of the dissemination of investment research.
  2. Any investment decision is made by each client alone whereas Admiral Markets shall not be responsible for any loss or damage arising from any such decision, whether or not based on the Analysis.
  3. Each of the Analysis is prepared by an independent analyst (Jens Klatt, Professional Trader and Analyst, hereinafter “Author”) based on the Author’s personal estimations.
  4. To ensure that the interests of the clients would be protected and objectivity of the Analysis would not be damaged Admiral Markets has established relevant internal procedures for prevention and management of conflicts of interest.
  5. Whilst every reasonable effort is taken to ensure that all sources of the Analysis are reliable and that all information is presented, as much as possible, in an understandable, timely, precise and complete manner, Admiral Markets does not guarantee the accuracy or completeness of any information contained within the Analysis. The presented figures refer that refer to any past performance is not a reliable indicator of future results.
  6. The contents of the Analysis should not be construed as an express or implied promise, guarantee or implication by Admiral Markets that the client shall profit from the strategies therein or that losses in connection therewith may or shall be limited.
  7. Any kind of previous or modeled performance of financial instruments indicated within the Publication should not be construed as an express or implied promise, guarantee or implication by Admiral Markets for any future performance. The value of the financial instrument may both increase and decrease and the preservation of the asset value is not guaranteed.
  8. The projections included in the Analysis may be subject to additional fees, taxes or other charges, depending on the subject of the Publication. The price list applicable to the services provided by Admiral Markets is publicly available from the website of Admiral Markets.
  9. Leveraged products (including contracts for difference) are speculative in nature and may result in losses or profit. Before you start trading, you should make sure that you understand all the risks.

By Admiral Markets

NASDAQ Set to Fall 1000pts In Early 2020, and What it Means for Gold

By TheTechnicalTraders.com

One of our most interesting predictive modeling system is the Adaptive Dynamic Learning (ADL) price modeling system.  It is capable of learning from past price data, building price DNA chains and attempting to predict future price activity with a fairly high degree of accuracy.  The one thing we’ve learned about the ADL system is that when price mirrors the ADL predictive modeling over a period of time, then there is often a high probability that price will continue to mirror the ADL price predictions.

One of our more infamous ADL predictions was our October 2018 Gold ADL prediction chart (below).  This chart launched a number of very interesting discussions with industry professionals about predictive modeling and our capabilities regarding Adaptive Learning.  Eric Sprott, of Sprott Money, highlighted some of our analyses related to the ADL predictive modeling system in June and July 2019.  Our ADL predictive modeling system suggested a bottom would form in Gold near April/May 2019 and then Gold would rally up toward $1600 by September 2019, then rotate a bit lower near $1550 levels.

October 2018 Gold Forecast

Current 2020 Gold Forecast

This next chart shows what really happened with Gold prices compared to the ADL predictions above.  It is really hard to argue that the ADL predictions from October 2018 were not DEAD ON accurate in terms of calling and predicting the future price move in Gold.  Will the ADL predictions for the NQ play out equally as accurate in predicting a downward price rotation of 1000pts or more?

Current 2020 NASDAQ Forecast

This NQ Weekly chart shares out ADL Predictive Modeling systems results originating on September 23, 2019.  The Price DNA markers for this analysis consist of 15 unique price bars suggesting the future resulting price expectations are highly probable outcomes (95% to 99.95%).  This analysis suggests the end of 2019 resulting in a broad market push higher in early 2020 may come to an immediate end with a downward price move of 800 to 1000+ pts before January 20~27, 2020.  The ADL predictive modeling system is suggesting price will be trading near 8000 by January 20th or so.

Only time will tell in regards to the future outcome of these ADL predictions, but given the current news of the US missile attack in Iraq and the uncertainty this presents, it would not surprise us to see the NQ fall below the 8000 level as this euphoric price rally rotates to find support before moving forward in developing a new price trend.

Pay attention to what happens early next week with regards to price and understand the 8000 level will likely be strong support unless something breaks the support in the markets over the next 30+ days.  Ultimate support near 7200 is also a possibility if a deeper downside move persists.

As we’ve been warning for many months, 2020 is going to be a fantastic year for skilled technical traders.  You won’t want to miss these opportunities in precious metals, stocks, ETFs and others.

We have a good pulse on the major markets and can profit during times when most others can’t which is why you should join my Wealth Trading Newsletter for index, metals, and energy trade alerts. Visit our website to learn how you can see what this research is telling us.

I am going to give away and ship out silver rounds to anyone who buys a 1-year, or 2-year subscription to my Wealth Trading Newsletter. You can upgrade to this longer-term subscription or if you are new, join one of these two plans listed below, and you will receive:

1oz Silver Round FREE 1-Year Subscription 

1/2 Gram Gold Bar FREE 2-Year Subscription

SUBSCRIBE TO MY TRADE ALERTS AND 
GET YOUR FREE BULLION ROUNDS!
Free Shipping!

Chris Vermeulen


What does the global stock market contraction after the missile strike mean?

By TheTechnicalTraders.com

The US Stock Market contracted in early morning trading on Friday, January 3, by more than 1% after news of the missile attack in Baghdad targeting a top-level Iranian military General and others.  After the attack on the US Embassy in Iraq last week, President Trump issued a strong warning that the US would act to protect its people throughout the world and Iran scoffed at this message.  It would certainly appear President Trump means business and won’t hesitate to stop terrorists from acting against the US – no matter where they are in the world.

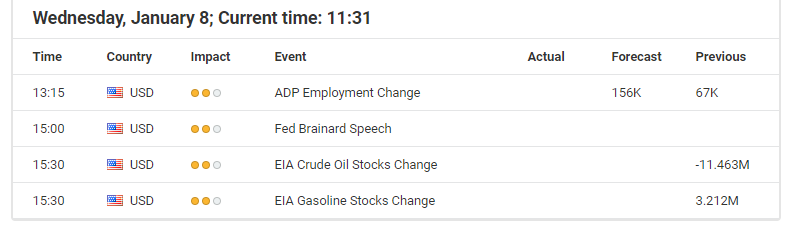
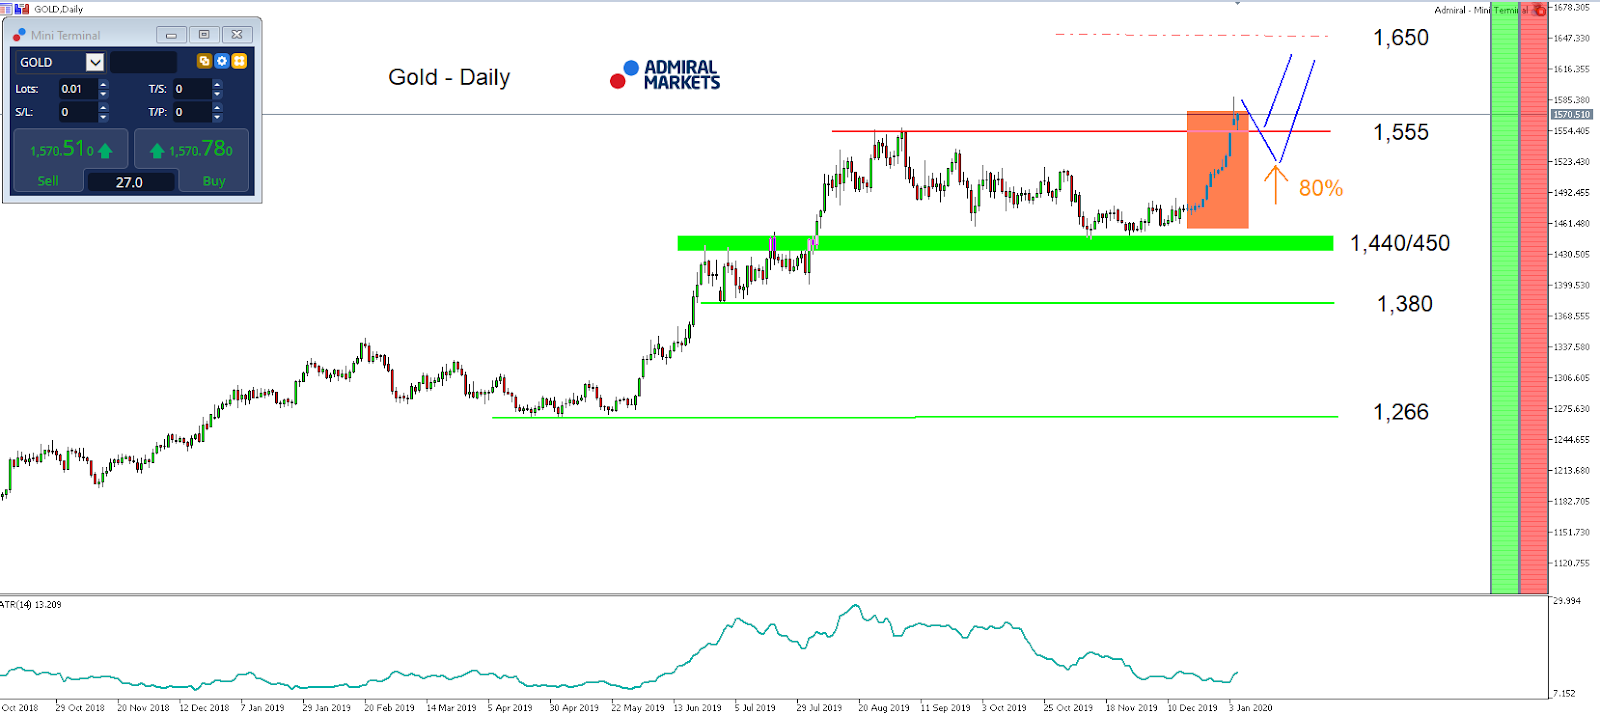
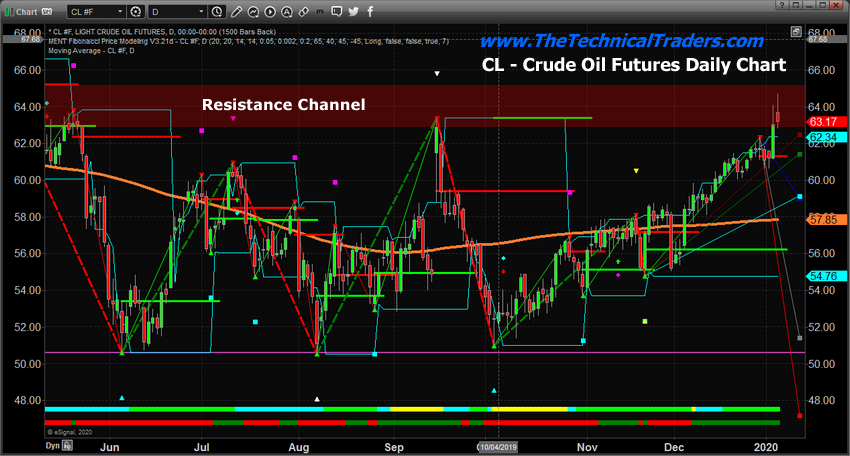
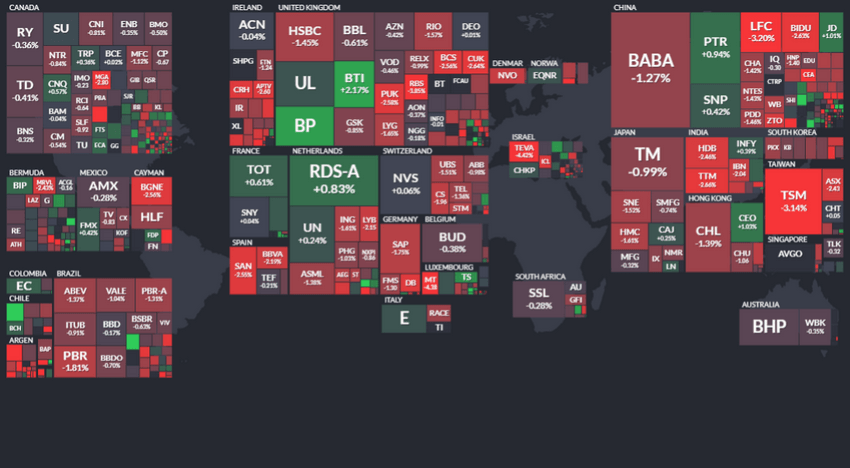
This news, overnight, pushed Oil, Gold, Silver and most precious metals higher.  The fear factor associated with the unknowns of what may come from these actions shot through the roof over the past 24 hours.  The global stock markets contracted by a fairly strong amount in Friday’s trading.  Most global markets were off by 0.75% to levels well over 1%.

Global Market Selloff After Missle Strike – Canada, Brazil, China, UK…

The real question skilled technical traders must ask themselves is this “will this turn of events prompt a change in investor expectations/thinking over the next 12+ months”?

I can remember what happened in the markets and the US economy in 1991 when Desert Storm happened.  Because this was one of the first US military efforts that were televised almost 24/7, almost immediately people were suddenly distracted by these war images and videos.  They were entranced by the actions taking place half-way around the world.  Local economies slowed because of this change in consumer sentiment and certain businesses struggled as their customers stayed home and watched TV.

A similar type of event happened after 9/11.  The United States was in shock.  People still attempted to conduct life as normal, yet our objectives changed.  We lost a bit of that care-free American attitude that we had in place before the 9/11 event.  We were more solemn, more conservative, more reserved in our daily lives.  Could something like this happen if Iran (and neighbors) attempt to retaliate against the US for this missile attack?  Could this change the thinking of consumers and investors as concerns about re-engaging in a Middle East conflict arise?

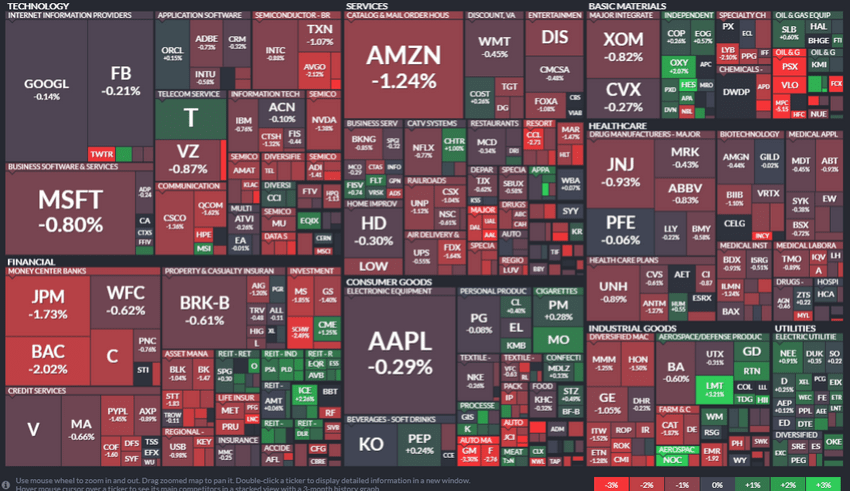
US Market Sold Off on Missile Attack

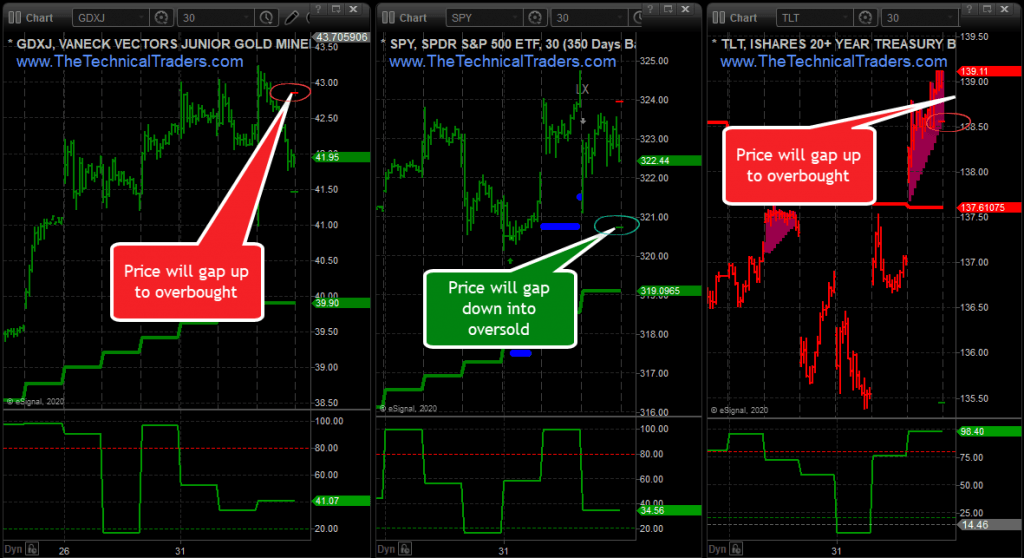
The US stock market contracted fairly strongly in early trading on Friday, January 3, 2020.  Yet, by afternoon trading, support had pushed most prices off the lows.  We authored a research article recently that suggested traders were very emotional near the end of 2019.  We believe these emotions could continue to haunt the markets in various ways over the next 10 to 25+ trading days.  One thing we are concerned with is a change in price trend sometime between January 13 and January 25.  We believe these dates could prompt a major change in price trend and direction in the near future.

December 20, 2019: WHO SAID TRADERS AND INVESTOR ARE EMOTIONAL RIGHT NOW?

We don’t have a confirmation, as of yet, that any major trend change is taking place – but we feel it would be unprofessional to not warn traders that an event like this could dramatically change the way traders view future expectations.  We really have to understand one key factor about investing and trading – trends are the results of investors/traders believing the future revenues and results of a company, stock or economy will product greater or weaker returns.  If investors believe the returns will be greater, then the trend tends to move higher.  If investors believe the returns will be weaker, then the trend tends to move lower.

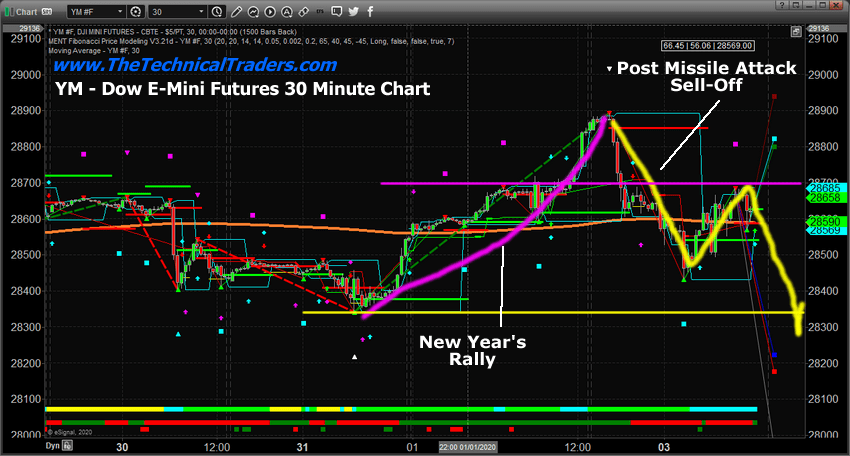
Event Could Change Equities Market Outlook – Dow Jones Index

Could this new event change future expectations for traders and investors?  How will extended uncertainty or military engagement alter trader’s expectations over the next 12+ months?

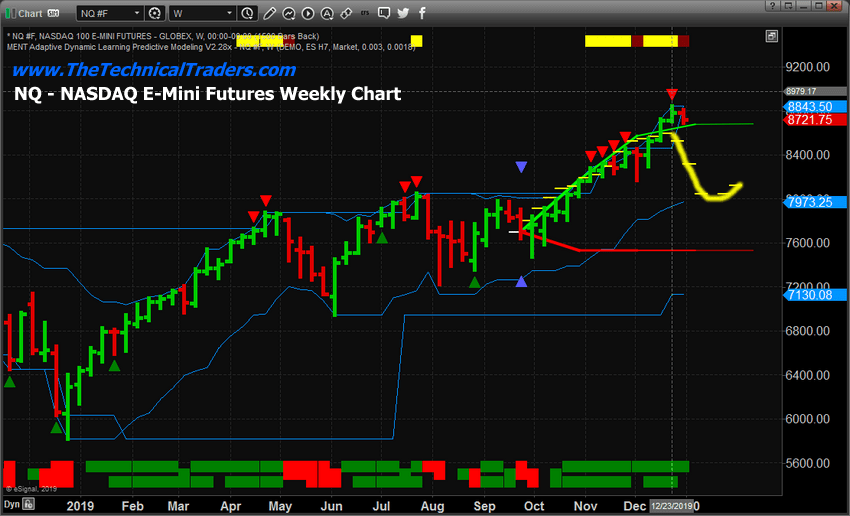
Right now, we want to urge our followers to protect their open long positions and watch carefully as this event unfolds.  We don’t have any confirmation that a trend change is taking place.  If the YM price fell to levels below $28,000, then we would consider recent support near $28,350 breached and begin to take a look at other price modeling systems.

We suggest our followers read the following research post from the end of 2019.  This will give you a better understanding of what is really happening right now and what would be needed to push the markets into a new bearish trend in early 2020.

December 31, 2019: WHAT TO EXPECT IN EARLY 2020

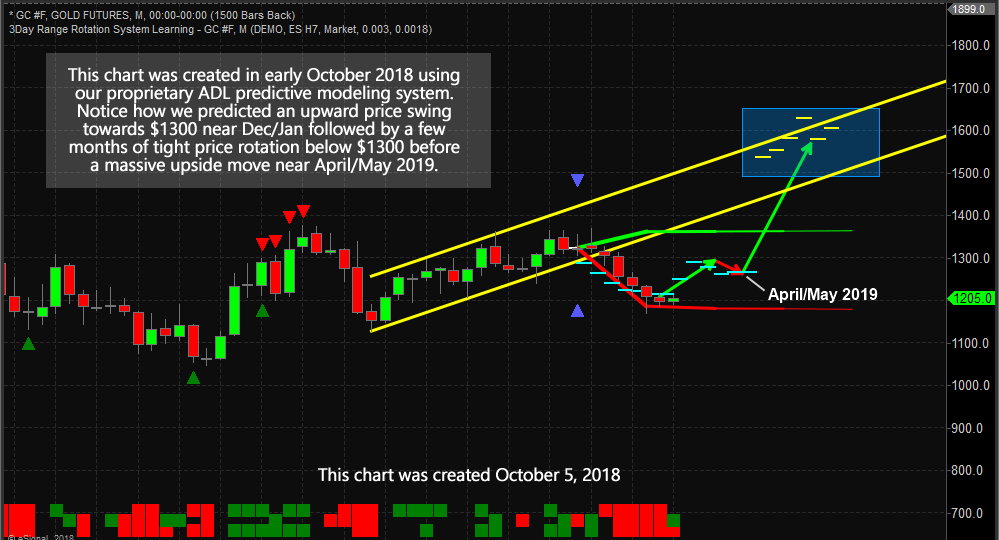
As we warned throughout most of 2019, we believe 2020 will be an incredible year for traders with extended volatility and returns.  You really don’t want to miss these bigger price moves when they happen.  Our precious metals calls throughout all of 2019 were nearly perfect and our recent Gold calls have nailed this big move.  Get ready – 2020 is going to be a great year for skilled technical traders.

With over 55 years of technical trading experience, we have been through a few bull/bear market cycles, I have a good pulse on the market, timing key turning points and what to buy and sell for both short-term swing trading and long-term investment capital. The opportunities are financially life-changing if handled properly.

I urge you visit my Wealth Building Newsletter and if you like what I offer, join me with the 1 or 2-year subscription to lock in the lowest rate possible and ride my coattails as I navigate these financial markets and build wealth while others lose nearly everything they own.

Chris Vermeulen
Founder of Technical Traders Ltd.

NOTICE: Our free research does not constitute a trade recommendation or solicitation for our readers to take any action regarding this research.  It is provided for educational purposes only.  Our research team produces these research articles to share information with our followers/readers in an effort to try to keep you well informed.  Visit our web site TheTechnicalTraders.com to learn how to take advantage of our members-only research and trading signals.