Author Archive for InvestMacro – Page 109

The Analytical Overview of the Main Currency Pairs on 2020.01.17

by JustForex

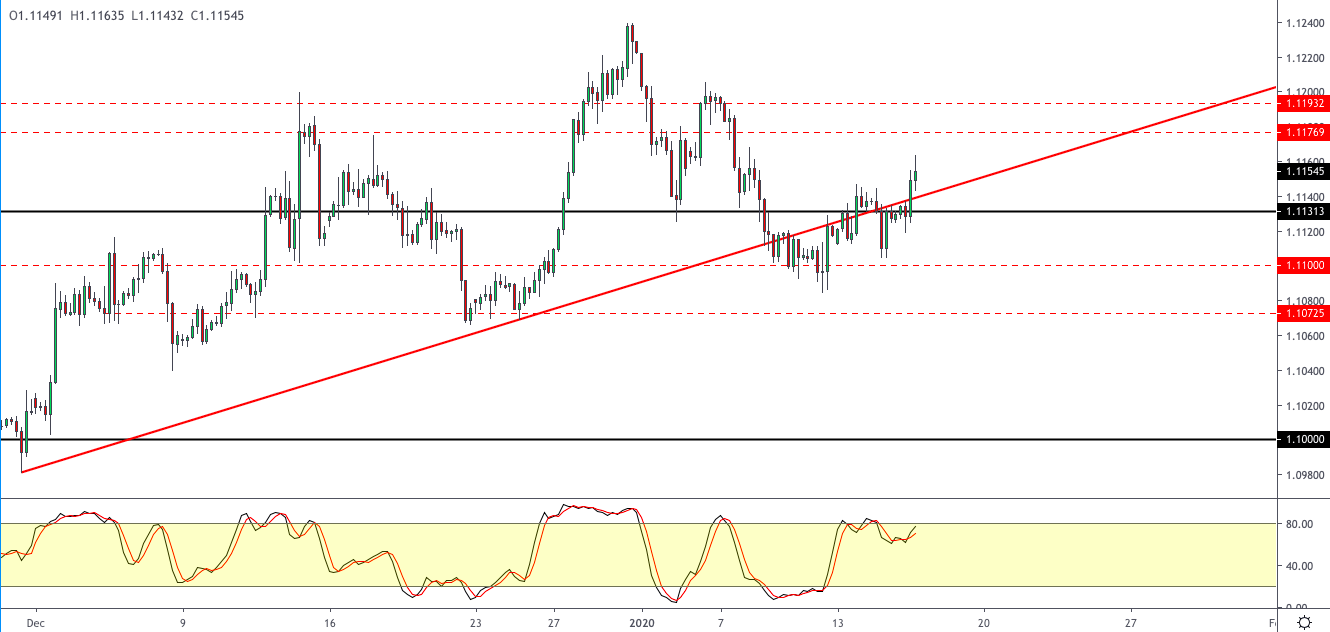
The EUR/USD currency pair

Technical indicators of the currency pair:
  • Prev Open: 1.11496
  • Open: 1.11351
  • % chg. over the last day: -0.12
  • Day’s range: 1.11310 – 1.11426
  • 52 wk range: 1.0879 – 1.1572

An ambiguous technical picture has developed on the EUR/USD currency pair. Quotes are in lateral movement. At the moment, the local support and resistance levels are 1.11200 and 1.11450, respectively. Greenback demand rose after the publication of optimistic statistics on US retail sales and manufacturing activity in the Philadelphia County. Today, investors also expect the release of important economic releases. We recommend opening positions from key levels.

The Economic News Feed for 17.01.2020:

  • – data on inflation in the eurozone – 12:00 (GMT+2:00);
  • – statistics on the real estate market in the USA – 15:30 (GMT+2:00).
EUR/USD

Indicators do not give accurate signals: the price crossed 50 MA and 100 MA.

The MACD histogram is in the negative zone, but above the signal line, which gives a weak signal to sell EUR/USD.

The Stochastic Oscillator is in the neutral zone, the %K line is above the %D line, which indicates bullish sentiment.

Trading recommendations
  • Support levels: 1.11200, 1.10900
  • Resistance levels: 1.11450, 1.11700, 1.12000

If the price consolidates above 1.11450, expect the quotes to rise toward 1.11700-1.11900.

Alternatively, the quotes could descend toward 1.10900-1.10800.

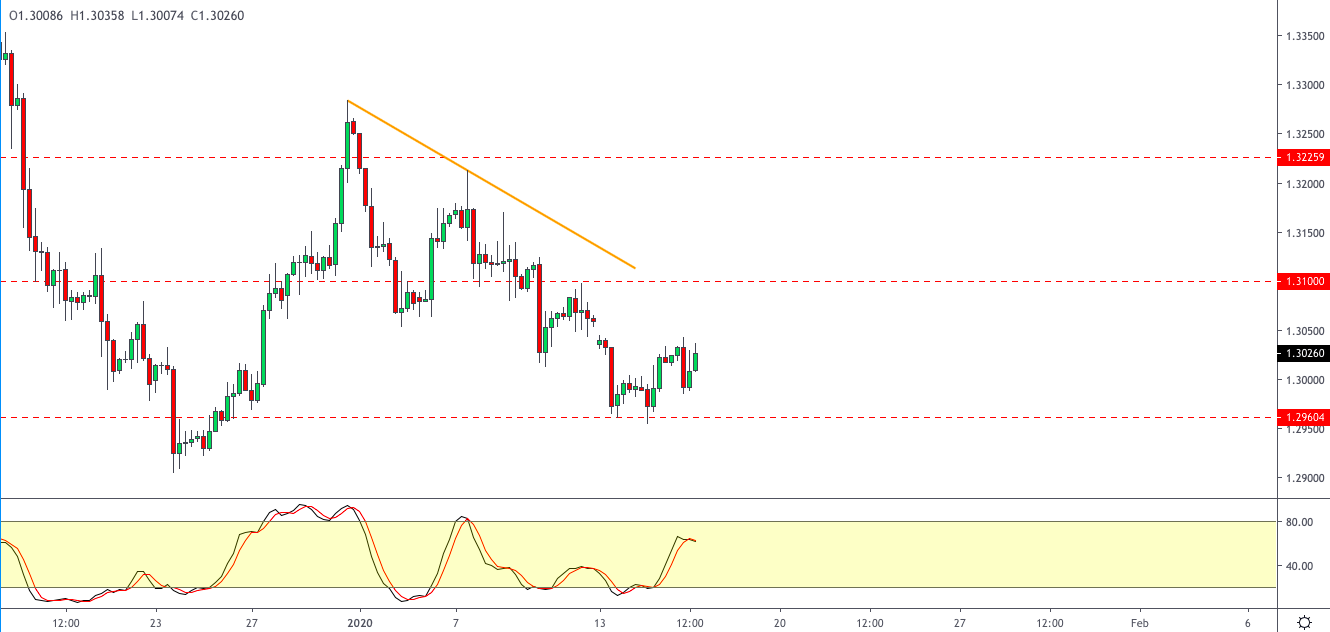
The GBP/USD currency pair

Technical indicators of the currency pair:
  • Prev Open: 1.30373
  • Open: 1.30777
  • % chg. over the last day: +0.29
  • Day’s range: 1.30641 – 1.30901
  • 52 wk range: 1.1959 – 1.3516

On the GBP/USD currency pair, bullish sentiment prevails. The pound again updated local highs. At the moment, GBP / USD quotes are testing the resistance level of 1.30900. Mark 1.30450 is already a mirror support. A trading instrument has the potential for further recovery. Today, participants in financial markets will evaluate important statistics on the UK economy. We also recommend paying attention to the news background from the USA. Open positions from key levels.

At 11:30 (GMT+2:00), a report on the retail sales in the UK will be published.

GBP/USD

The price has fixed above 50 MA and 100 MA, which signals the strength of buyers.

The MACD histogram is in the positive zone, indicating a bullish sentiment.

The Stochastic Oscillator is in the neutral zone, the %K line is above the %D line, which also gives a signal to buy GBP/USD.

Trading recommendations
  • Support levels: 1.30450, 1.30000, 1.29600
  • Resistance levels: 1.30900, 1.31400, 1.31700

If the price consolidates above the level of 1.30900, further growth of GBP/USD quotes is expected. The potential movement is to 1.31300-1.31600.

An alternative could be a decrease in the GBP / USD currency pair to 1.30200-1.30000.

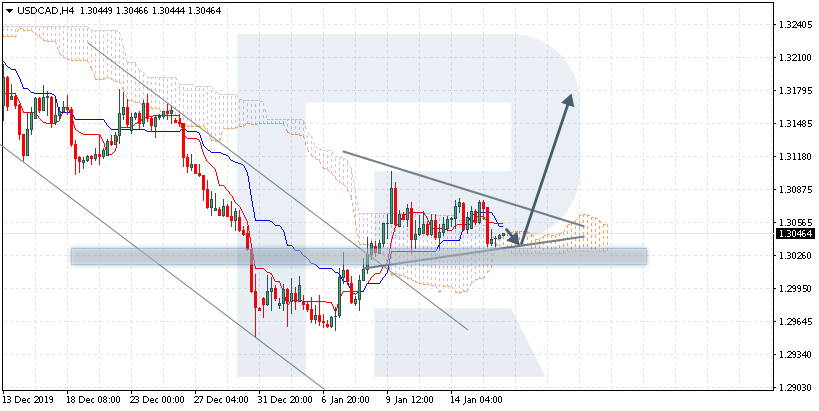
The USD/CAD currency pair

Technical indicators of the currency pair:
  • Prev Open: 1.30424
  • Open: 1.30415
  • % chg. over the last day: -0.03
  • Day’s range: 1.30389 – 1.30525
  • 52 wk range: 1.2949 – 1.3566

CAD continues to consolidate in a fairly narrow range. Participants in financial markets expect additional drivers. USD / CAD quotes test local support and resistance levels: 1.30350 and 1.30550, respectively. A trading instrument has a downside potential. We are waiting for statistics on the US real estate market. We also recommend that you pay attention to the dynamics of prices of black gold. Open positions from key levels.

The Economic News Feed for 17.01.2020 is calm.

USD/CAD

Indicators do not give accurate signals: 50 MA crossed 100 MA.

The MACD histogram is near the 0 mark.

The Stochastic Oscillator is in the neutral zone, the %K line is below the %D line, which indicates a bearish sentiment.

Trading recommendations
  • Support levels: 1.30350, 1.30200, 1.30000
  • Resistance levels: 1.30550, 1.30750, 1.31000

If the price consolidates below 1.30350, expect the quotes to fall toward 1.30000-1.29800.

Alternatively, the quotes could grow toward 1.30750-1.31000.

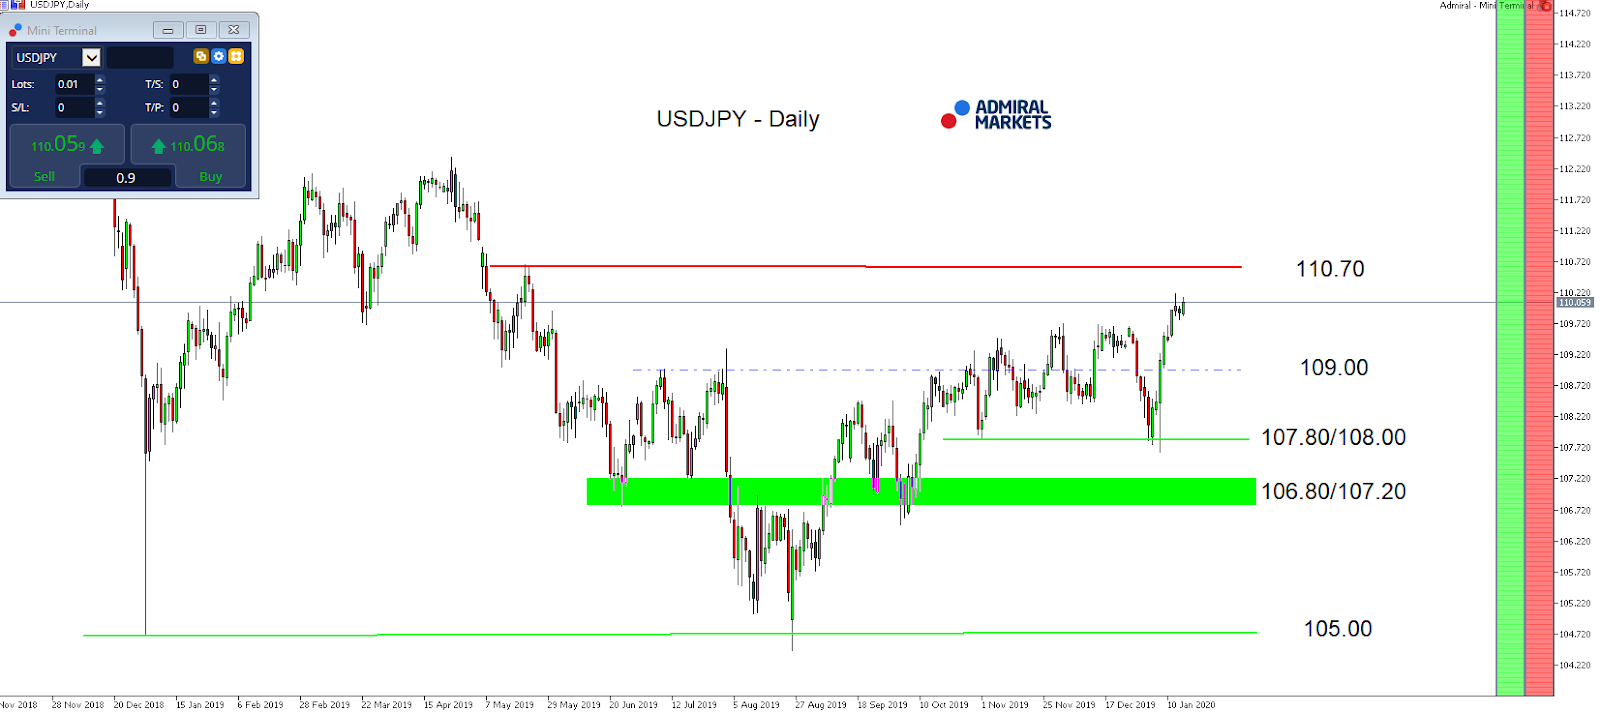
The USD/JPY currency pair

Technical indicators of the currency pair:
  • Prev Open: 109.899
  • Open: 110.138
  • % chg. over the last day: +0.27
  • Day’s range: 110.138 – 110.290
  • 52 wk range: 104.45 – 113.53

On the USD/JPY currency pair, purchases still prevail. The trading instrument has set new local highs. At present, the currency of the “safe haven” is consolidating near the resistance level of 110.300. 109.850 is the immediate support. USD/JPY quotes have the potential for correction after a long rally. We recommend that you pay attention to the dynamics of yield on US government bonds. Open positions from key levels.

The publication of important economic releases from Japan is not planned.

USD/JPY

Indicators point to the strength of buyers: the price has fixed above 50 MA and 100 MA.

The MACD histogram is in the positive zone, which signals a bullish mood.

The Stochastic Oscillator is in the neutral zone, the %K line is above the %D line, which gives a signal to buy USD/JPY.

Trading recommendations
  • Support levels: 109.850, 109.650, 109.350
  • Resistance levels: 110.300, 110.600

If the price consolidates above 110.300, expect further growth toward 110.600-110.800.

Alternatively, the quotes could correct toward 109.600-109.400.

by JustForex

The US Dollar Is in the Positive Zone After the Publication of Statistics

by JustForex

The US currency strengthened against a basket of major currencies. The dollar index (#DX) closed yesterday in the green zone (+0.11%). Optimistic data on the US economy were published yesterday, which supported the greenback. Thus, core retail sales grew by 0.7% in December, while experts expected growth only by 0.5%. Philadelphia Fed manufacturing index counted to 17.0 in January instead of 3.8. Retail sales rose by 0.3% in December, which met experts’ expectations.

Today, during the Asian trading session, optimistic economic data from China have been published. So, GDP (YoY) in the 4th quarter counted to 6.0%, which met the forecasts. Industrial production (YoY) grew by 6.9% in December instead of the forecasted growth by 5.9%.

The “black gold” prices are rising. Currently, futures for the WTI crude oil are testing the $58.60 mark per barrel. At 20:00 (GMT+2:00), U.S. Baker Hughes Total Rig Count will be published.

Market Indicators

Yesterday, there were purchases in the US stock market: #SPY (+0.83%), #DIA (+0.89%), #QQQ (+0.96%).

The 10-year US government bonds yield has risen slightly. At the moment, the indicator is at the level of 1.81-1.82%.

The Economic News Feed for 17.01.2020:
  • – Retail sales in the UK at 11:30 (GMT+2:00);
  • – Consumer price index in the Eurozone at 12:00 (GMT+2:00);
  • – Statistics on the real estate market in the US at 15:30 (GMT+2:00);
  • – JOLTS job openings in the US at 17:00 (GMT+2:00).

by JustForex

Is the USD/JPY about to close at its highest levels since last May?

By Admiral Markets

Source: Economic Events January 17, 2020 – Admiral Markets’ Forex Calendar

The Japanese Yen has continued to avoid any signs of strength over the last few days, so instead, the USD/JPY saw an upwards push above 110.00, letting the currency pair trade at its highest level since May 2019.

While we still consider the midterm to be bearish for the USD/JPY (particularly due to the fact that the Fed is to continue to flooding markets with billions in liquidity to avoid a funding crisis in the repo market), and market participants, according to the Fed Watch Tool, still expect at least one 25 basis point cut in 2020 with a likelihood of 60%, resulting in limited upside potential for the USD/JPY. So we have to admit that current market conditions are not very favourable for the JPY.

With US inflation coming in at 2.3% year-on-year for last December, the highest level since October 2018, and US Retail Sales (also known as “backbone of the US economy” adding more than 30% to the US GDP) on Thursday matching expectations, the easing potential for the Fed seems limited, leaving, in our opinion, only a broad risk-off as a potential driver lower in the USD/JPY on the table.

And recently, with the signing of the Phase-1 trade deal between the US and China on Wednesday, chances seem good that no near-term tensions between the two countries arise, market conditions should see low volatility and thus unfavourable conditions the JPY.

That said, a sustainable push above 110.00, activating 110.70 is very likely, especially as long as the USD/JPY keeps on trading above 109.50.

Source: Admiral Markets MT5 with MT5SE Add-on USD/JPY Daily chart (between November 6, 2018, to January 16, 2020). Accessed: January 16, 2020, at 10:00pm GMT – Please note: Past performance is not a reliable indicator of future results, or future performance.

In 2015, the value of the USD/JPY increased by 0.5%, in 2016, it fell by 2.8%, in 2017, it fell by 3.6%, in 2018, it fell by 2.7%, in 2019, it fell by 0.85%, meaning that after five years, it was down by 9.2%.

Discover the world’s #1 multi-asset platform

Admiral Markets offers professional traders the ability to trade with a custom, upgraded version of MetaTrader 5, allowing you to experience trading at a significantly higher, more rewarding level. Experience benefits such as the addition of the Market Heat Map, so you can compare various currency pairs to see which ones might be lucrative investments, access real-time trading data, and so much more. Click the banner below to start your FREE download of MT5 Supreme Edition!

Download MetaTrader 5 and begin trading today!

Disclaimer: The given data provides additional information regarding all analysis, estimates, prognosis, forecasts or other similar assessments or information (hereinafter “Analysis”) published on the website of Admiral Markets. Before making any investment decisions please pay close attention to the following:

  1. This is a marketing communication. The analysis is published for informative purposes only and are in no way to be construed as investment advice or recommendation. It has not been prepared in accordance with legal requirements designed to promote the independence of investment research, and that it is not subject to any prohibition on dealing ahead of the dissemination of investment research.
  2. Any investment decision is made by each client alone whereas Admiral Markets shall not be responsible for any loss or damage arising from any such decision, whether or not based on the Analysis.
  3. Each of the Analysis is prepared by an independent analyst (Jens Klatt, Professional Trader and Analyst, hereinafter “Author”) based on the Author’s personal estimations.
  4. To ensure that the interests of the clients would be protected and objectivity of the Analysis would not be damaged Admiral Markets has established relevant internal procedures for prevention and management of conflicts of interest.
  5. Whilst every reasonable effort is taken to ensure that all sources of the Analysis are reliable and that all information is presented, as much as possible, in an understandable, timely, precise and complete manner, Admiral Markets does not guarantee the accuracy or completeness of any information contained within the Analysis. The presented figures refer that refer to any past performance is not a reliable indicator of future results.
  6. The contents of the Analysis should not be construed as an express or implied promise, guarantee or implication by Admiral Markets that the client shall profit from the strategies therein or that losses in connection therewith may or shall be limited.
  7. Any kind of previous or modeled performance of financial instruments indicated within the Publication should not be construed as an express or implied promise, guarantee or implication by Admiral Markets for any future performance. The value of the financial instrument may both increase and decrease and the preservation of the asset value is not guaranteed.
  8. The projections included in the Analysis may be subject to additional fees, taxes or other charges, depending on the subject of the Publication. The price list applicable to the services provided by Admiral Markets is publicly available from the website of Admiral Markets.

Leveraged products (including contracts for difference) are speculative in nature and may result in losses or profit. Before you start trading, you should make sure that you understand all the risks.

By Admiral Markets

Platinum Breaks $1000 On Big Rally And What is Next

By TheTechnicalTraders.com

Certain precious metals, Gold, Silver, and Platinum, have shown moderate upside price trending over the past 20+ months while Rhodium and Palladium have skyrocketed higher.  These more precious metals, Rhodium and Palladium, have many industrial and consumer uses.  Rhodium is used in electronics and plating and Palladium is used in a variety of consumer products from Automobiles to Medical Devices.

Still, the rally in Rhodium (over 300%) and Palladium (over 70%) over the past 12 months has been more than impressive.  Whey are we not seeing a similar rally in Gold, Silver, and Platinum yet?

The reality is that we are seeing a similar price rally in Rhodium and Platinum as we saw in 2004~2008 – just prior to the Global Credit Crisis.  Take a look at the composite chart below.

There are few interesting components of these charts that show how precious metals reacted throughout the 1997~2000 rally and the 2005~2008 rally – both of these events set up a bubble burst reversion event.

_  Rhodium rallied extensively in 2005 through 2008 – peaking at levels near $10,000 just before the credit crisis bubble burst.

_  Palladium rallied a moderate amount in 2005 through 2007, then sold off as the bubble burst.  Then rallied to over $800 after fear set into the markets.

_  Platinum began a rally in early 2000 that propelled it to a peak in 2007 (just before the peak in the US stock market).  Since then wild price rotation and a moderate reversion to levels near $1000 have set up a massive basing pattern.

Gold, like Platinum, began an incredible upside price rally in early 2000 and continued to rally till the peak in 2010

_  Palladium, being an industrial use metal and being deployed in a variety of advanced technology, would tend to rally as demand for technology products and consumer products associated with Palladium components are in very high demand.  Much like what happened in 1998~2000.

_  Rhodium’s rally is very likely related to manufacturing and institutional demand across the globe.

_  Platinum and Gold may be set up for an incredible upside price rally should Rhodium and Palladium extend their rallies even further.

_  We find it incredibly fascinating that Rhodium rallied nearly 1000% from 2004 to 2009 – just before the peak in the global stock markets and the start of the Global Credit Crisis.

_  We also find it incredibly interesting that Palladium rallied over 1000% from 1995 to 1999 – just before the DOT COM bubble burst.

_  We believe the rallies in Rhodium and Palladium are early warning signs that can’t be overlooked by skilled traders/investors.

The recent upside breakout of Platinum falls into the same category as the late 1998 Platinum rally as the valuations of the DOT COM rally began to overextend.  We believe this shift into high-value risk protection began to take place as investor’s fear levels increased in the late 1990s.  As we suggested recently – a shifting of the undercurrents in the markets.

The current rally above $1000 in Platinum suggests a new upside price rally is taking place after an extensive basing pattern (2015 to now).  Should Platinum rally above $1200 per ounce, a new technical bullish trend will be confirmed.

Our proprietary Fibonacci price modeling system is suggesting price targets on the Weekly chart of $1090, $1130 and $1215.  Pay very close attention to this rally in Platinum as it could become the catalyst for a much bigger move in many of the major precious metals.  The Platinum rally in 1997 began an upward price advance of nearly 600% over the next 10 years.  A similar move today would put Platinum near $6000~$7000 – Gold would be near $3200+ should this happen.

Our belief is that the rally in Platinum will continue as valuations in the global markets push higher.  Fear is creeping back into the markets as investors are expecting some type of price reversion event.  We believe the current setup is very similar to a mix of the events we’ve highlighted in the composite metals chart, above.  A mix of what happened in 1995~1997 and a mix of what happened in 2005~2007.  Platinum and Gold are acting very similar to what happened in 1995~1997.  Palladium and Rhodium are a mix of 1995~1997 and 2005~2007.  Overall, the rallies in Rhodium and Palladium are strangely similar to “peak everything” bubbles.

Watch how this plays out over the next 12+ months.  Gold and Silver should begin to move higher as Platinum extends the rally.  Fear is starting to re-enter the markets as traders and investors extend their belief that a reversion event is setting up.

Join my Wealth Building Newsletter if you like what you read here and ride my coattails as I navigate these financial markets and build wealth while others lose nearly everything they own.

Chris Vermeulen
TheTechnicalTraders.com

NOTICE: Our free research does not constitute a trade recommendation or solicitation for our readers to take any action regarding this research.  It is provided for educational purposes only.  Our research team produces these research articles to share information with our followers/readers in an effort to try to keep you well informed.  Visit our web site (www.thetechnicaltraders.com) to learn how to take advantage of our members-only research and trading signals.


What To Expect From China GDP

By Orbex

Tonight we have the biggest event for Asian markets for the week – probably even for the month!

We are expecting a host of economic data from China, chief among them quarterly GDP. The Asian giant is expected to close out the year just barely within official projections.

Despite downward pressure from many factors, officially, the Chinese economy continues to grow. This could help support other far east currencies.

Following the release of a barrage of economic data, including Industrial Production and Retail Sales, the Chinese National Bureau of Statistics will host a press conference. The comments from there can also move the market.

Therefore, the Asian session can be quite volatile. Analysts will be keen to hear the latest official projections for economic growth during 2020.

What We Are Looking For

The star of the event will be, as mentioned, quarterly GDP figures. The consensus of expectations is that China’s economy grew by 1.4% in the fourth quarter.

This would be just a slight slowing of the pace from 1.5% in the third. A result like this would imply an annual GDP growth rate of 6.0%, at the very bottom of the government’s projection range.

6.0% would be slower than during the middle of the 2009 crisis, and we’d have to go all the way back to 1992 to find a growth rate that low. However, the perception seems to be focused on going forward, with a more optimistic outlook.

Still Paying Attention to Drama

The primary reason most economists give for poor growth in China is the trade conflict with the US.

With the world’s two largest economies finally, officially signing a Phase 1 agreement, the outlook has turned positive. Poor economic indicators from China are being termed “last year’s news”.

China’s currency has been strengthening since September in the lead up to the latest round of trade negotiations and following record stimulus spending by the Chinese government.

Increased purchasing power might help fuel Chinese shopping sprees. This, in turn, would support exports from Japan, Australia, and New Zealand.

So, How Good?

Despite all the fanfare regarding the potential of the Phase 1 deal, there isn’t much consensus on what it means in terms of real impact on China’s economy.

It’s a step towards normalizing trade relations between the US and China. However, it is by no means a return to the situation in early 2017, when the Chinese economy was already starting to show some slack despite no trade issues.

As the measures of the agreement are implemented, we’ll get a better view of whether optimism among investors has gotten ahead of reality. Other emerging markets might find themselves benefiting more from the climate of easing trade tensions and more risk appetite than China.

Over the next few weeks, it will be interesting to review corporate reports from Chinese firms regarding their capital investment plans.

Also, we’ll have to see whether US firms plan to ramp up purchases from China. They might communicate this in their fourth-quarter reports over the next month.

By Orbex

USD Sinks On Data Weakness

By Orbex

USD Selling Off On Data Dump

The US dollar has been a little lower over the European morning on Thursday. Following some weakness in the monthly CPI reading earlier in the week, yesterday, PPI was also lower than expected last month.

After the NFP miss last week, this latest round of data weakness has seen the dollar index pulling back further from recent highs, trading 96.91 last.

Euro Rallying

EURUSD has rallied from the European open today, boosted by weakness in USD which has seen the pair trading back up to 1.1156 last, just ahead of the 1.1166 resistance level. Today, traders will get the December ECB minutes.

The market will be paying close attention to the discussions around any further easing, with regard to how much support and division there is within the ECB camp.

GBP Higher Despite Data Weakness

GBPUSD has been a little firmer today also, taking advantage of the weakness in USD. Yesterday, December CPI came in lower than expected at 1.3% YoY vs 1.5%.

On the back of a weak December GDP reading, further weight has been given to Carney’s recent warning that the BOE might be forced to cut rates to help buffer the economy despite a Brexit deal having been reached. GBPUSD trades 1.3059 last.

SPX500 Hits New Highs

Risk assets have been higher today, boosted by the official signing of the phase-one trade deal between the US and China last night. The deal, which has been in the works since October last year, is the first step towards dismantling the trade restrictions which have been in place for two years now.

SPX500 trades 3303.63 last, having broken out to new, record highs overnight.

JPY Down, Gold Up

Safe havens have had a mixed morning so far. JPY has been lower, in light of the rally in equities. Meanwhile, gold has been higher given the weakness in USD. XAUUSD trades 1555.18 last, having rallied off the January lows. USDJPY trades 109.97, making its way back up to recent highs.

Crude Fall Ceases (For Now)

Oil prices have been flat so far today. The bullish update from the EIA yesterday reported a 2.5 million barrel drawdown in US crude stores. This has stemmed the declines in oil for now.

Crude trades 58.23 last. Crude has been under heavy selling pressure recently following the passing of risks around potential US/Iran conflict.

Loonie Lower

USDCAD has been a little weaker today given the selling in USD and the pause in crude downside. USDCAD has now fallen back below the 1.3037 level following the reversal from above the 1.3068 level earlier in the week

Aussie Trying To Climb

AUDUSD has been firmer today, benefiting from the weakness in USD. The signing of the US/China trade deal last night is a positive omen for the Aussie though, in light of the bushfires there, the market is now expecting the RBA to cut rates in February, which is keeping upside contained here. AUDUSD trades .6914 last, edging back towards .6929 resistance.

By Orbex

EIA Reports Unexpected Inventories Decrease

By Orbex

Crude Inventories Rise

The latest data from the Energy Information Administration showed an unexpected decrease in US crude stores. Over the week ending January 10th, US crude inventories were lower by 2.5 million barrels.

This inventory drawdown was in sharp contrast to the expected 500k barrel increase the market was looking for.

With this latest drawdown, US crude stores are now sitting at 428.5 million barrels, the five year average for this time of year.

Gasoline Inventories Climb

The data also showed that gasoline inventories were higher over the week.

Gasoline inventories rose by 6.7 million barrels, now sitting around 5% above the five year average for this time of year.

Distillate stockpiles, which include diesel and heating oil, were also seen higher by 8.2 million barrels. They are around 3% down on the five year average for this time of year.

Crude Imports Fall

Looking at the rest of the data, US crude imports were down by 179k barrels per day on the previous week, averaging 6.6 million barrels per day.

Over the last four weeks, crude oil imports have been down 13.1% on the same period last year, sitting also at 6.6 million barrels per day on average.

Fading US/Iran Tensions

Despite news of the drawdown in inventories, crude prices saw only limited buying. It seems for now, that crude prices are still weighed down in the wake of the reversal in tensions between the US and Iran.

Crude prices exploded higher on news of the Iranian retaliation against the US last week. However, following Trump’s restraint reaction to the event, the risk of a further escalation in hostilities has subsided.

US/China Trade Deal Impact

The US/China trade deal, signed this week in Washington, should offer some support to crude in the near term. This is especially true if the two countries can quickly make a start on the second round of negotiations.

However, given the risk that the next round of talks will take longer and possibly be more fractured than last year’s talks, it will take some visible positive momentum to drive crude prices higher in the short term.

Technical Perspective

The rally in crude has now reversed sharply and as price heads back down towards the triangle’s rising trend line, there is a risk that the break above the triangle top might prove to have been a flaws breakout, suggesting scope for a further move lower.

To the downside, the next key level is the 57 mark, with the rising trend line support coming in below. A break below there could open up the way for a run down to deeper support at the 51-level.

By Orbex

US & China Sign Phase One Deal

By Orbex

After nearly a year since President Trump started his trade war rhetoric against China, both parties have signed a deal.

The phase one of the trade deal is seen by many as a first step towards easing trade tensions between the two economic powerhouses of the world.

Equity markets charted into new highs intraday ahead of the signing of the deal.

Euro Rises on a Softer USD

The euro was recovering from the weakness earlier in the week. The gains came largely due to a weaker dollar.

Economic data from the eurozone saw the industrial production figures rising 0.2% on the month, falling below estimates. The common currency, however, brushed aside the data.

EURUSD to Move into a New Range

The currency pair is rebounding off the support area near the 1.1131 level. This is pushing the currency pair higher. However, the gains will be limited as the EURUSD will settle into the new range.

The resistance level at 1.1180 and the 1.1131 support will set the new corridor for the currency pair. A breakout from this level is needed to further confirm the direction.

UK Inflation Weaker than Forecasts

Consumer prices in the United Kingdom were tame in December. On a year over year basis, headline CPI rose just 1.3%. This was below the estimates of a 1.5% increase and down from 1.5% in November.

The pound sterling was, however, unmoved by the report.

GBPUSD Consolidating Near the Bottom

Cable is gradually rising off the lows near 1.2960. Price action is forming a higher low currently. This will potentially indicate a move to the upside as the bullish divergence is forming.

The upside target remains at the 1.3100 region, with the possibility to breakout slightly higher. However, given the fact that the lower support at 1.2960 is not tested, we could see a move lower.

Gold Prices Turn Weaker on Rising Risk Appetite

The precious metal is trading weaker on the day as the risk appetite remains in favor. Investors are bullish on the US and China trade deal. The fourth-quarter earnings report kicked off with the financial companies reporting, adding to the risk appetite.

XAUUSD Could Decline Lower in the Near Term

The precious metal is forming a hidden bearish divergence. The Stochastics indicate a higher high against a lower high in price. This supports the downside test toward the 1534 region. A breakdown below this level will indicate further declines to the 1514 support area next.

By Orbex

US Retail Sales To Recover

By Orbex

Retail sales figures for the United States, covering the month of December will be coming up today.

The data released by the Commerce Department will show how much Americans spent at retail stores over the holiday month.

In November, retail sales were weaker than forecasts, surprising to the downside. The declines came amid a pullback in discretionary spending. On a monthly basis, retail sales rose just 0.2% on the month compared to a 0.5% forecast. For December, expectations are once again to the upside.

Economists forecast that core retail sales will rise 0.5% on the month, while headline retail sales will rise 0.3% for the period.

US Retail Sales, November 2019

However, it will be interesting to watch for any revisions to November’s data. In October, retail sales were revised higher to show a 0.4% increase rather than the 0.3% increase which was initially reported.

If the retail sales data comes on top of the expectations, it will be most likely due to an increase in core sales that excludes automobiles and gasoline performing better than estimates.

While the retail sales figures will not give a direct assessment of the pace of growth in the US economy, it will at the very least point to the overall sentiment among consumers. This is because growth in the United States is driven largely by consumer demand.

So far, Fed officials remain hopeful that this demand will continue to drive growth in the US over the coming quarters. The US economy is on a weaker trend, falling from a 3% average growth rate to just close to 2%.

Thus, investors will be keen to see the data on consumer spending during the month.

Weaker Auto Sales & Wages Could Point to Slower Increase

Automobile sales are one of the important components that play a big role in the retail sales report. In December, data indicates that auto sales fell to 16.7 million units compared to 17.1 million units in November.

This translates to a 2.3% decline on a month over month basis in automobile sales. But offsetting this will be the gasoline prices. Although gasoline prices have increased, it still remains stable in the longer-term horizon.

The weaker pace of wage growth is also another factor to consider.

According to the recent payrolls report for December, wage growth rose just 2.9% on the year ending December 2019. This was a pullback from the time when wages rose above the 3% threshold.

Thus, the lower earnings could see consumers cutting back on spending.

In terms of consumer optimism, we can see that according to various surveys, optimism among consumers remains high. Although the conference board’s consumer confidence index was weaker on a month to month basis, it is still at historically high levels.

Combining the above with the fact that spending usually increases during December, we could see a broad match on the expectations. But the drag from lower auto sales will be clearly felt.

Thus, there is scope for core retail sales, which exclude gasoline and automobile sales, to outperform the headline retail sales expectations.

Following today’s report, investors will further be able to assess the impact it will have on the fourth-quarter GDP. Thus, the market reaction could be a bit more than anticipated.

At the time of writing, the average expectations are about a 2.1% growth rate for the fourth quarter of the year. But this will certainly change depending on the actual figures from retail sales.

By Orbex

Ichimoku Cloud Analysis 16.01.2020 (AUDUSD, NZDUSD, USDCAD)

Article By RoboForex.com

AUDUSD, “Australian Dollar vs US Dollar”

AUDUSD is trading at 0.6904; the instrument is moving inside Ichimoku Cloud, thus indicating a sideways tendency. The markets could indicate that the price may continue the correction, test the cloud’s upside border at 0.6915, and then resume moving downwards to reach 0.6790. Another signal to confirm further descending movement is the price’s rebounding from the resistance level. However, the scenario that implies further decline may be canceled if the price breaks the cloud’s upside border and fixes above 0.6955. In this case, the pair may continue growing towards 0.7035. After breaking the rising channel’s downside border and fixing below 0.6855, the price may resume moving downwards.

AUDUSD
Risk Warning: the result of previous trading operations do not guarantee the same results in the future

NZDUSD, “New Zealand Dollar vs US Dollar”

NZDUSD is trading at 0.6629; the instrument is moving below Ichimoku Cloud, thus indicating a descending tendency. The markets could indicate that the price may test the cloud’s downside border at 0.6635 and then resume moving downwards to reach 0.6515. Another signal to confirm further descending movement is the price’s rebounding from the descending channel’s upside border. However, the scenario that implies further decline may be canceled if the price breaks the cloud’s upside border and fixes above 0.6695. In this case, the pair may continue growing towards 0.6775.

NZDUSD
Risk Warning: the result of previous trading operations do not guarantee the same results in the future

USDCAD, “US Dollar vs Canadian Dollar”

USDCAD is trading at 1.3046; the instrument is moving above Ichimoku Cloud, thus indicating an ascending tendency. The markets could indicate that the price may test the cloud’s upside border at 1.3030 and then resume moving upwards to reach 1.3175. Another signal to confirm further ascending movement is the price’s rebounding from the support level. However, the scenario that implies further growth may be canceled if the price breaks the cloud’s downside border and fixes below 1.2995. In this case, the pair may continue falling towards 1.2905. After breaking Triangle’s upside border and fixing above 1.3090, the price may continue moving upwards.

USDCAD

Article By RoboForex.com

Attention!
Forecasts presented in this section only reflect the author’s private opinion and should not be considered as guidance for trading. RoboForex LP bears no responsibility for trading results based on trading recommendations described in these analytical reviews.