Author Archive for InvestMacro – Page 108

Demand for Greenback Is Still High

by JustForex

On Friday, the US currency strengthened against a basket of major currencies. The dollar index (#DX) closed yesterday in the green zone (+0.31%). Last week, the United States published a series of optimistic statistics on retail sales, real estate market and Philadelphia Fed manufacturing index. Demand for greenback is still high.

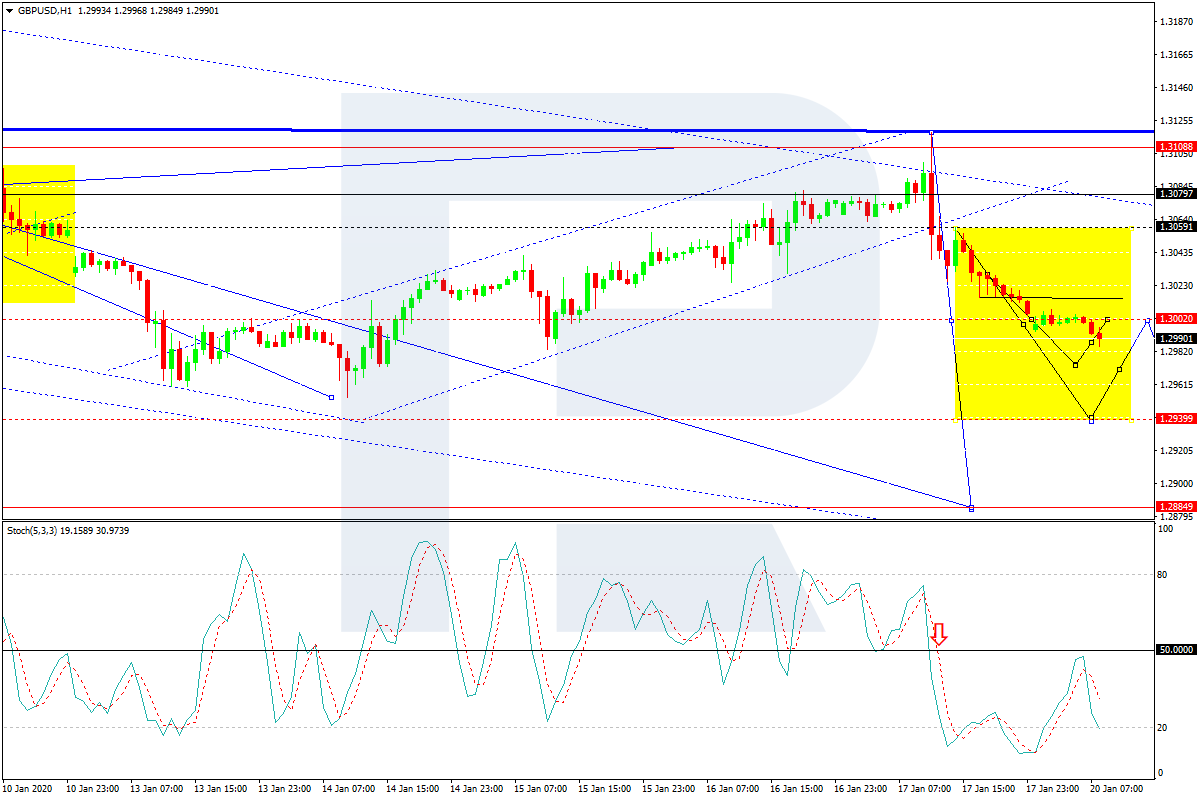
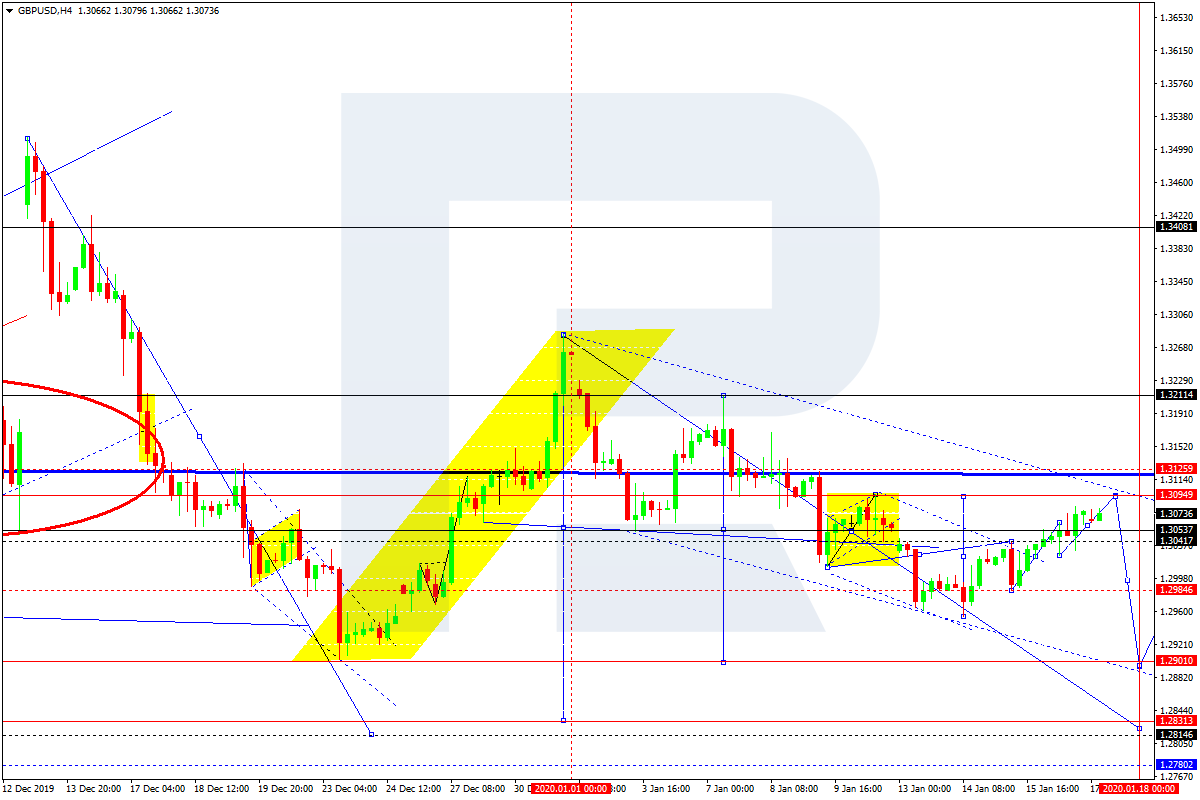
The British pound is declining due to weak economic statistics released on Friday. So, the volume of retail sales decreased by 0.6% in December, while investors forecasted growth by 0.5%. Also, the British are saddened by the news that Prince Harry and his wife Meghan decided to abandon the throne and all titles, choosing a more calm and ordinary life. The British believe that they paid taxes for nothing for so many years, which were spent to ensure the monarchs. Investors also expect up-to-date information on Brexit.

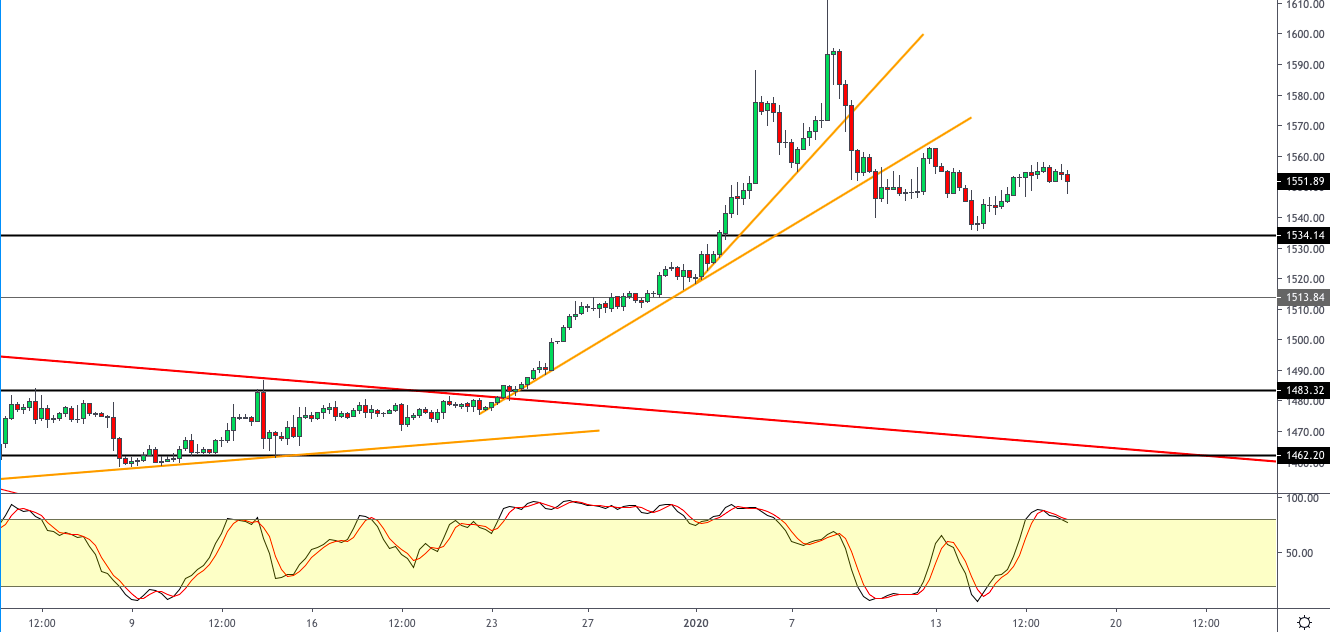
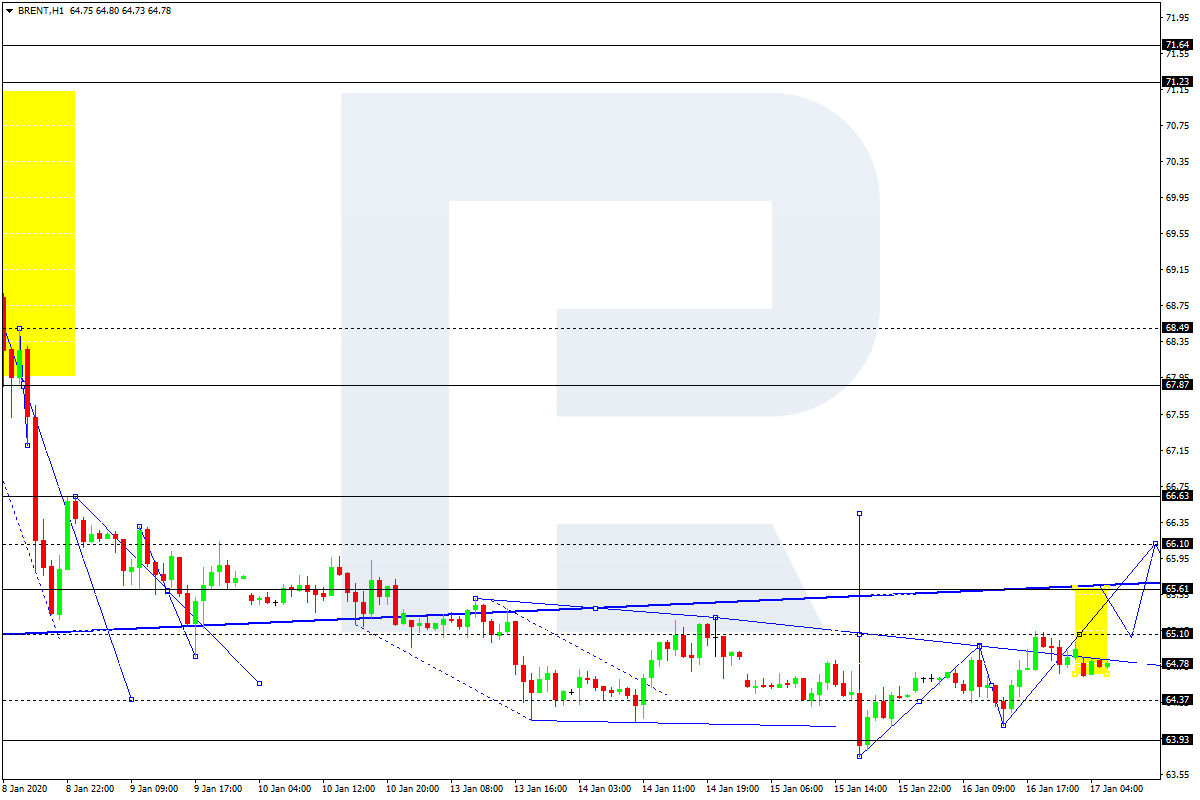
The “black gold” prices show a variety of trends. Currently, futures for the WTI crude oil are testing the $58.75 mark per barrel.

Market Indicators

On Friday, there was the bullish sentiment in the US stock market: #SPY (+0.31%), #DIA (+0.12%), #QQQ (+0.49%).

The 10-year US government bonds yield has risen slightly. At the moment, the indicator is at the level of 1.82-1.83%.

The Economic News Feed for 20.01.2020:

Today, the publication of important economic news is not expected. We recommend paying attention to the speech by the ECB President.

US financial markets are closed due to the holiday.

by JustForex

Low volatility in DAX30, but all time highs remain in sight

By Admiral Markets

Source: Economic Events 20 January 2020 – Admiral Markets’ Forex Calendar

With the US bank holiday Martin Luther King Day (for modified Trading hours, please check our trading schedule), volatility in financial markets should be expected to stay low into the start of the week.

In general, low volatility favours a drift higher, resulting in an elevated chance to see a push higher and an attack of the current DAX30 CFD all time highs around 13,600 points.

Technically, the mode on H1 stays long in the DAX30 CFD as long as we trade above 13,380/400 points.

A break above 13,600 points finds a next potential target in the region around 13,800 points and above around the psychologically relevant region around 14,000 points.

However, if the bulls fail to substantially break above 13,600 points and in the days to come, we may see another attack at the region around 13,380/40 points with a break lower, a first target on the downside could be found around 13,250/270 points.

In general, volatility shouldn’t be expected to significantly increase with the ECB rate decision on Thursday, making this bearish outlook unlikely in our opinion:

Source: Admiral Markets MT5 with MT5SE Add-on DAX30 CFD Daily chart (between 27 December 2019 to 17 January 2020). Accessed: 17 January 2020 at 10:00 PM GMT


Source: Admiral Markets MT5 with MT5SE Add-on DAX30 CFD Daily chart (between 05 October 2018 to 17 January 2020). Accessed: 17 January 2020 at 10:00 PM GMT

Please note: Past performance is not a reliable indicator of future results, or future performance.

In 2015, the value of the DAX30 CFD increased by 9.56%, in 2016 it increased by 6.87%, in 2017 it increased by 12.51%, in 2018 it fell by 18.26%, in 2019 it increased by 26.44% meaning that after five years, it was up by 34.2%.

the ultimate trading analytics portal

Disclaimer: The given data provides additional information regarding all analysis, estimates, prognosis, forecasts or other similar assessments or information (hereinafter “Analysis”) published on the website of Admiral Markets. Before making any investment decisions please pay close attention to the following:

  1. This is a marketing communication. The analysis is published for informative purposes only and are in no way to be construed as investment advice or recommendation. It has not been prepared in accordance with legal requirements designed to promote the independence of investment research, and that it is not subject to any prohibition on dealing ahead of the dissemination of investment research.
  2. Any investment decision is made by each client alone whereas Admiral Markets shall not be responsible for any loss or damage arising from any such decision, whether or not based on the Analysis.
  3. Each of the Analysis is prepared by an independent analyst (Jens Klatt, Professional Trader and Analyst, hereinafter “Author”) based on the Author’s personal estimations.
  4. To ensure that the interests of the clients would be protected and objectivity of the Analysis would not be damaged Admiral Markets has established relevant internal procedures for prevention and management of conflicts of interest.
  5. Whilst every reasonable effort is taken to ensure that all sources of the Analysis are reliable and that all information is presented, as much as possible, in an understandable, timely, precise and complete manner, Admiral Markets does not guarantee the accuracy or completeness of any information contained within the Analysis. The presented figures refer that refer to any past performance is not a reliable indicator of future results.
  6. The contents of the Analysis should not be construed as an express or implied promise, guarantee or implication by Admiral Markets that the client shall profit from the strategies therein or that losses in connection therewith may or shall be limited.
  7. Any kind of previous or modeled performance of financial instruments indicated within the Publication should not be construed as an express or implied promise, guarantee or implication by Admiral Markets for any future performance. The value of the financial instrument may both increase and decrease and the preservation of the asset value is not guaranteed.
  8. The projections included in the Analysis may be subject to additional fees, taxes or other charges, depending on the subject of the Publication. The price list applicable to the services provided by Admiral Markets is publicly available from the website of Admiral Markets.
  9. Leveraged products (including contracts for difference) are speculative in nature and may result in losses or profit. Before you start trading, you should make sure that you understand all the risks.

By Admiral Markets

EURUSD: consolidation expected due to US holidays

By Alpari.com

On Friday, January 17, the euro was down at the close of trading. The euro followed in the footsteps on the GBP, which fell heavily against the US dollar after weak retail sales figures for December were published in the UK. The data increased the likelihood that the Bank of England would decide to lower the level of basic interest rates in the country at its next meeting. The EURUSD pair fell to 1.1086. By the end of the day, the euro had fallen 0.43%, and by 0.26% across the entire week.

The American session saw continued pressure on the euro, due to the upcoming long weekend in the US.

Today’s events (GMT+3):

  • 14:00 Germany: German Buba Monthly Report.
  • 21:30 Eurozone: ECB’s President Lagarde speech.
  • National holiday in USA.

Рис. 1Current situation:

Friday’s expectations for a decrease in the EURUSD pair were fully justified, with the fall In price ended at the 67th degree. On the hourly chart, a three-wave structure has formed from 1.1172. According to the AO indicator, there is no defined end to the downward movement, and bears may attempt to set a new minimum at the 1.1086 mark.

At the time of writing, the euro is worth 1.1099. The price is hovering around the trend line at 1.1172. Given that there is a national holiday in the US, and the Stochastic Operator is in the oversold zone, it is forecast to grow to 1.1106 with a subsequent drop to 1.1089.

Most major currencies are trading in the black, and the economic calendar is scarce. A spike in volatility may be caused by the head of the ECB Christine Lagarde, who is scheduled to speak at 21:30 Moscow time. According to the forecast, we considered a weak rebound, however there could be a sharp “double bottom” – it all depends on the bulls’ activity. Crosses with the euro are all up, with the exception of EURAUD. If Monday’s price stays above 1.1086 until Tuesday, then bulls will have the opportunity to restore the price to 1.1140.

By Alpari.com

Pound Not Ready to Grow

By Dmitriy Gurkovskiy, Chief Analyst at RoboForexThe British Pound against the USD is starting another January week under pressure: the pair is trading below 1.3000.

The Pound’s major problem right now is the anticipation of the Brexit. Everything is ready and the United Kingdom may start the procedure of exiting the European Union at any moment before January 31st. however, London decided to wait for the exact date.

The statistics published last week showed that the Retail Sales in the United Kingdom lost 0.6% m/m in December after reducing by 0.8% in the previous month. Consumers can’t or don’t want to increase their expenses before the country starts the exiting procedure. It’s another signal that the country’s economy is looking pretty weak and the Bank of England may have to decide on helping it much earlier than the regulator planned based on its conservative approach.

This week, there will be some interesting numbers on the British labor market in November. Most likely, the Average Earnings Index hasn’t increased since November 2019 and that’s bad news for the Pound.

As we can see in the H4 chart, GBP/USD is moving downwards; it is forming the fifth wave with the target at 1.2885. Possibly, today the pair may consolidate around 1.3000. Later, the market may break this range to the downside and then continue falling to reach the above-mentioned target. After that, the instrument may form a new ascending structure towards 1.3100. From the technical point of view, this scenario is confirmed by MACD Oscillator: its signal line is moving downwards. After the line breaks 0, the price may boost its decline.

In the H1 chart, GBP/USD is forming another descending wave towards 1.2930. After reaching it, the instrument may start a new correction to return to 1.3000 and then resume trading downwards with the target at 1.2885. Later, the market may form one more structure to the upside to reach 1.3050. From the technical point of view, this scenario is confirmed by Stochastic Oscillator: its signal line is moving below 50, thus indicating a strong descending tendency.

Disclaimer

Any predictions contained herein are based on the authors’ particular opinion. This analysis shall not be treated as trading advice. RoboForex shall not be held liable for the results of the trades arising from relying upon trading recommendations and reviews contained herein.


How Long Can A Forex Trade Stay Open?

By Orbex

As a general rule, there is no limit to how long you can keep a trade open.

Some brokers might put limits, but any reputable Forex brokers won’t. As long as there is a market, theoretically, you could keep your trade open forever.

Now, just because you can, it doesn’t necessarily mean it’s a good idea.

Especially for most FX traders who are in the market to make money off of changes in value in different currencies.

You don’t “cash in” until you close a trade, so at some point, you’re going to have to do that in order to make money.

Is There a Reason to Keep Trades Open for a Long Time?

Yes. Well, there was, but with interest rates around the world going to near zero, the motivation has virtually vanished for most retail FX traders.

With larger interest spreads, some traders would engage in carry trading as a form of making a profit from their account.

How this works is depending on the interest rates of the currencies being traded, you can be paid a “rollover” interest on your margin.

If the interest rate differential is big enough, and the currency is relatively stable, you can make a steady income from the trade. So, those carry FX traders would keep their positions open for extended periods of time, up to years.

Speaking Practically Today?

Unless you are into carry trading, there isn’t much practical reason to keep a trade open for really long periods of time.

You’re generally looking to get a profit from a move in the Forex market, and once that move has completed, you’re going to close the trade.

That can take different amounts of time depending on your trading style:

  • Scalpers
    Generally, scalpers are looking to get a few pips out of short moves in the markets. They trade on time frames generally below M15. Usually, they won’t hold a trade for more than an hour or two at most.
  • Day Traders
    Typically, day traders are looking at capitalizing on a technical trend. They will generally cluster around the M30-H4 time frame charts. They’ll also usually complete their trades within a day (hence the name, day trader), often within a single “session” of up to six-ish hours.
  • Swing Traders
    These FX traders are looking to ride a trend, more often it’s a fundamental move. Usually, they stick to H4-M1 time frame charts and can be in a trade for a few days to a few months. Rarely a trend will last over a year, so it’s not common, but swing traders to on occasion have year-long trades.

Of course, depending on your style, you likely won’t fit neatly into one of those boxes.

Some FX traders have multiple styles, for example opening the occasional swing trade while being generally focused on day trading.

Opportunity Cost

The thing is, when you open a trade, you’re putting a certain amount of your capital in the market, which means you can’t use it for other trades. As a matter of capital efficiency, you don’t want to keep your trades open for longer than strictly necessary. The longer the trade is open, the more it is exposed to risk as well.

In the end, while brokers and the market don’t put any artificial limits on how long you keep your trade open, they aren’t really necessary because the practical needs of Forex traders mean almost all trades close as quickly as possible.

By Orbex

Metals Sink Lower As USD Rallies

By Orbex

Gold

The yellow metal ended the week lower ultimately as the US dollar managed to rebound on stronger than expected data late in the week.

Gold had initially been higher on the week as the USD came under pressure following weaker than expected CPI readings for December.

However, on Thursday, both Retail Sales and the Philly Fed Manufacturing index surprised to the upside. Retail sales printed 0.7% MoM, far above the expected 0.3% reading. The Philly Fed read printed a solid 17 against an expected 3.7.

The data fuelled a sharp reversal in USD sentiment, which saw a diminished demand for gold. This, in turn, eroded the yellow metal’s weekly gains.

Gold demand was also weighed on over the week by the rise in equities prices. The markets cheered the signing of the US/China trade deal, with the SPX500 trading into fresh, record highs.

The support from the deal will not be permanent, however. To keep equities bid, traders will need to see solid steps in the second phase of negotiations.

Technical Perspective

Gold prices are still fighting it out around the 1554.69 2019 highs. The rejection from 1608.54 has not yet seen proper follow-through and if price can hold above the broken 2019 highs, focus will be on a further push higher within the broad bullish channel which has framed price action over the last year. Only a break back below the 1522.75 level will alter this view.

Silver

Silver prices tracked the moves in gold and moved lower over the week as the boost to risk appetite from the signing of the US/China trade deal, as well as a resurgent USD, weighed on silver.

Its been a volatile few weeks for metals, which had initially been far higher on the year in response to the breakout of fresh hostilities between the US and Iran.

However, with that situation cooled down, for now, metals have seen reduced safe-haven demand as focus turns back to the relentless rise in equities.

Technical Perspective

It continues to be a tale of two trend lines in silver. The breakout above the first bearish trend line was then capped by two tests of the longer-term bearish trend line.

However, price is still holding above the 17.3408 level and while above here, a further test of the 18.6397 level is still viable. To the downside, a break of 17.3408 would pave the way for a test of the 16.52 level next.

By Orbex

Risk Appetite Remains High On Trade Deal & US Data

By Orbex

Equities continue to remain poised to the upside due to a number of factors.

The US-China trade deal brought a modest reaction. Investors expect that there is still a lot to do.

Economic data from the US saw retail sales beating estimates breathing life into the US dollar.

Euro Slips on Stronger US Retail Sales

The euro gave up the gains from earlier this week. Retail sales in the United States beat estimates, rising 0.7% on the core in December.

Headline retail sales were in line with estimates of a 0.3% increase on the month. The data pointed to a solid close for the year.

EURUSD Gives Up Gains, but Momentum is Weak

The common currency continues to drift as prices retreat, giving up the gains from the previous session. The overall price action is suggesting to a potential bearish flag pattern on the daily chart. This means that a break down off the 1.1100 region could signal further declines on the horizon.

Sterling Rises as Weaker Inflation Lowers Odds of a Rate Cut

The pound sterling is trading stronger against the US dollar. This comes as investors are betting on a potential rate cut from the BoE as early as January. The interest rate decision will come ahead of flash PMIs. Earlier this week, inflation data saw a decline which eases pressure on the BoE in some way.

GBPUSD Maintains a Corrective Rally For Now

The currency pair rebounded off the support as noted previously. The current gains remain in place as GBPUSD remains on track to retest the 1.3100 level. If resistance is established, we expect prices to remain range-bound. But a lot will depend on the fundamentals, especially closer to the BoE meeting.

Gold Prices Remain Soft Amid Global Narratives

The precious metal is trading on the backfoot on Thursday. The declines came as gold gave a muted response to the China trade deal. The stronger USD managed to put some pressure on the precious metal. However, gold prices are staying resilient despite a broad build-up in risk appetite.

Will XAUUSD Decline Further?

Although the bias remains to the downside, XAUUSD is staying somewhat stronger. The hidden bearish divergence remains in play for the moment. But if prices continue to drift, we could expect the upside bias to build up. For the moment, the downside target remains at the support level of 1534.00. But a breakout above 1558 will, of course, change the view.

By Orbex

GDP Crushed By Data Miss

By Orbex

USD Riding High

The US dollar is ending the week on a much better note than it started. Stronger than expected data yesterday (retail sales & Philly Fed both better beat) has helped lift the dollar into the end of the week. USD index trades 97.13 last.

Euro Lower on USD Rally

EURUSD has been lower over the final European morning on the week, weighed on by the recovery in USD. Yesterday, the release of the ECB December minutes showed a more optimistic tone. Policymakers were far less divided than in recent meetings and sounded more optimistic over the outlook for the Eurozone economy. Despite the better tone, EURUSD trades 1.1189 last.

GBP Down on Data Miss

GBPUSD has been sharply lower today as retail sales for December were bitterly disappointing at -0.6% vs an expected 0.5% reading. This is the latest in a string of weak data points for the UK with GDP and inflation all missing this week also. The market is now increasing its expectations of a forthcoming BOE rate cut, weighing on GBP. GBPUSD trades 1.3060 last.

SPX500 Hits New Highs

Risk assets have been well supported across the week and are ending higher on Friday with the SPX500 trading into new highs at 3325.78 last. The signing of the US/China trade deal has been a big boost for risk appetite over the week with the market now hopeful that talks can progress quickly onto a phase two deal. Another week passing without any further US/Iran tension has also been welcomed by traders.

JPY & Gold Lower

Safe havens have been weaker so far today with both JPY and gold lower against USD. The rally in equities along with the recovery in USD late in the week has put pressure on both. XAUUSD trades 1554.37 last, just below the 1554.69 level. USDJPY trades 110.17 last, having broken out above recent highs.

Crude Rallies On Inventories Draw

Oil prices have been higher on Friday, taking crude back up to even on the week, as of writing. The EIA this week reported an unexpected 2.5 million barrel drawdown which helped lift prices. The signing of the US/China trade deal has also offered support and is expected to provide a buffer in the near term despite the large bearish weekly candle posted last week.

Loonie Looking Good

USDCAD has been a little higher today with the rally in USD helping lift the pair, despite the rally in crude. CAD has been under pressure recently given the heavy sell-off in crude last week. Next week the BOC will meet though no rate cut is expected.

Aussie Flat on Friday

AUDUSD has been a little weaker over the European morning on Friday though has, at least, recovered most initial losses. The rally in USD has stemmed upside in the pair which came on the back of a solid Chinese industrial production reading overnight. AUDUSD trades .6903 last.

By Orbex

Forex Technical Analysis & Forecast 17.01.2020 (EURUSD, GBPUSD, USDCHF, USDJPY, AUDUSD, USDRUB, USDCAD, GOLD, BRENT, BTCUSD)

Article By RoboForex.com

EURUSD, “Euro vs US Dollar”

EURUSD has reached 1.1171; right now, it is forming a new descending wave towards 1.1113. Later, the market may start another growth with the target at 1.1190.

EURUSD
Risk Warning: the result of previous trading operations do not guarantee the same results in the future

GBPUSD, “Great Britain Pound vs US Dollar”

GBPUSD is moving upwards. Possibly, the pair may reach 1.3094 and then form a new descending structure to break 1.2985 and then continue trading inside the downtrend reach the short-term target at 1.2901.

GBPUSD
Risk Warning: the result of previous trading operations do not guarantee the same results in the future

USDCHF, “US Dollar vs Swiss Franc”

USDCHF is forming the first ascending impulse towards 0.9665. After that, the instrument may correct to reach 0.9638 and then start a new growth with the target at 0.9687.

USDCHF
Risk Warning: the result of previous trading operations do not guarantee the same results in the future

USDJPY, “US Dollar vs Japanese Yen”

After forming the consolidation range, USDJPY has broken it to the upside at 109.99. According to the main scenario, the price is expected to extend the wave up to 110.25 and then resume trading downwards with the target at 109.98. Later, the market may form one more ascending structure towards 110.53.

USDJPY
Risk Warning: the result of previous trading operations do not guarantee the same results in the future

AUDUSD, “Australian Dollar vs US Dollar”

After completing the ascending wave at 0.6930, AUDUSD has finished the correction towards 0.6884, thus forming a new consolidation range. If later the price breaks this range to the upside, the market may resume moving upwards to reach 0.6990; it to the downside – continue the correction towards 0.6803.

AUDUSD
Risk Warning: the result of previous trading operations do not guarantee the same results in the future

USDRUB, “US Dollar vs Russian Ruble”

USDRUB continues consolidating around 61.50. Possibly, the pair may break it upwards to reach 61.94. Later, the market may resume trading inside the downtrend with the target at 60.70.

USDRUB
Risk Warning: the result of previous trading operations do not guarantee the same results in the future

USDCAD, “US Dollar vs Canadian Dollar”

USDCAD is moving upwards. Today, the pair may break the range to the upside and reach the target at 1.3069. After that, the instrument may resume falling with the target at 1.3055 and then form one more ascending structure towards 1.3082.

USDCAD
Risk Warning: the result of previous trading operations do not guarantee the same results in the future

XAUUSD, “Gold vs US Dollar”

Gold is consolidating around 1553.43. Possibly, today the pair may reach 1559.00 and then resume trading inside the downtrend to return to 1553.43.

GOLD
Risk Warning: the result of previous trading operations do not guarantee the same results in the future

BRENT

Brent is moving upwards to reach 65.27. Later, the market may start a new correction towards 64.50 and then resume trading inside the uptrend with the short-term target at 66.10.

BRENT
Risk Warning: the result of previous trading operations do not guarantee the same results in the future

BTCUSD, “Bitcoin vs US Dollar”

BTCUSD is still consolidating at the top. Possibly, today the pair may break the range upwards to reach 8856.00 and then start a new correction towards 8448.00. After that, the instrument may form one more ascending structure with the target at 8952.00.

BTCUSD

Article By RoboForex.com

Attention!
Forecasts presented in this section only reflect the author’s private opinion and should not be considered as guidance for trading. RoboForex LP bears no responsibility for trading results based on trading recommendations described in these analytical reviews.

Fibonacci Retracements Analysis 17.01.2020 (BITCOIN, ETHEREUM)

Article By RoboForex.com

BTCUSD, “Bitcoin vs US Dollar”

As we can see in the daily chart, BTCUSD continues the correctional uptrend; it has already fixed above the mid-term resistance at 50.0% fibo (8500.00) and may continue towards 38.2% fibo at 9765.00. the current movement may be considered as a new rising impulse to reach the high. However, the price won’t probably start a long rising movement as long as the instrument hasn’t broken the current target level.

BTCUSD_D1
Risk Warning: the result of previous trading operations do not guarantee the same results in the future

The H4 chart shows more detailed structure of the current ascending tendency. The pair is trading towards 38.2% fibo at 9262.00 and may later even reach 50.0% fibo at 10142.00. At the same time, there is a divergence on MACD, which may indicate a new pullback after the price reaches its target. The support is still the low at 6430.30.

BITCOIN_H4
Risk Warning: the result of previous trading operations do not guarantee the same results in the future

ETHUSD, “Ethereum vs. US Dollar”

As we can see in the daily chart, after reaching 76.0% fibo, ETHUSD has correcting quite fast. After the convergence on MACD, the pair is moving to test 61.8% fibo at 189.00.

ETHUSD_D1
Risk Warning: the result of previous trading operations do not guarantee the same results in the future

The H4 chart shows more detailed structure of the current correction. The pair is moving very close to 23.6% fibo at 174.30 and may continue growing towards 38.2% fibo at 210.20. The support is the low at 116.06.

ETHUSD_H4

Article By RoboForex.com

Attention!
Forecasts presented in this section only reflect the author’s private opinion and should not be considered as guidance for trading. RoboForex LP bears no responsibility for trading results based on trading recommendations described in these analytical reviews.