Author Archive for InvestMacro – Page 107

EURUSD: bulls aiming to gain momentum

By Alpari.com

On Monday, January 20, the euro ended the day’s trading with an increase of 0.06%. In a thin market, the price went down to 1.1077, before returning back to 1.1098. Market activity was low due to the long weekend in the United States.

Today’s events (GMT+3):

  • 12:30 UK – ILO Unemployment Rate (3M) (Nov), Claimant Count Change (Dec).
  • 13:00 Eurozone & Germany: ZEW Survey – Economic Sentiment (Jan)
  • 16:30 Canada: Manufacturing Sales (MoM) (Nov).
  • 18:20 NZD: GDT Price Index (GlobalDairyTrade).

Рис. 1Current situation:

In Asian trading, the price approached the balance line. Major currencies show mixed dynamics. Protective assets are trading in the black, the rest are in the red. Today’s increased demand for protective assets has prevented us from making a forecast.

A support was formed at the 1.1085 level. After yesterday’s rebound, a reversal pattern appeared. For a reversal to occur, a breakthrough through at 1.110  is necessary. According to our estimates, customer activity should begin to increase after 13:00 (Moscow time). Since the trend line was broken, according to the forecast, we are waiting for recovery to 45th degree – 1.1129. We do not forecast much higher growth now, in light of Thursday’s planned ECB meeting and its head Christine Lagarde’s press conference. She will not be delighted with the strengthening of the euro.

We also look at the dynamics of the EURGBP pair. The British currency is under pressure due to growing expectations that the Bank of England will lower the basic interest rate. The cross will support buyers of the euro.

By Alpari.com

Q4 Earnings Setup The Rally To The Peak

By TheTechnicalTraders.com

Our research team believes the current Q4-2019 earnings season and expectations are prompting a “Rally To A Peak”.  We’ve been warning our followers and clients that we believe the US Stock Market has rallied to levels that constitute a “near peak enthusiasm” related to historical price volatility.

As you’ll see from these charts, below, we are not dismissing this current upside rally and the potential that it could last for many weeks or months longer – we’re just warning our followers and clients that we believe a very volatile period or price rotation is setting up within the next 10 to 25+ days as prices reach the historical upper boundary.

Our researchers believe that price channels are a very common form of technical analysis.  Price enters a channel when defined boundaries are established and when price continues to rotate within these boundaries.  Historically, when a price channel is broken or breached, a new price channel is quickly established.  You’ll see examples of this very clearly in the Custom US Stock Market Index and Custom Volatility charts below.

Within this research post, we want to highlight the rally levels across a number of our Custom Index charts because we believe the current US stock market rally is nearing a “peaking level/process” that may surprise many investors.  Even though the current price trend may be quite stable to the upside, price tends to rotate in up and down price cycles throughout shorter and longer-term trends.  We have termed this “true price exploration”.  It is the basis of the Elliot Wave theory and Fibonacci price theory.  The price must always attempt to establish new price highs or new price lows – at all times.

Put in more simple terms, the price will always rotate up and down within a trend – it will never go straight up or straight down.  There must be some rotation in price as support and resistance levels are established while true price exploration is taking place.  This process is the reason that we believe the global markets are setting up for a moderate price rotation/reversion in the near future.

This first chart, our Custom US Stock Market Index Weekly chart, highlights the recent upside price breakout that took place late in 2019.  We believe this rally is the result of a continued Capital Shift into the US stock market by foreign investors as well as continued fundamental economic data as a result of President Trump’s tax and deregulation policies.  The US/China trade deal, beginning to settle in November 2019, was also very good news for the markets overall.  As technical investors, these massive global concerns or positive events play a big role in understanding how the price will bias as it digests these positive or negative events.

The one aspect of this Custom US Stock Market Index chart we want to focus everyone onto is the Price Channel that we’ve drawn across the peaks and troughs of price over the past 2+ years.  The downside price rotation late in 2019 setup a defined price channel that we believe will act as critical price resistance in the very near future.  Should this price rally continue for another 2+ weeks, the price will very likely reach this resistance level – then what?

The current upside price rally technically confirms that price has already established a “new price high” and if this resistance level is a strong as we believe, based on the historical price channel structure, it may prompt a moderately large price correction/reversion event.  Once price rallies to near the upper price boundary, there is a very strong likelihood that price will experience hard resistance.  A potential rotation in price could prompt a move below 880 – the middle price channel level.

Our Custom Valuation Index Weekly chart highlights the amount of capital pouring into the markets and the fact that global investors continue to believe the upside price rally in the US stock market is likely to continue.  The past FLAG formation, from September 2019 till near November 2019, suggested that global investors were quite concerned about future valuation growth.  It would appear that global investors began to become very cautious in September 2019 – then started pouring capital back into the markets in late November/early December 2019.  It was likely foreign investors that began pouring capital into the US markets at that time.

Either way, the advance in the price of our Custom Valuation Index suggests that global investors believe the US stock market is, again, in rally mode into early 2020 and through Q4 2019 Earnings.

Now for the kicker. Our Custom Volatility Weekly chart is back into extreme overbought territory.  This indicator can stay in this range as price advances for many weeks – like what happened in late 2018.  Over the past 24+ months, every time the Volatility Index moved up into these extreme overbought levels, a moderate to severe price rotation/reversion took place.  This is important to understand for all traders.

Price could attempt to stay up in this overbought level for many weeks or months – yet the risk of a price correction/reversion would only gain strength the longer the Volatility Index stays above 19.  Be prepared for increased volatility over the next 60+ days and be prepared for a potential price reversion.  Our researchers believe we are very close to critical price resistance and an explosion in volatility.

As skilled technical traders, this is exactly what we want to see happen.  We want to be able to find and identify profitable price trends, prepare for price corrections and attempt to time our entries into various ETFs and sectors to be able to profit from these bigger swings.  As the rally continues to push higher, pay attention to the earnings data that is release and expect volatility to begin to move higher.  We believe a number of earning surprises are going to hit the markets.  These could prompt some 2% or greater price swings in the US markets.

This is the year you really want to find the right team to help you identify and trade these bigger trends.  Don’t let 2020 pass you by while these incredible setups continue to roll into bigger market trends.  Visit TheTechnicalTraders.com to learn how we can help you find and execute better trades.

Join my Wealth Building Newsletter if you like what you read here and ride my coattails as I navigate these financial markets and build wealth while others lose nearly everything they own.

Chris Vermeulen
TheTechnicalTraders.com

NOTICE: Our free research does not constitute a trade recommendation or solicitation for our readers to take any action regarding this research.  It is provided for educational purposes only.  Our research team produces these research articles to share information with our followers/readers in an effort to try to keep you well informed.  Visit our web site (www.thetechnicaltraders.com) to learn how to take advantage of our members-only research and trading signals.


Busy Tuesday: BOJ, UK Claimant Count & German ZEW

By Orbex

Tomorrow we have a host of important data coming out, primarily during the European session. And it could really rile up the markets!

Somewhat ironically, the most important data, the BOJ Interest Rate decision, might not be as market moving as the others, such as UK Claimant Count and German ZEW Economic Sentiment Indicator.

After a relatively calm weekend in regards to market-moving news, attention is on a very busy schedule.

The fourth-quarter earnings season is getting into full swing this week! Analysts continue to point to weak economic data from the UK, while others see the ECB having a more positive outlook following the leadership change.

What We Are Looking For

First up in the really early morning for European traders we have the Interest Rate decision by the BOJ. Expectations pretty much assure that the bank will leave rates where they are. Where we could get some action is right after the announcement, as we have Kuroda’s interminable press conference.

There is a growing consensus that negative rates have not boosted the economy or inflation. This is leading a majority of economists to predict that the BOJ will soon end its stimulus.

The question is what “soon” means. Speculation now is whether Kuroda will lift the BOJ’s growth outlook, which could provide some support for the JPY.

During early trading, longer-term bond yields rose in anticipation.

UK Might Reverse Trend

The next major event to look out for is UK employment data for December. Of course, there could be an impact from the General Election at the beginning of the month with the concurrent uncertainty. So, the market may not take a miss of expectations too badly.

Usually, the figure that moves the market is Claimant Count Change. Projections expect this to come in at 21.2K, an improvement from 28.8K in November.

Expectations are for yet another improvement with the unemployment rate to come in at 3.7% compared to 3.8% prior. In terms of inflation implications and BOE policy, total pay is expected to have increased by 3.4% compared to 3.2% in the prior report.

If expectations are met, we could see some more optimism for the pound, since it would justify the BOE keeping from cutting rates just a little bit longer.

Germany Not So Optimistic

Finally, we have the ZEW Economic Sentiment Indicator. We can expect this to dip back to 4.3.

A result like this would still be in expansion, but it would be a break from the rising trend that it’s been having since the middle of last year.

This might simply be a correction, of course, since the change isn’t all that big. The current situation is expected to improve but still remain in contraction, to -12.4 compared to -19.9 prior.

By Orbex

Trump Impeachment Trial Underway

By Orbex

This probably isn’t the start to the year (or decade for that matter) that Donald Trump had in mind.

Last week, the US House of Representatives voted in favor of sending articles of impeachment to the Senate for a trial next week.

The motion passed by 228 votes to 193. House Speaker Nancy Pelosi signed the articles of impeachment alongside Democratic lawmakers who will lead the prosecution against Trump.

Making History

Speaking at a press conference ahead of the document signing, Pelosi told reporters:

“Today we will make history. When the managers walk down the hall, we will cross a threshold in history – delivering articles of impeachment against the president of the United States for abuse of power and obstruction of the House.”

Trail To Begin on Tuesday

The trial will begin this Tuesday. Given that the Senate is controlled by Trump’s Republican party, it is unlikely that the Senate will vote to convict Trump and remove him from office.

However, the damage to his reputation might strike a decisive blow to Trump’s chances of re-election at the upcoming presidential elections in November.

Trump’s 2020 Chances in Question

Trump’s chances of re-election have been in the news for other reasons this week.

Lev Parnas, the businessman embroiled in the Ukranian situation at the heart of Trump’s impeachment scandal, along with Trump’s personal attorney Rudy Giuliani, made controversial comments about the issue this week.

Parnas Comments Anger Trump

Speaking with CNN, Parnas told reporters that Trump’s motivations for attempting to discredit political rival Joe Biden were not due to his concerns over political corruption in Ukraine but instead, “were all about 2020.”

Parnas told reporters:

“That was the most important thing, for him to stay on for four years and keep the fight going. I mean, there was no other reason for doing it.”

However, ahead of the official arguments which begin on Tuesday, Trump has already vehemently argued that he does not know who Parnas in. This is despite the existence of a stream of pictures of the two men together.

In response, Trump has stated that while he might have taken a photo with him, he has no knowledge of who he is and has certainly never been in contact with him regarding any request for help.

Conviction Unlikely

The impeachment trial certainly takes the shine off Trump’s trade deal with China, which was signed in Washington last week. Again, while conviction and removal from office are unlikely for Trump, the key here will be the impact on his 2020 campaign.

Technical Perspective

The US Dollar index has posted a firm recovery off the 96.37 level. It is now testing the 97.42 resistance, in the middle of the bearish channel from 2019 highs.

Above here, the channel top is the next resistance, ahead of the 98.25 level.

By Orbex


China GDP Keeps Global Sentiment Buoyed

By Orbex

China’s GDP for the year 2019 grew at a pace of 6.1%, according to data released last Friday. Although the pace of GDP growth remains slow, it was within the GDP target of 6.0% – 6.5% for the year.

Global equity markets maintained the gains from earlier in the week after the data. Despite being the slowest pace of growth in 29 years, investors expect to see it pick up following the Phase One trade deal between Washington and Beijing.

Eurozone Inflation Picks Up in December

The final inflation figures for the eurozone showed consumer prices rising 1.3% annually in December 2019. The core CPI, which excludes food and energy prices, grew by 1.3% as well. The data was in line with the flash estimates and shows a rebound in consumer prices.

EURUSD Slips Down to Support

The euro was down by over 0.40% on Friday. The declines accelerated after a failure to build upon the consolidation near the 1.1131 level of support/resistance.

Price action fell to the 1.1100 level and could dip lower to 1.1072. With the Stochastics now back into the oversold level, there is a slight chance of consolidation within the range.

UK Retail Sales Surprisingly Lower in December

The monthly retail sales report for the United Kingdom saw sales in terms of volume falling 0.6% on the month. This marks the third consecutive month of decline in the data.

Retail sales in November were revised down from 0.6% to 0.8%. The pound sterling fell sharply on the news, losing over 0.5% on the day.

Is GBPUSD Resuming the Downtrend?

The declines in the GBPUSD came right after price tested the 1.3100 level of resistance. With prices being promptly rejected, the pound sterling reversed direction.

There is scope for the downtrend to continue which could see GBPUSD falling back to the 1.2960 level of support.

Gold Chalks Modest Gains

The precious metal was up 0.35% into Friday’s close, reversing the losses from the previous session. Price action in gold remains flat compared to the strong moves made in late December 2019. The consolidation in gold suggests that investors remain unsure of the direction of the precious metal for the moment.

XAUUSD is Forming an Ascending Triangle

After easing back from a seven-year high, gold prices are trading flat with the resistance level at 1562.40. The ascending triangle forming near this level could suggest further upside in gold if the resistance level breaks.

The minimum upside target is seen at 1580 if successful. Otherwise, we expect gold to slip back to test the lower support at 1534.14.

By Orbex


Living Dangerously at Volcano Taal’s Shadow: New Geological and Weather Risks in the Horizon

By Dan Steinbock – The Philippine Taal eruption may reflect new risks. With accelerating climate change, more frequent eruptions could prove likely over time, while the US exit from the Paris Agreement will accelerate climate risks in the coming years.

On January 12, my wife and I were walking around Malate, close to Manila Bay. It was a beautiful, warm and sleepy Sunday afternoon. Little did we know about the turmoil that was bursting only 50 kilometers to the south in the proximity of Taal volcano, which is located on Luzon island in the province of Batangas.

After two stronger explosions, far worse followed in early evening as a continuous eruption generated a huge 10-15 kilometers high steam-laden tephra column with frequent volcanic lightning that rained wet ashfall as far as Metro Manila.

In addition to the danger zone of almost half a million people, 25 million people live within 100 km of the volcano. The Alert Level 4 remains effective in the region, indicating that “a hazardous explosive eruption is possible within hours to days.”

Taal may precipitate new kinds of risks.

“Geological” and “weather-related” events

According to the Global Climate Risk Index 2020, long-term climate risk is relatively highest in Puerto Rico, Myanmar, Haiti and the Philippines, which have been identified as the most affected countries in the past two decades. The ranking is based only on weather-related events – storms, floods as well as temperature extremes and mass movements (heat and cold waves etc.). It does not include “geological incidents,” like earthquakes, volcanic eruptions or tsunamis, which are not considered “relevant” for the purpose.

Intriguingly, in the past month alone, such geological incidents have hit several countries that top the list of weather-related events. Earthquakes registering a magnitude of 4.3 to 6.4 have shaken Puerto Rico, Myanmar, Pakistan, Nepal and Dominica, while the Philippines has also coped with Taal’s eruption.

Countries Most Affected by Recent earthquakes/Volcanic Activity

Long-Term Climate Risk Magnitude Date

  1. Puerto Rico 6.4 Jan 7    2020
  2. Myanmar 4.3 Jan 14 2020
  3. Haiti 3.1 Dec 18 2019
  4. Philippines 4.6 Jan 17 2020
  5. Pakistan 4.8 Jan 18 2020
  6. Vietnam 4.8 Nov 27 2019
  7. Bangladesh 4.3 Sep 3 2019
  8. Thailand 4.5 Nov 29 2019
  9. Nepal    4.2 Jan 12 2020
  10. Dominica 3.3 Jan 13 2020

Sources: Long-term climate risk: 1999-2018, Global Climate Risk Index 2020; Recent earthquakes: Earthquake Report.

Of course, correlation does not mean causation. But what does it mean?

Countries that are most affected by climate change are quite familiar with geological events as well. Last December, after 15 years of recovery, the catastrophic Aceh tsunami and earthquake, which affected 14 countries and caused 280,000 lives, marked its 15th anniversary. A day after the Taal eruption, Haiti marked its 10-year anniversary of the 2010 earthquake, which killed 300,000 people.

While climate skeptics tend to understate the association between geological and weather-related events, climate alarmists overstate the correlation. The emerging scientific view may prove more nuanced, however.

Geosphere and climate change

Recently, the number of those who do see “some kind” of correlation between climate change and volcanic activity has been on the rise. One of them is emeritus professor Bill McGuire in geophysical and climate hazards at University of California in Los Angeles (UCLA). In 2012, McGuire published Waking the Giant. As its subtitle suggests, he argues that, in the complicated Earth-system, a changing climate may “trigger earthquakes, tsunamis and volcanoes.”

A warmer atmosphere may promote greater melting of the polar ice caps, thereby raising sea levels and increasing the risk of coastal flooding. Similarly, the thin layer of gases that hosts the weather and fosters global warming may interact with the solid Earth – the geosphere — in a way as to make climate change an even bigger threat.

Although causal links are challenging to verify, an increasing number of scientists share McGuire’s views about the mechanics of the correlation between geological and weather-related events. In 2009, Chi-Ching Liu at Taipei’s Academia Sinica provided evidence for a link between typhoons barreling across Taiwan and the timing of small earthquakes beneath the island. In their view, storms might act as safety valves, repeatedly short-circuiting the buildup of dangerous levels of strain that otherwise could eventually instigate large, destructive earthquakes.

In a 2017 study on Iceland’s eruptions some 5,500-4,500 years ago, Graeme Swindles and his team in the UK University of Leeds found that the number of eruptions dropped significantly as the climate cooled and ice expanded. Since it took a long time to grow ice masses, there was a time lag of 600 years between when glaciers advanced and volcanic activity diminished.

Nevertheless, even small changes in ice volume can affect volcanism. And if the temperature is going up fast, it takes less time to melt ice, which may translate to a far shorter time lag.

According to the World Meteorological Association, 2019 was the second-warmest year on record. Since the 1980s, each successive decade has been warmer than any preceding decade since 1850. Climate change is contributing to rising probability of more volcanic activity in areas of the world where glaciers and volcanoes interact.

And as the climate warms faster, eruptions are likely to get bigger.

US withdrawal from Paris Accord amplifying risks

Despite rapidly-rising climate risks, the struggle against climate change is about to enter a more dangerous phase. In mid-2017, President Trump declared the United States would withdraw from the Paris Agreement (PA), an international accord to address climate change over the 21st century. Last November, the US began the official withdrawal procedure, which would likely take effect on or after November 4, 2020 – interestingly, a day after the 2020 US presidential election.

In US foreign policy, such withdrawal is likely to diminish US standing in the world by making the country an international rogue state on climate change, thereby reducing US reliability as a negotiating partner. Unlike Washington, Beijing and Brussels support the Paris Accord and have increased efforts in the global struggle against climate change.

In terms of the environment, US withdrawal would undermine international consensus and commitment to reduce greenhouse gas emissions (GHGs) to net zero in the second half of the century.

Most Americans and, according to surveys, 80% of young people think the federal government should address climate change opposing the impending Trump withdrawal. Many are promoting the proposed “Green New Deal,” a comprehensive legislative package introduced by Rep. Alexandria Ocasio-Cortez, the popular New York Democrat and Socialist.

In global economy, the Paris Accord was designed to pave a way to long-term shift for world economies could move toward “deep decarbonization” over time. During the transition, economic growth would be sustained, yet delinked from emissions of CO2 and other GHGs. While this transition would result in short- and medium-term costs, unsustainable development would impose far greater costs over time.

By the end of the century, the costs associated with unsustainable development, under high emissions scenarios, are projected in hundreds of billions of dollars per year (as reported by Climate Impacts and Risk Analysis, 2017) and up to -15.7% of GDP (2017 report by Hsiang and colleagues).

In brief, unsustainable climate change has unbearable costs. If the US exit will materialize at the end of the ongoing year, global climate risks and associated adverse costs will increase accordingly – including extreme geological events.

About the Author:

Dr. Dan Steinbock is an internationally recognized strategist of the multipolar world and the founder of Difference Group. He has served at the India, China and America Institute (USA), Shanghai Institutes for International Studies (China) and the EU Center (Singapore). For more, see https://www.differencegroup.net 

Versions of the original commentary have been released by China Daily and The Manila Times.
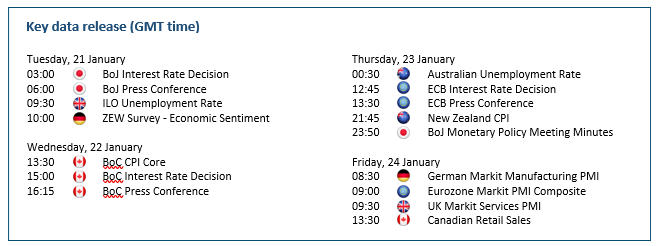
 

Forex Technical Analysis & Forecast 20.01.2020 (EURUSD, GBPUSD, USDCHF, USDJPY, AUDUSD, USDRUB, USDCAD, GOLD, BRENT, BTCUSD)

Article By RoboForex.com

EURUSD, “Euro vs US Dollar”

After reaching 1.1110 and forming a downside continuation pattern without any corrections, EURUSD has broken 1.1109 downwards to continue its decline. Possibly, today the pair may correct towards 1.1104 at least and then form a new descending structure with the target at 1.1080.

EURUSD
Risk Warning: the result of previous trading operations do not guarantee the same results in the future

GBPUSD, “Great Britain Pound vs US Dollar”

GBPUSD has reached 1.3000; right now, it is consolidating around this level. Possibly, the pair may correct to reach 1.3050 and then continue trading inside the downtrend reach the target at 1.2940.

GBPUSD
Risk Warning: the result of previous trading operations do not guarantee the same results in the future

USDCHF, “US Dollar vs Swiss Franc”

USDCHF has reached the short-term upside target at 0.9690. Today, the pair may correct towards 0.9660 and then start a new growth with the target at 0.9707.

USDCHF
Risk Warning: the result of previous trading operations do not guarantee the same results in the future

USDJPY, “US Dollar vs Japanese Yen”

USDJPY is still consolidating around 109.99. According to the main scenario, the price is expected to form one more ascending structure towards 110.53 and then resume falling with the target at 109.77.

USDJPY
Risk Warning: the result of previous trading operations do not guarantee the same results in the future

AUDUSD, “Australian Dollar vs US Dollar”

AUDUSD is falling towards 0.6852. After that, the instrument may resume moving upwards to reach 0.6888 and then start another decline with the target at 0.6834.

AUDUSD
Risk Warning: the result of previous trading operations do not guarantee the same results in the future

USDRUB, “US Dollar vs Russian Ruble”

USDRUB continues consolidating around 61.50. Possibly, the pair may break it upwards to reach 61.90. Later, the market may resume trading inside the downtrend with the target at 60.80.

USDRUB
Risk Warning: the result of previous trading operations do not guarantee the same results in the future

USDCAD, “US Dollar vs Canadian Dollar”

USDCAD is consolidating around 1.3062. Possibly, the pair may form a new descending structure towards 1.3050 and then resume growing with the target at 1.3082.

USDCAD
Risk Warning: the result of previous trading operations do not guarantee the same results in the future

XAUUSD, “Gold vs US Dollar”

Gold is moving upwards. Today, the pair may reach 1566.66 and then start a new correction with the first target at 1554.20.

GOLD
Risk Warning: the result of previous trading operations do not guarantee the same results in the future

BRENT

Brent is forming the third ascending structure to reach 65.12. Later, the market may start another correction towards 65.30 and then resume trading inside the uptrend with the first target at 66.50.

BRENT
Risk Warning: the result of previous trading operations do not guarantee the same results in the future

BTCUSD, “Bitcoin vs US Dollar”

BTCUSD has tested 8500.00 from above. Possibly, today the pair may form one more ascending structure towards 9240.00 and then start a new correction with the target at 7700.00.

BITCOIN

Article By RoboForex.com

Attention!
Forecasts presented in this section only reflect the author’s private opinion and should not be considered as guidance for trading. RoboForex LP bears no responsibility for trading results based on trading recommendations described in these analytical reviews.

The Week Ahead: Keep It Steady

By Orbex

Trade of the week

USDCAD Comes Under Renewed Pressure

Wednesday will see heightened volatility in the Canadian dollar. The consumer price index (CPI) will indicate whether inflation has picked up, an upbeat number would boost the loonie at the greenback’s expense. Later on, the Bank of Canada is due to announce its interest rate decision. Resilience in the housing market and improved business sentiment could lead the BoC to issue a positive outlook. A rally in the Canadian dollar would resume the pair’s downtrend from last November. 1.3000 would be the immediate target, while 1.3100 around the 20 and 30-day moving averages will be a key resistance level.

AUDJPY Hovers Under Key Resistance

Brighter trade prospects allowed the Australian dollar to rally back to its highs from last summer. As the Bank of Japan issues its rate decision this week, markets widely expect the bank to keep its monetary policy steady for the time being. An upbeat growth outlook could support the yen in the short term. However, improvement in global sentiment is likely to favor the Aussie in the medium term. The pair is about to test the previous high of 76.50. A breakout on the upside could trigger a rally towards 77.30.


EURGBP Looks for Opportunity to Bounce

The euro’s recent recovery has much to do with signs of economic stabilization and an optimistic tone from the ECB in December. An assertive central bank on Thursday could further lift the single currency. On the flip side of the coin, soft UK retail sales have slammed a brake on the pound’s rally. A disappointing employment figure on Tuesday could fuel speculations of a BOE rate cut, and push the pound into new lows. 0.8460 is a major support level for the euro to rebound. On the upside, the psychological level of 0.8600 needs to be lifted before any protracted rally.

Gold Enters Consolidation Phase

Global sentiment remains upbeat after the US and China signed the “phase one’ trade deal, in which China agreed to buy $200 billion worth of US products. However, a number of market commentators fear that the truce is brittle. Chinese growth has slowed down drastically. It may seem too optimistic to believe that China has the capacity to absorb a 50% increase in American imports. The precious metal may continue to grind sideways after its meteoric rise. 1535 near the 20-day moving average is the immediate support.

By Orbex

Fibonacci Retracements Analysis 20.01.2020 (GOLD, USDCHF)

Article By RoboForex.com

XAUUSD, “Gold vs US Dollar”

As we can see in the H4 chart, there is a correction inside another correction. The first correctional descending wave has reached 38.2% fibo, while the next one may head towards 50.0% and 61.8% fibo at 1530.60 and 1511.80 respectively. After finishing the pullback, the instrument may resume trading upwards to reach the current high at 1611.29 and the post-correctional extension area between 138.2 and 161.8% fibo at 1599.45 and 1625.70 respectively.

GOLD_H4
Risk Warning: the result of previous trading operations do not guarantee the same results in the future

The H1 chart shows more detailed structure of the correction. The pair is heading towards 38.2% fibo at 1564.80 and may later continue growing to reach 50.0% fibo at 1573.20. the support is the local low at 1535.89.

GOLD_H1
Risk Warning: the result of previous trading operations do not guarantee the same results in the future

USDCHF, “US Dollar vs Swiss Franc”

As we can see in the H4 chart, the pair is intending to continue trading downwards to reach the post-correctional extension area between 138.2 and 161.8% fibo at 0.9520 and 0.9433 respectively. However, considering the convergence on MACD and a slight growth, one can expect a new correctional uptrend. This scenario is valid as long as the instrument hasn’t broken the low at 0.9613.

USDCHF_H4
Risk Warning: the result of previous trading operations do not guarantee the same results in the future

In the H4 chart we can see that the instrument is moving towards 23.6% and 38.2% fibo at 0.9710 and 0.9770 respectively.

USDCHF_H1

Article By RoboForex.com

Attention!
Forecasts presented in this section only reflect the author’s private opinion and should not be considered as guidance for trading. RoboForex LP bears no responsibility for trading results based on trading recommendations described in these analytical reviews.

The Analytical Overview of the Main Currency Pairs on 2020.01.20

by JustForex

The EUR/USD currency pair

Technical indicators of the currency pair:
  • Prev Open: 1.11351
  • Open: 1.10905
  • % chg. over the last day: -0.40
  • Day’s range: 1.10889 – 1.11024
  • 52 wk range: 1.0879 – 1.1572

The EUR/USD currency pair is dominated by bearish sentiment. Greenback is supported by a series of optimistic economic releases from the US, which was published last week. At the moment, the trading instrument is testing a key support level of 1.10900. Mark 1.11100 is already a “mirror” resistance. The technical picture signals a further decline in the EUR / USD currency pair. We recommend opening positions from key levels.

Today the news background is calm. US financial markets will be closed due to the holiday.

EUR/USD

Indicators signal the strength of sellers: the price has fixed below 50 MA and 100 MA.

The MACD histogram is in the negative zone, but above the signal line, which gives a weak signal to sell EUR/USD.

The Stochastic Oscillator is in the neutral zone, the %K line is below the %D line, which indicates a bearish sentiment.

Trading recommendations
  • Support levels: 1.10900, 1.10500
  • Resistance levels: 1.11100, 1.11300, 1.11450

If the price consolidates below the level of 1.10900, expect a further drop toward 1.10600-1.10400.

Alternatively, the quotes could grow toward 1.11300-1.11400.

The GBP/USD currency pair

Technical indicators of the currency pair:
  • Prev Open: 1.30777
  • Open: 1.29928
  • % chg. over the last day: -0.64
  • Day’s range: 1.29705 – 1.30090
  • 52 wk range: 1.1959 – 1.3516

GBP/USD quotes went down. Sterling set new local lows. Demand for the US dollar remains at a fairly high level. At the moment, the key support and resistance levels are 1.29600 and 1.30150, respectively. The GBP/USD currency pair has the potential for further decline. Investors expect up-to-date information on Brexit. Open positions from key levels.

The Economic News Feed for 20.01.2020 is calm.

GBP/USD

The price fixed below 100 MA, which signals the strength of sellers.

The MACD histogram is in the negative zone and continues to decline, indicating a bearish mood.

The Stochastic Oscillator is near the oversold zone, the %K line crossed the %D line. There are no signals at the moment.

Trading recommendations
  • Support levels: 1.29600, 1.29200, 1.29000
  • Resistance levels: 1.30150, 1.30550, 1.31000

If the price consolidates below 1.29600, expect a further drop toward 1.29300-1.29100.

Alternatively, the quotes could grow toward 1.30400-1.30600.

The USD/CAD currency pair

Technical indicators of the currency pair:
  • Prev Open: 1.30415
  • Open: 1.30579
  • % chg. over the last day: +0.12
  • Day’s range: 1.30550 – 1.30710
  • 52 wk range: 1.2949 – 1.3566

The USD/CAD currency pair continues to trade in a long flat. There are no defined trends. Participants in financial markets expect additional drivers. At the moment, the following local support and resistance levels can be distinguished: 1.30500 and 1.30750, respectively. A trading instrument has potential for growth. We recommend that you pay attention to the dynamics of prices of “black gold”. Open positions from key levels.

The Economic News Feed for 20.01.2020 is calm.

USD/CAD

Indicators do not give accurate signals: 50 MA crossed 100 MA.

The MACD histogram has moved into the positive zone, indicating bullish sentiment.

The Stochastic Oscillator is in the neutral zone, the% K line is above the% D line, which gives a signal to buy USD / CAD.

Trading recommendations
  • Support levels: 1.30500, 1.30300, 1.30000
  • Resistance levels: 1.30750, 1.31000, 1.31300

If the price consolidates above 1.30750, USD/CAD quotes are expected to rise. The potential movement is to 1.31000-1.31200.

Alternatively, the quotes could descend toward 1.30300-1.30000.

The USD/JPY currency pair

Technical indicators of the currency pair:
  • Prev Open: 110.138
  • Open: 110.077
  • % chg. over the last day: -0.05
  • Day’s range: 110.077 – 110.216
  • 52 wk range: 104.45 – 113.53

The USD/JPY currency pair has stabilized after continued growth. The trading instrument is currently consolidating. Local levels of support and resistance are: 110.000 and 110.300, respectively. In the near future, a technical correction is possible. We recommend that you keep track of current information regarding the second phase of the trade agreement between Washington and Beijing. Open positions from key levels.

The news background on the Japanese economy is calm.

USD/JPY

Indicators do not give accurate signals: the price crossed 50 MA.

The MACD histogram is near the 0 mark.

The Stochastic Oscillator is in the neutral zone, the %K line crossed the %D line. There are no signals at the moment.

Trading recommendations
  • Support levels: 110.000, 109.800, 109.400
  • Resistance levels: 110.300, 110.600

If the price consolidates above 110.300, expect further grotwht toward 110.600-110.800.

Alternatively, the quotes could correct toward 109.600-109.400.

by JustForex