Forex Daily Market Commentary

By GCI Forex Research

Fundamental Outlook at 0800 GMT (EDT + 0400)

USD

The dollar failed to claw back any of its recent losses during the Asia session. EURUSD traded 1.3813-1.3862, and USDJPY 81.31-81.60. US equities closed up over 1% and Treasury yields pushed higher. The manufacturing ISM index rose much higher than expected to 60.8 in January versus consensus 58.0. The report included increases in the components most directly indicative of faster growth, with the employment index, the new orders index, and the production index all posting gains. All in all, the ISM report showed the trend in manufacturing output growth (and hiring) rising solidly at the beginning of 2011. The strength in the ISM index is consistent with our economists’ forecast for real GDP growth to pick up to a 4.2% annual rate in Q1 from 3.2% in Q4. But with labour data ahead, market participants do not appear to want to cheer the ongoing US recovery just yet. The ADP employment change does have a reasonable correlation to payrolls data. However, the last ADP print conflicted with the official non-farm payrolls release and wintry weather could add more volatility to the payrolls data this time around.
EUR

Manufacturing PMIs across the Eurozone were strong, with Germany, Italy and France all beating consensus. The EU composite indicator was equally positive, although there is substantial country divergence between the larger economies and the peripheral nations. But with the indicator near the 2006 high, a potential turning point may be at hand. The Eurozone unemployment rate fell for the first time since 2007, to 10.0%, in line with UBS estimates.
Spanish Economy Secretary Campa is confident that Eurozone leaders will reach a deal on improving the financial stability facility and said recent market calm does not remove the need for a more effective facility.
JPY

BoJ Board member Kamezaki said that rapid FX moves are undesirable, but that the yen’s appreciation has subsided somewhat from the sharp gains that have been seen in the past.
GBP

Manufacturing PMI in the UK rose to 62.0, the highest level since records began in 1992. Mortgage approvals fell in December, but this was largely due to the adverse weather conditions and sterling reacted positively to the PMI data primarily.
CHF

Swiss data was mixed with a disappointing retail sales number but a very strong PMI print. Retail sales fell in December by -0.4% y/y versus November’s reading of +2.5%. The PMI was 60.50 versus consensus at 59.2.
SNB Vice President Jordan did not comment on monetary policy but again said that the Swiss franc has massively appreciated and poses a risk to growth
AUD

Australia is bracing itself for the arrival of a category 5 cyclone today. Queensland Premier Bligh said it could be “catastrophic”.
CAD

BoC Senior Deputy Governor Macklem said a strong Canadian dollar could jeopardize the export recovery but at the same time said it would be a “risky business model” to assume the Canadian dollar would weaken.

Forex Daily Market Commentary provided by GCI Financial Ltd.

GCI Financial Ltd (”GCI”) is a regulated securities and commodities trading firm, specializing in online Foreign Exchange (”Forex”) brokerage. GCI executes billions of dollars per month in foreign exchange transactions alone. In addition to Forex, GCI is a primary market maker in Contracts for Difference (”CFDs”) on shares, indices and futures, and offers one of the fastest growing online CFD trading services. GCI has over 10,000 clients worldwide, including individual traders, institutions, and money managers. GCI provides an advanced, secure, and comprehensive online trading system. Client funds are insured and held in a separate customer account. In addition, GCI Financial Ltd maintains Net Capital in excess of minimum regulatory requirements.

DISCLAIMER: GCI’s Daily Market Commentary is provided for informational purposes only. The information contained in these reports is gathered from reputable news sources and is not intended to be U.S.ed as investment advice. GCI assumes no responsibility or liability from gains or losses incurred by the information herein contained.
FX Markets Eye U.S. ADP Non-Farm Employment Change

Source: ForexYard

Today, traders should pay close attention to the release of the U.S. ADP Non-Farm Employment Change report. This indicator always provides for extreme market volatility in the major currency pairs. Traders may find good opportunities to enter the market following this vital announcement at 13:15 GMT.

Economic News

USD – Dollar Falls against Majors after U.S. Manufacturing Data

The US dollar slid on Tuesday against other major currencies, hitting a three-month low against the euro, as surprisingly strong US manufacturing data encouraged risk-taking. In addition, the dollar, which saw a safe-haven bids late last week when protests in Egypt intensified, fell broadly as risk appetite returned, hitting a four-week low of 81.33 against the yen and falling 0.9% against the CHF to 0.9355.

The dollar has fallen every day this week against the EUR, Sterling Pound, and yen. Analysts attributed the fall in the dollar, which has been treated as a lower risk, safe-haven investment, to growing optimism that the worst of the financial crisis has passed, causing investors to unwind long dollar positions when fear was widespread, credit was frozen and stock markets were in a free fall.

Another leading indicator released yesterday was U.S Manufacturing PMI. This number handedly beat last month’s result but failed to provide strength to the dollar as investors may be waiting for key data due to be released today to implement their trading strategies.

Looking ahead today, the news event that may have a very large impact on the dollar and its main currency pairs in today’s trading is the ADP Non-Farm- Employment Change around 13:15 GMT. This report is very important as it will likely impact dollar volatility. Traders should pay close attention to the market as there is an opportunity to capitalize on the fluctuations which are likely to follow this release.

EUR – EUR Gains on Renewed Risk Appetite

The euro rose against the major currencies on Tuesday, supported by expectations of higher euro-zone interest rates and an increase in investor appetite for riskier assets. As a result, the euro rose as high as $1.3842, its highest since early November. The EUR experienced similar behavior against the GBP and closed at 0.8570.
Traders are increasingly convinced that rising inflation in the 17-nation currency bloc will soon force the hand of the European Central Bank as it seeks to curb price pressures. While no one expects the ECB to raise interest rates when it meets on Thursday, building inflationary pressures have led to speculation the central bank may need to raise borrowing costs sometime this year.

Currency levels are being increasingly determined by interest rate differentials. As a result, investors have been willing to purchase euros based on expected higher returns, even as they momentarily ignore Europe’s still-festering sovereign debt problems.

Easing fears Egypt’s political unrest would spread in the Middle East also helped boost the euro and higher-yielding currencies such as the Australian and New Zealand dollars.

JPY – Yen Mixed Against Major Currencies

The yen completed yesterday’s trading session with mixed results versus the other major currencies. The JPY was broadly unchanged versus the EUR yesterday and closed its trading session at around the 112.50 level. The JPY also saw bullishness against the USD as it jumped around 60 points and closed at 81.40.

The JPY’s trends will be affected by the rallies of its primary currency pairs today. It seems that the USD and EUR are expected to continue a volatile trading session today, especially against the Japanese currency. Traders should keep a close look on the news coming from the U.S. and Europe as these economies will be the deciding factors in the JPY’s movement today, especially the ADP Non- Farm Employment Change at 13:15 GMT. It is also advisable for traders to follow any unexpected comments coming from key Japanese governmental figures, as this is also likely to lead to further JPY volatility.

OIL – Crude Oil Inventories Data to Drive Oil Trading Today

Crude oil price slipped on Tuesday as fears over oil supply disruptions at the Suez Canal eased, but attention remained fixed on events in Egypt, where massive antigovernment protests continued for another day. Crude oil prices dropped to an intra-day low of $90.30 a barrel before rebounding to settle at 90.90,

Egypt isn’t a major oil supplier, but the Suez Canal and the nearby Sumed pipeline are key chokepoints for global oil supplies. In addition, fears persist that the antigovernment protests could spread to major oil producing countries elsewhere in the region.

As for today, traders should pay attention to the U.S. Crude Oil Inventories report scheduled, as it tends to have a large impact on crude oil’s prices recently, especially for the short-term.

Technical News

EUR/USD

The pair has recorded much bullish behavior in the past several days. However, the technical data indicates that this trend may reverse anytime soon. For example, the 4-hour chart’s Stochastic Slow signals that a bearish reversal is imminent. Going short with tight stops might be a wise choice.

GBP/USD

The price of this pair appears to be floating in the over-bought territory on the 4-hour chart’s RSI indicating a downward correction may be imminent. The downward direction on the 8-hour chart’s Momentum oscillator also supports this notion. When the downwards breach occurs, going short with tight stops appears to be preferable strategy.

USD/JPY

The USD/JPY cross has experienced a bearish trend for the past week. However, it seems that this trend may be coming to an end. The RSI of the 4-hour chart shows the pair floating in the oversold territory, indicating that an upward correction will happen anytime soon. Going long with tight stops might be a wise choice.

USD/CHF

The 8-hour chart is showing mixed signals with its Slow Stochastic fluctuating at the neutral territory. However, there is a fresh bullish cross forming on the 4-hour chart’s Slow Stochastic indicating a bullish correction might take place in the nearest future. Going long might be a wise choice.

The Wild Card

NZD/USD

This pair’s sustained upward movement has finally pushed its price into the over-bought territory on the 4-hour chart’s RSI. Not only that, but there actually appears to be a bearish cross on the Slow Stochastic pointing to an imminent downward correction. forex traders have the opportunity to wait for the downward breach on the hourlies and go short in order to ride out the impending wave.

Forex Market Analysis provided by ForexYard.

© 2006 by FxYard Ltd

Disclaimer: Trading Foreign Exchange carries a high level of risk and may not be suitable for all investors. There is a possibility that you could sustain a loss of all of your investment and therefore you should not invest money that you cannot afford to lose. You should be aware of all the risks associated with Foreign Exchange trading.

US dollar declines whereas the Euro Strengthens

The US dollar declined versus its major counterpart currencies on Tuesday where the Euro strengthened on the better than expected economic data by euro zone. Investors took fresh position on single currency perceiving it to be safe haven keeping in view the political and economic unrest in Egypt.

The dollar index DXY which measures the US dollar’s movement versus its six major rival currencies declined to 76.008 on Tuesday’ s North American trading session as compared to 77.777 on Monday

The Euro surged to 1.3835 against the greenback as compared to 1.3689 on late Monday. Investors were very optimistic about the single currency and took fresh positions on the euro zone’s increased PMI index for manufacturing sector depicting high factory activity in last nine months.

Moreover Germany also reported a decreased of 13,000 in its unemployment figure for the month of January.

Economist Andrew Grantham from HSBC commented, “The figures confirmed that growth remained robust in January and suggested that it is now more broadly-based.”

The US dollar experienced high selling pressure but later in session recovered on better than expected US manufacturing data.

The greenback also declined versus the British Pound as the pair GBP/USD surged to 1.6148 as compared to 1.6020 on Monday. Pound Sterling remained strong as the Britain’s manufacturing PMI reached its record high to 62.0 for the month of January.

The US dollar declined to 81.40 against the Japanese Yen as compared to 82.07 on Monday. The trading of Yen is highly reactive to US treasury rates which have increased after strong US manufacturing data on Tuesday.

About the Author

Daily forex trading news written by Rehan from DailyForexTrade.com

Trans-Asia Oil and Energy Development Corporation (TA) Awakes?

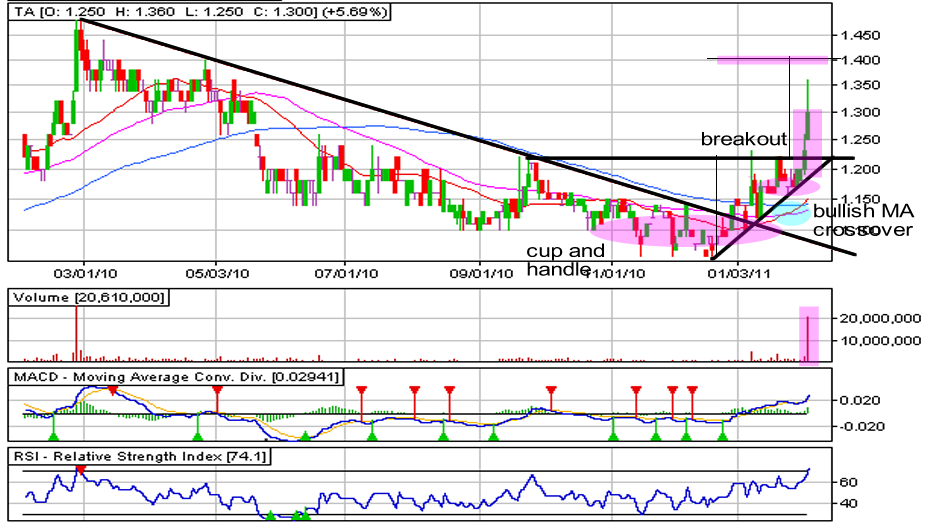
Trans-Asia Oil and Energy Development Corporation or TA in the Philippine Stock Exchange is a company that is involved in power generation, and oil and mineral exploration business. Like one of its partners in the drilling of several oil wells, Petroenergy Resources Corporation (PERC), TA looks to be on the verge of an upswing in the days to come as well at least from a technical point of view. As you can see from its day chart, TA has already escaped from its long term downtrend line. The other day (January 31, TA broke out from a cup and handle formation. This move was confirmed yesterday when its 5.69% gain was accompanied by a relatively large volume.

Yesterday’s breakout could swing TA towards its upside target of PHP 1.40 (gauged by projecting the height of the cup from the point of breakout). Another bullish indicator that suggests a possible move higher was a bullish crossover (highlighted in light blue) of the moving averages. Usually, when the red moving average crosses over the other two MAs signifies a switch in trend. On the down side, TA could likewise weaken because of its overbought condition. If it does, it could once again revisit its support around PHP 1.22.

More on LaidTrades.com

Stocks Look PERCy Enough!

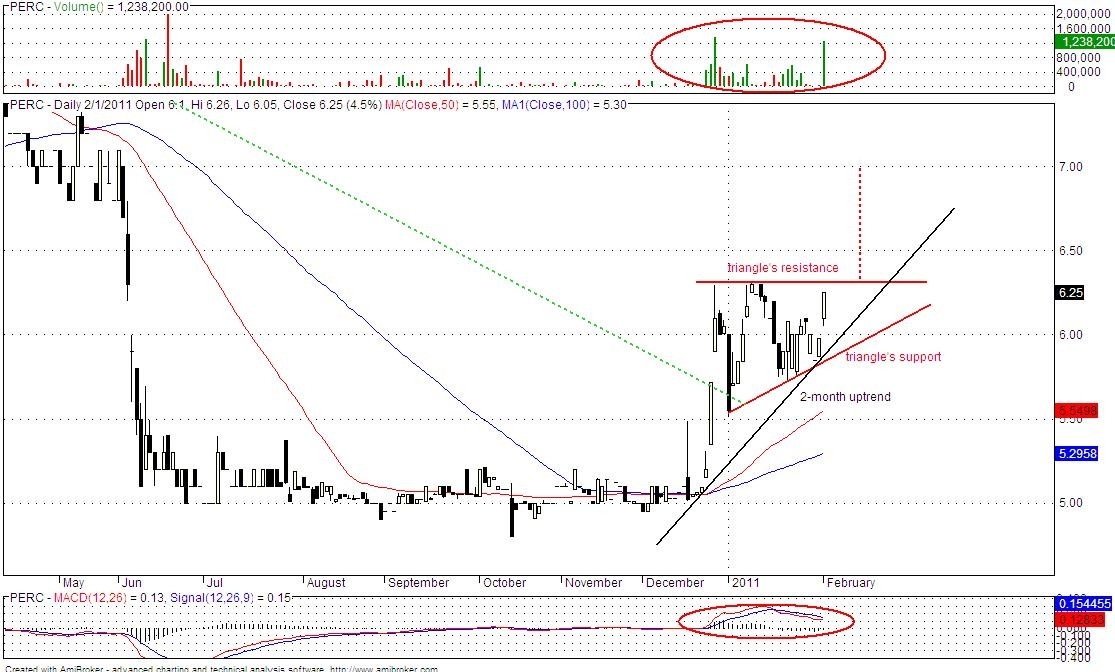
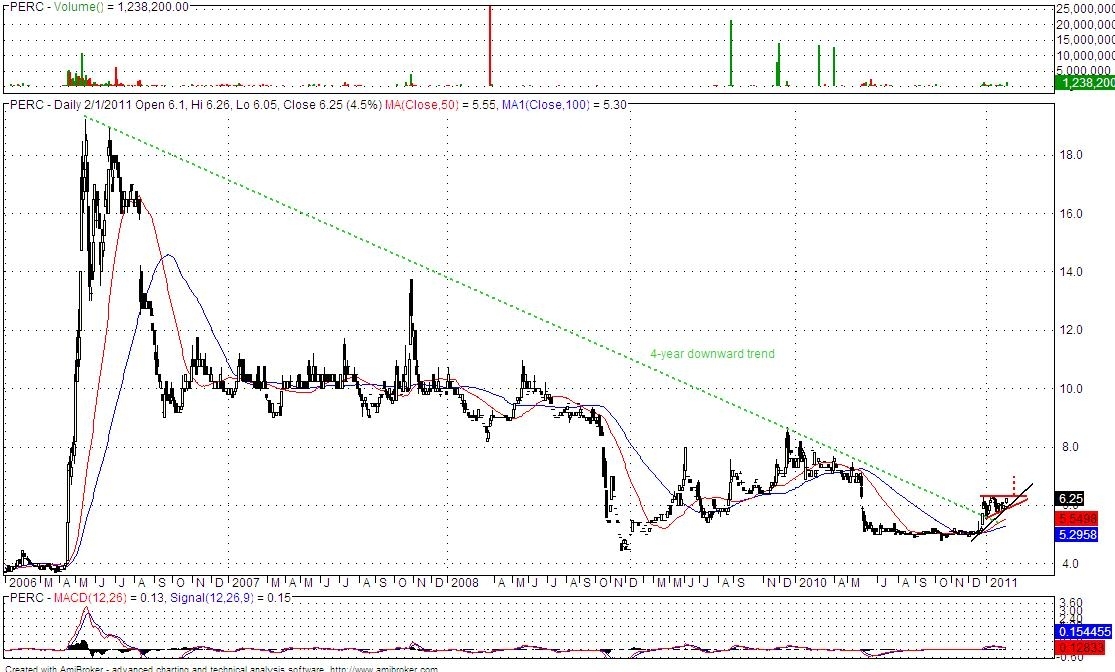
Petroenergy Resources Corporation or PERC as listed in the Philippine Stock Exchange provides specialized technical services to oil-exploring companies in the Philippines. Technical wise, the PERC stocks broke out from its 4-year downtrend last December 8 as seen in the image above.

As we zoom closer, there could be a 1-month ascending triangle setting up as well, just right above the broken downtrend. A break above the triangle’s resistance could make way for the PHP 7.00 target price which I got by adding the size of the triangle’s base to the possible breakout point. At its current price, if it reaches the target, that could be an easy 12% gain! PERC, by the way, is moving above the 50 and 100-period moving averages, the MACD is above 0 and its volume traded daily has been more active recently. With these positive indicators in line along with the bullish looking chart pattern, the stocks could most likely be propelled upward. In case the stocks drop, the 2-month uptrend could be the immediate support. Then the next marker is the ascending triangle’s support.

On the side note, Petroenergy Resources Corporation is currently working on its geothermal produce in southern Luzon and is preparing to begin drilling at an oil well in San Isidro Leyte that covers 332,000 hectares over the East Visayas basin. Drilling is set to start on March 2011 with an estimated 12 million to 263 million oil barrels to be found on the site. Partners for the Leyte project include listed companies Alcorn Gold Resources Corporation (APM), Energy Development Corporation (EDC) and Trans-Asia Oil and Energy Development Corporation (TA). With oil prices soaring higher because of the political turmoil in Egypt, PERC would most likely benefit from it.

Just be careful with your trades since the Philippine Stock Exchange Index has broken down from its 2-year ascending channel and could continue to head lower until it finds some support (here’s my post when the channel was still intact).

More on LaidTrades.com

Crisis Panel Report Reveals Flaws in the U.S. Financial System

By Sara Nunnally, Editor, Smart Investing Daily, taipanpublishinggroup.com

Today, I have to rant… Over the weekend I read parts of a report from the Financial Crisis Inquiry Commission. After the global financial crisis, the U.S. government created the Financial Crisis Inquiry Commission to delve into the heart of what caused the crisis, and who might be to blame for it.

On Thursday of last week, the Commission released its report. It’s 633 pages long, and cites some 700 interviews and millions of e-mails. No wonder it took them so long… Even the Warren Commission and its 888-page report took less than a year to prepare.

The Commission was created on May 20, 2009, under the Fraud Enforcement and Recovery Act of 2009.

Along with the report released on Thursday, the Financial Crisis Inquiry Commission released 1,200 documents, with another thousand documents and interviews to be released before the Commission dissolves on Feb. 13.

It does more than just point fingers… It explains how a financial system nearly collapsed. And it cited actions from people on both Wall Street and in Washington.

From page xv of the Financial Crisis Inquiry Commission Report:

Some on Wall Street and in Washington with a stake in the status quo may be tempted to wipe from memory the events of this crisis, or to suggest that no one could have foreseen or prevented them. This report endeavors to expose the facts, identify responsibility, unravel myths, and help us understand how the crisis could have been avoided. It is an attempt to record history, not to rewrite it, nor allow it to be rewritten.

Indeed, the Commission was to be bipartisan, but the report was supported only by the six Democrats on the panel. The four Republicans actually offered two separate dissents.

At the heart of the disagreement is an age-old argument.

Deregulation. For simplicity’s sake, let’s make some generalizations. Republicans favor an environment with less regulation, while Democrats tend to favor more regulation.

Republicans argue that regulations can unnecessarily slow economic growth.

Democrats say deregulation creates an unstable economy with room for fraud and bubbles.

For example, the Glass-Steagall Act was first passed in 1933. This act limited the amount of investing a commercial bank could do, and it in effect separated — and kept separate — investment banks and bank-holding companies from the commercial banking industry.

This act was in response to the vast speculation that was behind the stock market crash in 1929. There was outright fraud, and conflicts of interest that were behind some banks’ activities.

The Glass-Steagall Act sought to make commercial banks and brokers or investment banks two different entities.

But it wasn’t long before certain banks began chipping away at the act — lobbying for increases in investing limits and deregulation that would allow them to acquire other banks.

Citigroup was one of the more prominent folks behind the push to repeal the act. It’s been suggested that Sanford Weill, CEO of the group from October 1998 to October 2003, spent $100 million lobbying to get the act repealed.

It worked. On Nov. 12, 1999, the provisions in the Glass-Steagall Act that prohibit a bank-holding company from acquiring other financial companies were repealed with the Gramm-Leach-Bliley Act, also known as the Financial Services Modernization Act of 1999.

Many folks believe this repeal was responsible for the buildup of risky assets and investments and contributed heavily to the global financial crisis.

Consider what Robert B. Ekelund and Mark Thornton have to say:

The Financial Services Modernization Act of 1999 would make perfect sense in a world regulated by a gold standard, 100% reserve banking, and no FDIC deposit insurance; but in the world as it is, this “deregulation” amounts to corporate welfare for financial institutions and a moral hazard that will make taxpayers pay dearly.

And boy, have we… In fact, we still are, as the Federal Reserve continues to buy billions of dollars’ worth of government debt each month.

(Investing doesn’t have to be complicated. Sign up for Smart Investing Daily and let me and my fellow editor Jared Levy simplify the stock market for you with our easy-to-understand investment articles.)

But let’s get back to the Commission’s report.

In a nutshell, the Commission blames “the collapse of the housing bubble — fueled by low interest rates, easy and available credit, scant regulation, and toxic mortgages” for the financial crisis. But there are a lot of players that contributed to each of those factors, so the blame can be widely spread between Wall Street and Washington, and those places in between, like the Federal Reserve.

Speaking of which, did you know that Fed Chairman Ben Bernanke has called the financial crisis “the worst financial crisis in global history, including the Great Depression”?

Maybe not. He didn’t say it publicly; he told the Commission behind closed doors on Nov. 17, 2009.

And yet, everyone — from financial institutions to the Federal Reserve to the government and its regulators — didn’t see this coming.

Up until the you-know-what hit the fan, everyone was saying that the housing bubble could be contained. Greenspan didn’t see it, Bernanke didn’t see it… But maybe one company did.

Goldman Sachs.

This company, one of the creators of collateralized debt obligations (CDOs) that bundled up subprime mortgages and labeled them as a AAA-rated investment, was actually betting against these securities.

They made a killing, too. In 2007, the company made $4 billion in profits from their subprime bets.

That’s my rant… The report highlights all of these greedy actions of money-hungry banks and blind inactions from the government and Federal Reserve.

And much of it was already in Barbarians of Wealth, the book Sandy Franks and I co-authored last year:

Chapter 11: The Scourge of Wall Street talks about Goldman Sachs’ exploits. Chapter 6: Race to the Bottom Line talks about deregulation… It’s this kind of stuff that needs to be aired — not behind the closed doors of some government commission to be released more than a year later.

If you haven’t picked up a copy of Barbarians of Wealth yet, consider it a kind of New Year’s resolution. The barbaric tales of Wall Street are still relevant today. Perhaps even more so, as one commissioner, Byron S. Georgiou, said the financial system is not that different today as it was before the crisis.

“In fact,” he said, “the concentration of financial assets in the largest commercial and investment banks is really significantly higher today than it was in the run-up to the crisis, as a result of the evisceration of some of the institutions, and the consolidation and merger of others into larger institutions.”

The protections inside shouldn’t be missed…

Editor’s Note: Do you have the government form that could make you 81% in a day? Inside an obscure Canadian government form is a tip-off about a massive silver discovery. You could make 81% in a matter of hours when the discovery is announced to the public. This announcement could happen any day now. Find out how to cash in on this silver investment.

About the Author

Sara is Managing Editor of Smart Investing Daily. As Senior Research Director and global correspondent, Sara Nunnally’s diverse resume includes studies in art history, computer science and financial research. She has appeared on news media such as Forbes on Fox, Fox News Live, and CNBC’s Squawk Box, as well as numerous radio shows around the country.

As Senior Research Director, global correspondent and managing editor of Smart Investing Daily, Sara has traveled all over the world in search of the best investment opportunities to recommend to her readers, be they in developed economies like France and Italy, in emerging markets like the Czech Republic and Poland, or in frontier terrain like Vietnam and Morocco. Her unique “holistic” approach of boots-on-the-ground research has given her an edge in today’s financial marketplace as she searches for the next investment opportunities in hot sectors like alternative energy, currency markets and commodities.

Lock In Your Gasoline Prices With Crude Oil on the Rise

By Jared Levy, Editor, Smart Investing Daily, taipanpublishinggroup.com

Yes, it’s true. I know what you are thinking… that I’m probably going to show you some fancy stock or futures contract strategy to offset higher crude oil prices — but it might be simpler than that. The question is whether it’s worth it or not… Let’s take a look.

West Texas Crude Oil Above $90

Sometimes it takes a geopolitical crisis or catastrophe to act as a “reality check” and create a catalyst for movement in the prices of stocks or commodities. Natural and man-made catastrophes can not only change the fundamental picture of a commodity like oil, but also rouse speculators to drive prices wildly higher (or lower). Sometimes an impending catastrophe can be right under our noses, as Sara discussed in yesterday’s Smart Investing Daily article. Whether you’re an investor or simply an informed citizen, you cannot afford to ignore what is going on around the world.

The events unfolding in Egypt and in other areas across the world (Australia) remind us of not only the fragility of some political and social systems, but also the unpredictability of our Mother Earth. The protests to oust President Mubarak alone have catapulted crude oil prices from $85 to over $92 a barrel in just two days. Egypt is not even a major oil exporter by comparison, but the Suez Canal is a major thoroughfare for tankers.

Even at two-year highs, crude oil prices are still drawing support, not just because of tensions in Egypt and the Middle East, but by the weakening dollar and a 20-year high reading of the Chicago Purchasing Managers Index, which perhaps indicates continued growth regionally and also nationally.

Let’s not forget our friends at OPEC who “manipulate” supply to keep crude oil prices steady. I am sure that the 12 members — Iran, Iraq, Kuwait, Saudi Arabia, Venezuela, Qatar, Libya, United Arab Emirates, Algeria, Nigeria, Ecuador and Angola — want to do everything they can to keep prices low. (Chuckle.)

So where do we go from here? I say higher over the next year… Crude oil has been on Smart Investing Daily‘s radar for some time; we saw this coming and have offered you a couple of ways to play it from an investment standpoint. But we also realize that it’s not just your investment account that can benefit (or suffer from) from a rise in the price of crude oil. What about your transportation costs?

Do You Need to Protect Your Fuel Costs?

Crude oil at $100 is not an “if” but a “when” in my humble opinion, which unfortunately is shared by many. At the height of the commodity boom in 2008, I found a company called MyGallons.com, which allowed you to “lock in” your fuel costs, the same way Southwest Airlines did during that same period. It seems like a decent idea, but I wanted to check it out for all of you beforehand.

Here’s How It Works

If you think gas prices are going to be on the rise, you can lock in fuel prices at MyGallons.com, but there are some nuances you need to know. You have to have an idea about how much gas you use on a monthly basis and just how much gas you want to purchase beforehand. Take a look at your past receipts to help figure that out.

MyGallons.com charges $30 per year for their service. They allow you to lock in a price for up to 150 gallons per month, per car (you can add up four cars and purchase up to 600 gallons per month… wow).

Think of them as a “gas storage facility.” You buy as many gallons as you want up front and they guarantee the price for as long as you are a member (paying the $30 annual fee).

Basically, the website has an interactive map which you can use to check out the average fuel price for your state and purchase your gas with a click of the mouse. Think of the map as the “stock market” for your gas prices (the prices go up and down daily as fuel prices ebb and flow).

On the site, I can purchase a gallon of (87 octane) gas (in Texas) for $3.03. So if I wanted, I could log on today and buy 100 gallons for a total cost of $303.30, giving me about a five-month supply of gas based on my personal usage, locked in at that rate. You can also have MyGallons send you a debit card to purchase your gas with (which they charge extra for), or you can tell them how much you actually spent at the pump and they will credit your bank account for the difference, no matter where or how much you spent per gallon.

I know it seems a bit confusing — even the customer service agents I spoke to had a tough time explaining.

You do need to know that MyGallons charges 6 CENTS a gallon to process your rebates for gas. So in reality, add 6 CENTS to the MyGallons website price to find the “real” price you are locking in at.

(Crude oil may be in the news, but it’s not the only thing moving the market right now. If you’re looking for additional market analysis, sign up to read my and fellow editor Sara Nunnally’s latest on financial market trends and investment commentary).

Does It Make Sense?

The first downside I see is the big upfront cost: purchasing all your gas in one transaction. Some of us may not be able to afford that. Secondly, if the price of gas drops, you can just go purchase at the pump and wait for the price to go back up to use the gas you prepaid for. (Remember that your locked-in price is good indefinitely as long as you pay the $30 annually.)

The third con is managing how much you use and figuring out just how much you want to buy and lock in.

According to gasbuddy.com, a gallon of gas in my area costs $2.90 on average, but the Shell station across the street from me is currently at $3.19, so maybe MyGallons.com is a good deal right now for me.

Retail Gas
View larger chart

The bottom line is that a service like this is not for everyone; the biggest hurdle is having the means to buy your gas in one lump sum.

According to the Department of Transportation, the average American drives about 17,000 miles per year (2003). The DOT also puts the average MPG of the autos we drive at about 20, which means that on average you can expect to use 850 gallons of gas annually. Just a 25-cent rise in the price of gas from here would cost you about $213 annually at that amount of consumption.

From January to July 2008 alone, gas prices rose over $1.20, while crude oil rose from $88 to $140. While I don’t see crude oil at $140 by July, anything can happen; this is just another potential resource for you, the smart investor, to consider…

Editor’s Note: This coming crisis could blow a 950% profit your way! The U.S. wants to use “green technology” to decrease our dependence on oil. But China has a 97% monopoly on a natural resource that is vital to green technology… and we’re about to experience a serious shortage! In this URGENT FREE REPORT learn which companies could solve this crisis and hand you 950% gains in as few as 24 months!

About the Author

Jared Levy is Co-Editor of Smart Investing Daily, a free e-letter dedicated to guiding investors through the world of finance in order to make smart investing decisions. His passion is teaching the public how to successfully trade and invest while keeping risk low.

Jared has spent the past 15 years of his career in the finance and options industry, working as a retail money manager, a floor specialist for Fortune 1000 companies, and most recently a senior derivatives strategist. He was one of the Philadelphia Stock Exchange’s youngest-ever members to become a market maker on three major U.S. exchanges.

He has been featured in several industry publications and won an Emmy for his daily video “Trader Cast.” Jared serves as a CNBC Fast Money contributor and has appeared on Bloomberg, Fox Business, CNN Radio, Wall Street Journal radio and is regularly quoted by Reuters, The Wall Street Journal and Yahoo! Finance, among other publications.

Has the Relationship Between Stocks and the Dollar Broken Down?

View the original post at http://blog.currensee.com/2011/01/has-the-relationship-between-stocks-and-the-dollar-broken-down/

By John Forman

There’s been loads of talk this week about the correlation between stocks and the dollar thanks to an article in the Wall Street Journal and the reactions to it from folks on CNBC and in the blogosphere. The driving idea is that the relationship has broken down of late. Is that really the case? Well, let’s take a look at a comparative chart.

The graph below shows how stocks and the dollar have traded through the month of January. The red line is the stock market as measured by the mini S&P 500 futures. The black line is the cash Dollar Index.

So what’s the conclusion? At times the markets definitely show a strong negative correlation. The period between January 10th and January 18th show two markets almost totally going in opposite directions. The two markets were positively correlated during the earlier part of the month, however, and since the 18th things have been rather muddled. The point is correlations change, even from day to day at times.

And change is the key. The chart below goes back a year and plots the 1-month trailing correlation between the S&P 500 index and the EUR/USD rate (the latter being the major element to the Dollar Index). When EUR/USD is rising it means a weaker dollar, so a strong positive correlation means stocks and the buck are moving in opposite directions.

Notice how much variability there’s been in the correlation just in the last year. Certainly, most of the time stocks and the dollar have moved in opposite directions (positive correlation on the above chart), including of late. That wasn’t always a strong correlation, though, and at several points the correlation was negative, indicating stocks and the dollar moving in the same direction.

Then there’s the relationship between gold and the dollar, which hasn’t been nearly as consistent as the one between stocks and the dollar. The chart below shows the last year worth of trailing 1-month correlations between the metal and the greenback.

Again, here we have EUR/USD as a kind of reverse proxy for the Dollar Index. If gold and the dollar consistently trade in opposite directions we would expect to see a consistent strong positive correlation between gold and EUR/USD. That clearly has not been the case, however. Most of the time, in fact, the relationship has been the other way around – gold and the dollar generally moving in the same direction.

The changes in correlations between markets reflect changes in the primary moving force underlying those markets. Stocks and the dollar have moved in opposing directions thanks to risk on/off psychology in the past. That’s less the case now, which is why the arguments are being made about the negative correlation breaking down. There are other things, however, which can cause that inverse relationship to continue. One of those is relatively low interest rates in the US pressuring the greenback, but at the same time benefiting stocks.

Likewise, gold and the dollar have traded in the same direction at times of risk-on/off because investor money flows into dollar and into gold when there’s a lot of fear in the market. The two markets trade in opposite directions when the market is more fixated on the negative impact of something like quantitative easing on the dollar (higher money supply reduces the value of the dollar in terms of real assets).

The point is, just because one set of causes for markets being correlated or uncorrelated are no longer the major driving force, it doesn’t mean that there isn’t another set of causes that can maintain the same or similar linkage.

=====

Be sure to read the full risk disclosure before trading Forex. Please note that Forex trading involves significant risk of loss. It is not suitable for all investors and you should make sure you understand the risks involved before trading. Performance, strategies and charts shown are not necessarily predictive of any particular result. And, as always, past performance is no indication of future results.

=====

John Forman is a senior foreign exchange analyst for the IFR Markets group of Thomson Reuters and author of The Essentials of Trading. John is a 20+ year veteran of the financial markets. He holds an MBA from the University of Maryland and a BS from the University of Rhode Island, both concentrating in Finance.

China Official PMI Manufacturing Data edges lower in January, HSBC survey rises

Chinese manufacturing data continued to expand in January but the data marked a five-month low, according to a government report released earlier today. China’s official purchasing managers index, released by the China Federation of Logistics and Purchasing, leveled at 52.9 in January from a score of 53.9 in December.

A score above 50 in the PMI data indicates expanding growth while score below 50 signals a contraction in that area. The PMI manufacturing data failed to surpass economic forecasts that were expecting a 53.5 score for the month.

HSBC, in conjunction with Markit, also released their purchasing managers index today and showed that China’s manufacturing edged higher in January to 54.5 from a 54.4 score in December. The increasing PMI score signaled continued improvement in manufacturing, according to the report.

Hongbin Qu, Chief Economist, China & Co-Head of Asian Economic Research at HSBC commented on the latest report: “China kick-started the New Year with another upbeat manufacturing PMI reading, following the stronger-than-expected 4Q GDP growth release. The strong growth momentum leaves room for Beijing to fully focus on checking liquidity and inflation pressure. Quantitative tightening in the form of reserve requirement ratio hikes will remain the most effective policy tools.”

Data Summary:

Official China PMI: JAN – 52.9 vs. DEC – 53.9, CONSENSUS – 53.5

HSBC China PMI: JAN – 54.5 vs. DEC – 54.4

Article by FxNewsChina – China Forex News

This Week’s Forex Market Commentary with David Song from DailyFx

By Zac, CountingPips.com

Today, I am pleased to share a forex interview/commentary on this week’s major events and forex trends with currency strategist at DailyFx.com, David Song. David studied macroeconomic policies under a visiting scholar at the Federal Reserve Bank of St. Louis while attending the Zicklin School of Business at Baruch College and incorporates both fundamentals and technicals in his analysis. David authors the daily briefings for the U.S. at DailyFx.com.

Q: Egypt has provided a new political factor in the markets to take note of this week. Can we look at the typical safe haven currencies to strengthen in the case of the situation becoming unstable? Which currencies would be worthwhile to monitor throughout this political crisis?

As tensions in Egypt intensify, the U.S. dollar and Swiss franc would be the two main beneficiaries from a flight to safety, while demands for the Japanese Yen could accelerate over the near-term as carry interest wanes. With political David Songuncertainties bearing down on market sentiment, the Australian and New Zealand dollar are certainly at risk for a sharp reversal, and we may see a large break to the downside as investors scale back their appetite for risk.

Q: We have seen the euro continue to increase against the US dollar as well as a sharp rise in the futures commitment of traders report. Do you feel this is a fundamental change in sentiment for the euro that may last? Has the market put aside the worries of the sovereign debt crisis?

Indeed, demands for the euro have increased in recent weeks, but the short-term shift shouldn’t last for too long as European policy makers maintain a relaxed approach in addressing the sovereign debt crisis. With the turmoil in Egypt taking center stage, it seems as though the political tensions in North Africa have taken the spot light off of Europe, but the single-currency remains at risk as the EU fails to address the root cause of the crisis. It will certainly take some time to strengthen the European financial system as the governments operating under the fixed-exchange rate system face rising borrowing costs, and the risk for contagion may intensify over the coming months as the region copes with an uneven recovery.

Q: The US nonfarm payrolls government job report is due on Friday with the daily FX calendar showing an early projection of 135,000 jobs to be gained for January. Could a strong job result signify to the market a solid recovery is occurring in the US and would this necessarily coincide with US dollar strength?

A positive U.S. employment report could trigger a bullish reaction in the greenback, but the labor market still has ways to go to recoup the 8.5M job lost during the financial crisis. A 135K rise in non-farm payrolls is certainly a step in the right direction, but we would need to see a larger pick up in employment to underscore a solid recovery. Until we see the U.S. economy adding 500+K jobs on a monthly basis, the Fed is likely to retain a weakened outlook for growth and inflation, and the central bank may see scope to expand monetary policy further later this year as it aims to bring down unemployment.

Q: The British pound has had an interesting few weeks with a rise on higher than expected inflation and a potential outlook for a rate increase to a decline on worse than expected economic growth. Is the British currency inclined to show weakness on the outlook of the weak economic growth?

The British Pound may come under pressure this week as we expect the economic developments to reinforce a weakened outlook for future growth, and the risks for a double-dip recession could materialize going forward as the tough austerity measures dampen the prospects for a sustainable recovery. However, in light of the recent comments by the Bank of England, the hawkish tone held by the central bank should help to prop up the sterling, and the exchange rate may consolidate going into February as investors speculate the MPC to gradually normalize monetary policy later this year. In turn, the sterling may trend sideways ahead of the next interest rate decision on February 10, and there could be a growing split within the committee given the opposing views on growth and inflation.

Q: Does the GBP/USD seem to be overvalued at the moment near 1.6000 exchange rate?

Given the recent economic developments from the U.S. and U.K., a case could be made that the British Pound is overvalued after we saw the economy unexpectedly contract in the fourth-quarter. As the new coalition in the U.K. takes extraordinary steps to balance the budget deficit, the tough austerity measures are likely to bear down on the recovery, and the risk for a double-dip recession may materialize over the coming months as the government withdraws fiscal support. The recent strength behind the British Pound appears to be coming off of the hawkish tone held by the Bank of England, and the sterling may continue to retrace the decline from back in November as investors speculate the central bank to gradually normalize monetary policy later this year.

Q: The Reserve Bank of Australia’s interest rate decision is out this week with the RBA holding the interest rate steady. Due to it positive correlation with risk, do you feel the Aussie may be a risky prospect this week with a political crisis in Egypt and rate expectations holding steady?

As the Reserve Bank of Australia maintains its wait-and-see approach, a rise in risk aversion (flight to safety) coming off of the political crisis in Egypt could spark a sharp reversal in the Australian dollar. With Cyclone Yasi is expected to hit Australia this week, the natural disasters are likely to hamper the outlook for future growth as the region copes with the worst flood in eight decades, and the central bank may retain a neutral outlook for future policy as it expects inflation to stay within the 2-3 percent target over the medium-term.

Thank you David for taking the time for participating in this week’s forex interview. To read David’s latest currency analysis and trading strategies you can visit DailyFx.com.