Forex Daily Market Commentary

By GCI Forex Research

Fundamental Outlook at 0800 GMT (EDT + 0400)

USD

With much of Asia on holiday, the FX price action was relatively subdued. The dollar did strengthen marginally on signs of escalation in Egypt which coincided with a general stalling of the risk rally. EURUSD traded 1.3771-1.3817, USDJPY 81.49-81.76. A better ADP print also helped the dollar’s cause earlier, but market participants are wary about extrapolating from this reading to Friday’s official non-farm payrolls report.
ADP private payrolls for January were +187k (cons. +140k). Our US economists still forecast a below-consensus gain in Friday’s jobs report. Fed Chairman Bernanke is due to speak on “The Economic Outlook and Macroeconomic Policies.” We think he will have to depart significantly from the latest FOMC statement to really affect the dollar but his comments on inflation will be interesting as he recently said the risk of deflation has “receded considerably,” while the FOMC noted only that “measures of underlying inflation have been trending downward”.
EUR

Today’s ECB policy decision is expected to be a non-event and the focus again falls on President Trichet’s subsequent press conference. Hawkish overtones are expected given the latest Eurozone CPI print for January came in at +2.4% y/y, which is well above the ECB’s target of “below, but close to 2%”. Our European economists do not expect a policy rate hike until Q4.
S&P downgraded Ireland one notch to A-, keeping the rating on watch negative. However, both Moody’s and Fitch rate the sovereign one notch lower still.
European Council President Van Rompuy said the EU is planning to announce a comprehensive solution to the sovereign debt crisis by March 25 – the scheduled date of the second of two upcoming EU Summits.
GBP

MPC members Charles Bean and Andrew Sentance offered different views on prospective monetary policy. Sentance sounded hawkish as usual, suggesting that the weak Q4 GDP report released last week should not be considered too significant and is likely no more than a fluctuation.
Bean on the other hand seemed in no hurry to hike the policy rate, noting that the current policy setting is “sensible” given that the recovery is “fragile”. He also forecast that inflation will “come back down towards the target” in the absence of further external shocks.
Construction PMI came in well above consensus at 53.7 for January, suggesting that activity has bounced back following the adverse weather in December. The more important Services PMI is due today.

TECHNICAL OUTLOOK
EURCHF 1.3069 resistance.
EURUSD BULLISH Climb through 1.3888/1.3948 resistance zone would expose 1.4086. Initial support lies at 1.3690.
USDJPY BEARISH Momentum is negative; scope for 80.93 and 80.54 next. Resistance at 82.15.
GBPUSD BULLISH Move above 1.6299 key high would open up the way towards 1.6379. Support lies at 1.6128.
USDCHF BEARISH Focus is on 0.9301; break of the level would leave little support till 0.9018. Initial resistance is at 0.9482.
AUDUSD BULLISH Recovery found resistance at 1.0149 Fibonacci level; break of this would expose 1.0256. Support lies at 0.9964.
USDCAD BEARISH Expect losses to target 0.9838/20 support area. Near term resistance at 0.9916.
EURCHF BULLISH Rise above 1.3002 exposes 1.3069. Support at 1.2873.
EURGBP BULLISH Break of 0.8619 would expose 0.8672/91 resistance zone. Initial support lies at 0.8510.
EURJPY BULLISH Need to break through 114.01 to confirm the bull trend and aim for 114.94 ahead of 115.68. Support lies at 111.28.

Forex Daily Market Commentary provided by GCI Financial Ltd.

GCI Financial Ltd (”GCI”) is a regulated securities and commodities trading firm, specializing in online Foreign Exchange (”Forex”) brokerage. GCI executes billions of dollars per month in foreign exchange transactions alone. In addition to Forex, GCI is a primary market maker in Contracts for Difference (”CFDs”) on shares, indices and futures, and offers one of the fastest growing online CFD trading services. GCI has over 10,000 clients worldwide, including individual traders, institutions, and money managers. GCI provides an advanced, secure, and comprehensive online trading system. Client funds are insured and held in a separate customer account. In addition, GCI Financial Ltd maintains Net Capital in excess of minimum regulatory requirements.

DISCLAIMER: GCI’s Daily Market Commentary is provided for informational purposes only. The information contained in these reports is gathered from reputable news sources and is not intended to be U.S.ed as investment advice. GCI assumes no responsibility or liability from gains or losses incurred by the information herein contained.

GBP/USD- Technical Update

By Anton Eljwizat

A bullish movement in GBP/USD has pushed a number of technical indicators into the over-bought territory. As I will demonstrate below, the GBP/USD may very well be heading for a reversal, as a bearish cross has taken place on the Slow Stochastic. In addition, the Relative Strength Index (RSI) indicates that the price of this cross currently floats in the overbought territory, signaling downward pressure. Forex traders can take advantage of this impending movement by having their Entry Orders in place to capture this reversal. Don’t forget your Stops and Limits!

GBP-USD 3-2-2011

Forex Market Analysis provided by ForexYard.

© 2006 by FxYard Ltd

Disclaimer: Trading Foreign Exchange carries a high level of risk and may not be suitable for all investors. There is a possibility that you could sustain a loss of all of your investment and therefore you should not invest money that you cannot afford to lose. You should be aware of all the risks associated with Foreign Exchange trading.

Forex Market Wavering amid Egypt Protests

Source: ForexYard

Yesterday’s flare-up in Egypt between forces supporting president Mubarak and those calling for his ouster has apparently added to a rising atmosphere of uncertainty in the region which has pulled some investors away from their recent risk-taking.

Economic News

USD – USD Consolidating ahead of Friday’s Non-Farm Payrolls

Despite the sinking value of the US dollar versus most of its primary currency counterparts, the greenback did undergo a modest correction in yesterday’s afternoon trading sessions. Following the publication of positive employment change in the American private sector over the previous month, as shown by Wednesday’s ADP employment change estimate, the US dollar retraced approximately 100 points against the euro, and 50 points versus the British pound.

The EUR/USD has been surging over the past several trading days, hitting a recent high of 1.3860 before paring its gains and currently resting steadily at 1.3810. The USD/JPY has likewise been in decline but underwent a modest spike following the publication of yesterday’s ADP figures. The pair is currently trading at 81.61.

Today will likely be less significant for the US dollar than many traders expect, regardless of the heavy news day ahead. The reason is because it is the day before Friday’s Non-Farm Payroll data for the month of January. Typically around this time of the month, the greenback consolidates its value near a breaking point prior to Friday’s publication. Traders should expect to see the USD holding steady near its current price values until Friday’s release.

EUR – Egyptian Turmoil Weighing on Risk Appetite, Weakening EUR

The euro has been gaining only modestly over the last several trading days as Middle East turmoil puts risk appetite in the region on unstable ground. The 17-nation common currency has undergone a gradual ascent versus the US dollar as investors have moved away from safe-havens and into the higher-yielding assets of European and Pacific currencies.

Against the dollar, the EUR has moved up from the low of 1.2873 touched on January 10 to as high as 1.3860 yesterday. However, yesterday’s flare-up in Egypt between forces supporting president Mubarak and those calling for his ouster added to a rising atmosphere of uncertainty in the region which pulled some investors away from their recent risk-taking.

With the European Central Bank (ECB) announcing its latest decision on short-term interest rates today, there is a good chance that the EUR will receive additional volatility than is commonly experienced. The continued unrest across the Middle East also adds to the tug-of-war between market optimists and market pessimists. The direction of the euro is unclear for today, but traders should expect wide swings in value as global events play out and affect risk appetite.

JPY – Japanese Yen Mixed as Markets Balance Optimism and Uncertainty

The Japanese yen experienced mixed results against most of its main currency rivals yesterday. The uncertainty across the Middle East and the recent atmosphere of market optimism in the economies of North America and the Pacific has created a strange mixture between increased risk appetite and regional uncertainty.

The yen has responded by weakening against most of its rivals, but strengthening against traditional safe-havens like the US dollar and Swiss franc. With no news expected out of the Japanese economy this week, the yen looks to be continuing to respond to the valuations of the other major currencies. Middle East turmoil will no doubt continue to factor into region-specific risk taking, but optimistic employment figures from the US could offset any shifts in investment portfolios in regards to risk.

Crude Oil – Middle East Unrest Driving Oil Prices Higher

The price of Crude Oil continues to climb following this week’s earlier spike above $90 a barrel. The unrest across the Middle East has many speculators anticipating a decline in output, and thus supply, over the next several weeks. Prices have begun to soar as a result. The decline in US dollar values has only added to the bullishness in Crude Oil prices.

The shifting atmosphere in Egypt and its Arab neighbors has caused a stir among analysts who just prior to the outbreak of unrest were deciding on whether or not the global economy had finally entered a serious recovery. Any revolutionary changes in the political map of the Middle East could greatly impact oil output, pricing, and agreements, carrying over a significant effect on the price of oil. Traders should continue to eye the events in Egypt to gauge whether or not there will be a severe disruption in oil outflows.

Technical News

EUR/USD

The recent sharp climb in value for this pair has pushed the daily chart’s Relative Strength Index (RSI) into the over-bought territory, suggesting strong downward pressure. An impending bearish cross on the weekly Stochastic (slow) supports this notion. Going short in the near future appears to be a preferable strategy for the remainder of the week.

GBP/USD

The price of this pair appears to have breached the upper border on the daily chart’s Bollinger Bands indicating a strong price break-out. The imminent bearish cross on the daily and weekly charts’ Stochastic (slow) oscillator suggests that this movement may be short-lived. Traders may want to enter short positions with tight stops on this pair to capture potentially lucrative downward corrections.

USD/JPY

There appears to be a fresh bullish cross on the daily chart’s Stochastic (slow) for this pair, highlighting mounting upward pressure. A recent breakthrough on the lower border of the daily chart’s Bollinger Bands supports this notion. Going long may turn out to be the best decision over the next few days.

USD/CHF

As this pair bounces against its record low price near 0.9300, it appears to be meeting significant support. This support level has pushed the pair temporarily back above 0.9400 and indicators seem to suggest that it will continue to move bullish as the day progresses. Holding onto your long positions appears wise today.

The Wild Card

USD/ZAR

This exotic pair has recent spiked upward enough to push many indicators into over-bought territory. The daily chart’s RSI floats high above the 70 line, suggesting strong downward pressure. The daily and weekly charts’ Stochastic (slow) also reveals impending bearish crosses. The pair also looks to be approaching a significant resistance level at 7.2000. Forex traders have a great opportunity to catch the downward swing of this pair as it appears to be preparing for a rapid correction.

Forex Market Analysis provided by ForexYard.

© 2006 by FxYard Ltd

Disclaimer: Trading Foreign Exchange carries a high level of risk and may not be suitable for all investors. There is a possibility that you could sustain a loss of all of your investment and therefore you should not invest money that you cannot afford to lose. You should be aware of all the risks associated with Foreign Exchange trading.

The US dollar advanced on Wednesday as Egypt situation worsens

The US dollar advanced against the euro and Japanese Yen as the Egypt political crisis took a more intense turn on Wednesday. Investors took fresh positions in the US dollar perceiving it to be the safe haven currency on the crisis.

The dollar index DXY which measure the US dollar’s performance versus its major six counterpart currencies gained to 77.127 as compared to 76.008 on Late Tuesday. The Euro declined to 1.3805 against the greenback as compared to $1.3835 on Tuesday’s late trading session. The single currency reached its highest since November to 1.3862 in earlier trading sessions.

The greenback also advanced against the Japanese Yen to 81.58 as compared to 81.40 on late Tuesday.

On the latest news on Egyptian situation the president Hosni Mubarak disclosed that he intends to leave the office in September and is not looking forward for re-election. Director of currency research Kathy Lien from GFT commented, “This attempt to ease the unrest fell on deaf ears as protesters call for Mubarak to step down now and not seven months later, the continued rioting indicates that the problems in Egypt are not behind us, causing some investors to pare back their risk trades.”

The British Pound advanced to 1.6183 against the US dollar on Wednesday’s North American trading session as compared to $1.6148 on Tuesday. The reason behind the gain of Pound Sterling was the increased purchasing managers’ index depicting more construction activity for the month of January as compared to December.

The Australian dollar declined to 1.0086 versus the US dollar as compared to $1.0129 on Tuesday. The recent threat of Cyclone Yasi on shores of North Queensland has ceased all the key ports for base metal mining operations resulting in depreciation of Australian currency.

About the Author

Daily forex trading news written by Rehan from DailyForexTrade.com

Options Trading, Silver Butterfly and Seasonality

By J.W. Jones, optionstradingsignals.com

One of the notes that I keep stuck to my computer reads “remember seasonality”. For those just now becoming familiar with options, you may assume I am reminding myself not to forget deer season or the opening of the season for striper fishing. While these are important dates for many of us to remember, I am reminding myself that there are distinct periods within the options expiration cycle where certain trades work better and give a competitive advantage to the trader who recognizes and takes advantage of this seasonal pattern.

As a quick review, remember that option cycles historically have been established with monthly expiration cycles. For the knowledgeable option trader, different time periods within this monthly cycle are known to have distinct characteristics. The primary reason for these different characteristics is the “non linear” decay of time premium.

This “non linear” behavior simply means that the decay of time premium accelerates as expiration approaches; for us visual thinkers, envision a snowball rolling downhill. The recent arrival of weekly options has opened a whole new concept of seasonality for traders using those vehicles, but that is a discussion for a future time.

The butterfly is one of the option constructions most affected by seasonality. The last two weeks of the monthly option cycle is even called “butterfly season” by many option traders. The classic behavior of butterflies is that they are only slightly impacted by changes in the price of the underlying early in the cycle and exhibit increasing response to price change late in the option cycle. This peculiar functional characteristic has frustrated many traders who have tried to employ butterflies early in the options cycle and have routinely seen the correctly predicted price action result in minimal or no profit in the position.

For those of you unfamiliar with this construction, let’s look at an example. First and foremost, we need to be aware of our position in the cycle. February options expire Friday, February18, this is 17 days from today. That is close enough to the mid point of the cycle to be open season for butterflies.

The essential structure of a butterfly is to establish a spread in either calls or puts that has the structure +1/-2/+1. The spread uses options which all expire in the same month. A variant of the classic butterfly, the iron butterfly, uses both puts and calls but this metallic beast will need to be the subject of another post.

Since a picture is worth “a thousand words”, let’s look at an example of a butterfly structure before we discuss some of the nuances of which the trader must be aware. Now, don’t go out and put this on, it should be used only as an example and not a trade recommendation or financial advice! This trade is to demonstrate the butterfly structure and to lead us to some functional considerations. The trade is that of a put butterfly in SLV.

As you can see the position is slightly bearish, with maximum profit occurring at expiration at the SLV price of 26. For those who are bullish or even neutral, a similar trade could be constructed to reflect that viewpoint. An important point is to notice the difference in the solid blue line, the expiration P&L graph, and the intermediate time frames indicated by the broken lines. As is readily apparent, the sensitivity of the position to price movement is much less at points in time prior to expiration.

A key point to remember when trading butterflies is that maximum profit is ALWAYS when the price of the underlying, in this case SLV, is at the short strike at expiration. By remembering this fundamental characteristic, an option trader can center the butterfly on his projected price target in order to maximize profit.

Another fundamental characteristic of the butterfly construction is that this structure usually works best in an implied volatility environment that is in the upper half of its historic range. What is the reason for this characteristic? The options we sell short in the center of the butterfly represent a major profit engine for the structure. If these options are somewhat “rich”, as indicated by the calculated level of implied volatility, they provide a substantial boost as the time premium we are short decays into expiration.

How does the butterfly under discussion fit into the volatility consideration? Below is the volatility chart for SLV. The brown line is the volatility actually demonstrated in the market recently, and the blue line is the implied volatility calculated from actual option trades. As you can see, we are currently in the mid range of volatility for this underlying. This is a good place to be for an options trade, and provides an additional “tailwind” for the trade together with our current position in the time of the option expiration cycle.

Successful option traders understand the limitations and advantages of the vehicles available to them. The butterfly can deliver outstanding risk/reward scenarios, and the probability of its success is enhanced by understanding the nuances of its use.

Get My Trade Ideas Here: http://www.optionstradingsignals.com/profitable-options-solutions.php

J.W. Jones

Forex Update: ADP Employment rises by 187K jobs. US Dollar mixed in Trading.

By CountingPips.com

The US dollar has mixed against the other major currencies in the forex markets as US jobs data released today showed a better-than-expected result in January. The dollar has gained ground on the day versus the euro, Japanese yen, Swiss franc, Australian dollar and the New Zealand dollar while trading lower against the Canadian dollar and the British pound sterling.

The US stock markets, meanwhile, have been slightly lower in morning trading after yesterday’s sharp rise with the Dow Jones industrial average lower by almost 10 points Currency Trend Analysiswhile the NASDAQ and S&P 500 have decreased by roughly 0.5 points and 3.5 points, respectively.

In commodities, oil has edged up slightly by $0.63 to the $91.40 level while gold futures have decreased by $2.20 to trade at the $1,337.40 level at time of writing.

Today’s ADP private employment report showed that private companies hired a total of 187,000 workers in the month of January. This data follows a downwardly revised gain of 247,000 workers in December after the original report had shown a rise of 297,000 workers.

Market forecasters and economists were expecting the jobs report to come in with a gain of approximately 140,000 jobs for the month. The advance in private January jobs continues a streak of 12 straight months of job increases for the ADP report.

The service sector saw an increase of 166,000 workers in January and the goods-producing sector registered a gain of 21,000 workers. Manufacturing jobs rose by 19,000 workers while the construction sector declined by 1,000 workers. The financial sector rose by 3,000 workers in January.

Large businesses added 11,000 workers for January while medium-size businesses hired 79,000 workers. Small businesses or companies with less than 50 workers also saw employment payrolls climb by 97,000 workers for the month.

The market-moving US nonfarm government payroll report is scheduled to be released on Friday at 13:30 GMT. Last month, the government report showed 103,000 workers were added to payrolls and the unemployment rate was at 9.4 percent. Early forecasts are looking for the payrolls report to increase by 135,000 workers.

My GOLD Technical Trading Analysis: What the Market is telling us

By Adam Hewison – Despite all the turmoil in Egypt and the Arab world, gold has stubbornly refused to rally. This probably causes great concern amongst the gold bugs and the folks who are bullish on gold.

As we have mentioned before many times on this blog, “perception is more powerful than fundamentals.”

While the gold bugs argue that the market is being manipulated, I am more of a realist and respect what the market is actually doing. The big question on everyone’s mind is: Why are food prices and other commodity markets soaring, while gold is dismally staying down in the $1,330 area?

MarketClub’s Trade Triangles are all Red, meaning that the trend for gold is likely to remain negative or at best move in a sideways fashion.

My best estimation at this point in time is that we are going to see more sideways action and probably some recovery from current levels. However, I would like to see some concrete evidence that the market has actually put in a low and that we will see a recovery in this yellow metal in the future.

One thing I can say, historically our monthly RED Trade Triangles have not been successful in gold. You would have been more successful fading the RED monthly Trade Triangle signal and going long gold.

Before getting, “gung ho” on this approach, you will be better off waiting for a green weekly trade triangle to kick in which would indicate that the market has probably made a low.

That is the main reason why, we recommend using the weekly Trade Triangles for trend, and daily Trade Triangle’s for timing.

In this short video, I explained what I mean and show you concrete examples of how you can use this strategy to make money.

As always our videos are free to watch and there is no registration requirements. Our only request is that you tell your friends, Tweet and Facebook about this blog posting. We would also enjoy hearing from you, so please feel free to comment on this blog about this video.


Enjoy,
All the best,
Adam Hewison
President of INO.com and co-founder of MarketClub

To see more of Adam’s videos click here or sign up for Adam’s Free 10-part Professional Trading Course.

Technical Tip – GBP/USD Breakout

By Russell Glaser

The GBP/USD appears set to end its 5-month period of sideways trading as the pair is currently testing the upper boundary of a consolidation pattern.

A surprisingly strong January has helped the Cable come off of its December lows and the pair is now testing a trend line that falls off of the August 2009 high. The trend line comes in this week at 1.6160.

Should the GBP/USD breach this trend line, the path higher is littered with resistance levels. The first target would be the October 20010 high at 1.6300, followed by the January 2010 high at 1.6460. This price level should have added significance as it coincides with the falling trend line of the 2007 high. Further resistance is found at the November 2009 high of 1.6880, followed by the August 2009 high of 1.7040.

If the long term trend line holds and the GBP/USD will move lower, support is located at the previous week’s low of 1.5750, followed by the rising trend line off of the May lows which comes in this week at 1.5520. Further support may be found at the December 2010 low of 1.5340.

While it may not be relevant at this time, a distinct head and shoulders pattern is identifiable with the neck line below the September and December lows of 2010. A move above the 1.6300 level would nullify this reversal pattern.

GBPUSD_Weekly

Forex Market Analysis provided by ForexYard.

© 2006 by FxYard Ltd

Disclaimer: Trading Foreign Exchange carries a high level of risk and may not be suitable for all investors. There is a possibility that you could sustain a loss of all of your investment and therefore you should not invest money that you cannot afford to lose. You should be aware of all the risks associated with Foreign Exchange trading.

It’s About Time That Filinvest Land (FLI)es!

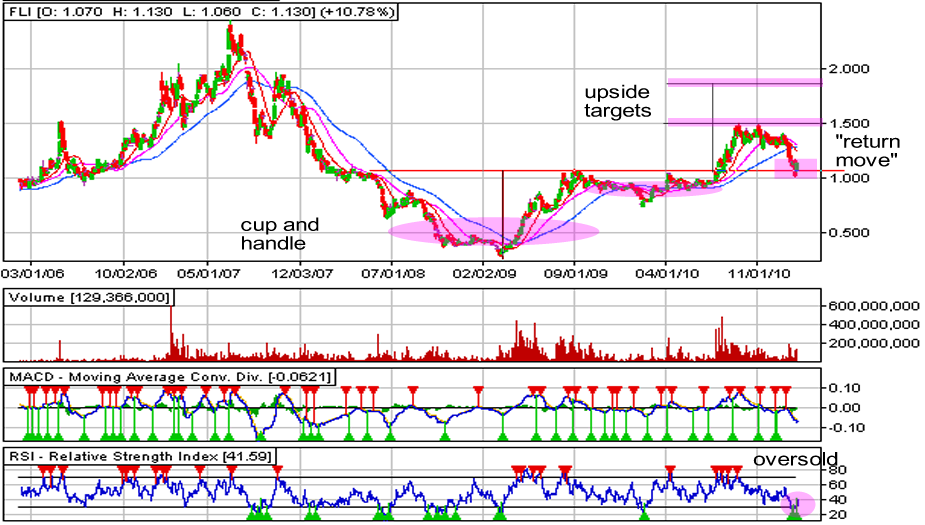
Filinvest Land, Inc. or FLI in the Philippine Stock Exchange did not get the award for the most outstanding stock in 2010. Despite this, it was still able to book some descent amount of gains. In fact, it rose by 45.56% when it opened at PHP 0.90 in January 2010 and closed at PHP 1.31 at the end of the year. Not bad if you ask me. Looking at its chart above, FLI was actually trading sideways during the first half 7 months of the year before it swung higher to break out from a cup and handle formation in August. And in a little more than a month following the breakout, it was able to mark a high at PHP 1.50. However, luck appeared to reverse when it gradually fell to a low of 1.060 yesterday.

Some people were actually asking me if FLI was a good buy at yesterday’s levels. My answer was it was not since it already fell and closed below the former neckline of the previous cup and handle which was supposed to act as a support. I mentioned that it first needed to move its head above the neckline in the next few days for me justify a technical buy on the issue. And guess what, the stock proved to be resilient as it was able to move back above the neckline. Yesterday’s gain of 10.78% or so was a missed opportunity, I know. But in my opinion, it’s always better to play things if the probabilities are on your side. Yesterday, the stock had a higher probability of losing than winning given the technical reason that I mentioned above, notwithstanding the uncertainties surrounding Egypt. And now that the support has held, I could say that it could once again revisit its former high at PHP 1.50 or its upside target of PHP 1.85.

On the fundamental side, the company earlier disclosed its plans to launch new real-estate projects this year that are worth about PHP 13 billion. It said that is is aiming to sell around 14,000 residential units this 2011, almost twice of the 7,300 units last year. It also noted that its sales revenues for 2010 amounted to PHP 10 billion which was 42% better than in 2009. Borrowing costs (housing loans, etc.), is expected to somewhat remain subdued for the rest of the year. In fact, some commercial banks are even lower its interest rate at least for the first year to 5.88%, encouraging more people to purchase real properties. This environment of low interest rates plus the continuing pick up of the Philippine economy and of course the FLI’s plans for new projects could really play for the company.

More on LaidTrades.com

What To Watch, February 2nd, 2011

Wednesday, February 2nd will kick off earnings with AOL (AOL), Time Warner (TWX), Mattel(MAT), Whirlpool (WHR), Nasdaq OMX (NDAQ), and Hershey (HSY). Expect earnings releases from News Corp (NWSA), Hartford Financial Services (HIG), Visa(V), Vulcan Materials (VMC), Green Mountain Coffee Roasters (GMCR), Yum! Brands (YUM), and BMC Software (BMC) in the latter part of the day. ADP will announce its Employment Change report early on in the day at 8:15AM.