Commodities & Options: USO Options Trade Setting UP!

By J.W. Jones, optionstradingsignals.com

At the risk of stating the obvious, the recent market action in the commodities has been manic with wild gyrations of price in a wide variety of basic materials, metals, and energy. Given these wild fluctuations in price, I thought we could look at an options trade in USO that gives a high probability of success.

In order to give a bit of a conceptual framework for this sort of trade, let me share the way I look at these. Development of precision high altitude bombing during World War II resulted in a dramatic reduction in casualties while inflicting devastating consequences to enemy forces. I view the sort of option strategy described below as the equivalent of high altitude precision bombing. We will extract substantial profit without putting ourselves at high risk of damaging anti-aircraft fire.

As is shown on the daily price chart below, there is substantial support in the region of 35.60-36 provided by a recent swing low and the 200 period moving average.

In selecting the structure of option trades, I usually like to consider the volatility environment in which we currently operate. This is important because a very strong tendency of implied volatility is reversion to its mean. The knowledgeable trader factors this into his trades in order to put the wind at his back as much as possible. Trades can be selected and constructed to benefit (positive vega trades) or suffer (negative vega trades) from increases in implied volatility. As you can see in the chart below, implied volatility is currently in the lower quartile of its historic value for this specific underlying:

Given the current low volatility, let us look at a strategy that gives us substantial profit from an altitude of 50,000 feet and the ability to roll the trade forward for additional substantial profit. This trade is structured as a “ratio calendar spread”. Now don’t go getting hung up on the name, it is simply a two legged trade in which we buy a longer dated in-the-money call and sell a smaller number of out-of-the-money calls. The trade is diagrammed below:

For those getting used to these sorts of trades and trying to form an organizational framework, the trade can be thought of as a basic calendar spread where an additional contract of the long options is purchased. The addition of this extra contract removes the upside limit on our profitability which would exist in an ordinary calendar spread. As is often the case in option trading, this trade can also be thought of as a “first cousin” to a covered call structure where the long in-the-money contracts serve as a surrogate for long stock. I find it helpful to think of the various option constructions as individual members of several different families. Each family has a number of “family traits” that help make sense of the large number of potential constructions available to the options trader.

One of the characteristics of this family under discussion is the “Sham Wow” factor- “but wait-there’s more”. The “more” in this trade is the ability to “roll” the short calls forward as they expire or, more prudently, as they reach inconsequential value. For example, this trade would have been initiated by selling the February 37 calls at a value of around 57¢. When these calls reach minimal value, let us say 10¢ for discussion, they could be bought back, and the March calls sold to capture substantial additional premium. This process can continue for April, May, June, and July. These additional sales give the opportunity to reap additional profit for the trade.

The risks in the trade are:
1.USO breaks support and continues to sell off
2. Volatility collapses on the long leg of the trade

I have discussed both of these factors in the price chart and volatility chart above when I was developing the logic of the trade. While no guarantees exist for the behavior of either price or volatility, the current trade represents a reasonable balance between risk and probability in my opinion.

As with all our discussions, these considerations are presented for educational purposes and do not represent a recommendation. This is not a solicitation nor should it be considered financial advice. I am simply trying to demonstrate how to use the knowledge of option behavior to construct trades that benefit from high probability events. Bombs away!

Get My Trade Ideas Here: http://www.optionstradingsignals.com/profitable-options-solutions.php

J.W. Jones

The Greenback remains strong against the counterpart currencies in overnight trading

The US dollar gained versus its major counterpart currencies on Thursday overnight trading session as investors are closely watching out for auction of 30-year US treasury bonds and direction of monetary policy to be disclosed by Bank of England.

The investors and traders are hoping for increase in US treasury yields. Further the pair USD/JPY is the most reactive to movement of US Treasury yields as Japan government owns substantial holdings in American debt. Investors keep a very close watch on US bond auction as higher Treasury yields happen to be very favorable for the greenback.

The US dollar remained under selling pressure on Wednesday’s trading session as the US Treasury yields declined after overwhelming bond auction in reaction to remarks of US Federal Reserve’s chairman Ben Bernanke.

The dollar index DXY which measure’s the US dollar’s performance versus its six major rival currencies gained to 77.861 as compared to 77.661 on Wednesday.

The Euro plunged to 1.3672 versus the US dollar in Asian trading session on Thursday as compared to 1.3721 on late Wednesday. The British Pound also declined to 1.6070 against the greenback as compared to 1.6099 on Wednesday’s North American trading session.

The Pound Sterling has been moving on solid ground since last week as the Bank of England announced its decision to keep its lending rate unchanged at 0.5 percent in the last week.

Currency strategist from Barclays Capital commented, “We continue to believe that the BoE will resist raising rates until later this year and expect the first rate hike in Q4 11.”

The US dollar surged versus the Japanese Yen to 82.66 in Asian session as compared to 82.42 on Wednesday’s late trading session.

About the Author

Daily forex trading news written by Rehan from DailyForexTrade.com

Gold Trading: Are Gold Miners giving us a flashing sign?

By Chris Vermeulen, thegoldandoilguy.com

The past couple weeks I have been keeping a close eye the price of gold and the gold miners index. I check to see if its pointing to higher or lower prices in the near future using inter-market analysis, price and volume, along with technical analysis. At this time the charts are still pointing to lower prices in the coming days or weeks.

Taking a look at the daily chart of Gold
As you can see it has formed a bear flag with declining volume and the price has drifted up into a resistance level. This combination typically leads to lower prices.

With international fears floating around and the fact that inflation has started does make me a little weary of shorting gold but one thing I have learned over the years is that trading on fundamentals and news clips seen on TV is not a reason to pass on a setup if one forms in the coming days. The only thing that pays in the stock market is when the price action goes in your favor. This is why I focus on price, volume and momentum while avoiding what others are saying elsewhere. Trading is a numbers game and I put my money on the table when the odds are clearly favoring one direction. Unfortunately I am trading trades against what the masses think and feel is the right thing to do.

Gold Miner stocks are forming much of the same pattern as gold bullion but today (Wednesday) the chart actually put in a possible reversal candle. If this is correct then we should see gold and most likely silver follow suit tomorrow by moving lower and possibly even start a correction.

Gold Swing Trading Conclusion:
In short, gold stocks sold off strong today while both gold and silver closed only slightly lower. When this happens near a resistance zone, with a bearish price and volume patterns I start to look for a shorting opportunity. It has yet to happen and I’m not going to jump the gun, but I am waiting for the right opportunity to take advantage of these trading instruments.

If you would like to get my daily trading analysis and swing trade alerts please join my newsletter: http://www.thegoldandoilguy.com/trade-money-emotions.php

Chris Vermeulen

Forex Daily Market Commentary

By GCI Forex Research

Fundamental Outlook at 0800 GMT (EDT + 0400)

USD

The dollar recovered lost ground during the Asia session, after an earlier bout of weakness in the aftermath of Fed Chairman Bernanke’s speech. EURUSD traded 1.3689-1.3744, USDJPY 82.20-82.60. AUDUSD was hit by a decline in full-time jobs in January. Asian equities are slightly weaker at the time of writing, mirroring small losses on the S&P 500 earlier. Bernanke’s testimony before the House Budget Committee offered little new insight into his outlook for the economy or public policy as he largely reiterated his speech from Feb. 3. He again sounded guardedly optimistic and the only (minor) new information was his acknowledgement of the back-to-back sharp drops in the unemployment rate. Specifically, he said “Notable declines in the unemployment rate in December and January, together with improvement in indicators of job openings and firms’ hiring plans, do provide some grounds for optimism on the employment front.” But he again said, “It will be several years before the unemployment rate has returned to a more normal level. Until we see a sustained period of stronger job creation, we cannot consider the recovery to be truly established.” Atlanta Fed President Lockhart said that the QE2 asset purchase program would stick to buying USTs and would not have its scope widened to include the purchase of municipal bonds. Head of the New York Fed’s Markets Group, Brian Sack, said that there are no signs that the market is facing a shortage of particular Treasury securities.
EUR

EU President Van Rompuy said EU leaders will hold a special summit on March 11 to consider new measures to tackle the sovereign issue. The press continued to report that Bundesbank President Weber may not seek a second term at the Bundesbank, which could eliminate him as a possible successor to ECB President Trichet, whose term ends in October..
The ECB’s Bini Smaghi discussed some potential changes to the EFSF, such as debt buybacks, and said interest rates of 6% would ensure debt sustainability. He also said restructuring would be a plan B for the current crisis, as it could be more costly in the long run.
The IMF said assistance for Ireland would continue despite the political uncertainty. The Irish government said it informed the IMF and the EC of its decision to postpone further capital injections into its banks until the election is completed. The Finance Minister did say that even without these injections, the banks are adequately capitalized.
GBP

Our analysts are with the consensus and expects no change at today’s BoE policy decision, which should mean that no explanatory statement is published. That would shift the focus to the Feb. 23 meeting minutes, when the voting breakdown is revealed. However, our economist does note that “Given that this decision will take place against the backdrop of the quarterly Inflation Report [Feb 16], there is a risk of a surprise vote.” Any vote in favour of a rate hike would likely prove strongly sterling-positive in the very short term. However, over the longer term, monetary policy tightening would likely be viewed as being in conflict with the weak growth outlook.
CHF

While Swiss officials seem less concerned about deflation these days, a bad CPI print today could stir up intervention rhetoric. On the other hand, a strong print would help the Swiss franc, prompting more rhetoric on currency strength. Nevertheless, we remain constructive on CHF
AUD

The AUD fell overnight, despite the creation of 24k new jobs in January, more than consensus expectations of 17.5k. But the mix was not encouraging – part-time jobs accounted for all the increase, and some full-time jobs were lost. The unemployment rate held steady, as expected, at 5.0%. Our Australian economics team notes that today’s data is neither definitively strong enough nor weak enough to provide clear insight into the near-term rate outlook. They continue to expect the next RBA hike in August.

TECHNICAL OUTLOOK
EURJPY breaks 112.92.
EURUSD BULLISH Violation of 1.3741 has made the pair target 1.3779, break of this would expose 1.3826/62. Near term support is at 1.3572.
USDJPY NEUTRAL Rise through 82.67 would expose 82.93 while support lies at 81.78.
GBPUSD BULLISH Expect gains to target 1.6186 ahead of 1.6279/99 zone. Near-term support is defined at 1.6010.
USDCHF BULLISH Focus is on 0.9687 with scope for 0.9764 next; support at 0.9524.
AUDUSD BULLISH Resistance zone lies at 1.0200/56 while near term support lies at 1.0002.
USDCAD NEUTRAL Resistance lies at 0.9978 while initial support is at 0.9869.
EURCHF BULLISH Momentum is positive; focus is on 1.3206/87 resistance zone. Support at 1.2973.
EURGBP NEUTRAL Move above 0.8508 has turned the model to neutral; 0.8577 and 0.8520 mark the near term directional triggers.
EURJPY BULLISH Rise through 112.92 has exposed 114.01/94 resistance zone. Initial support lies at 112.06 yesterday’s low.

Forex Daily Market Commentary provided by GCI Financial Ltd.

GCI Financial Ltd (”GCI”) is a regulated securities and commodities trading firm, specializing in online Foreign Exchange (”Forex”) brokerage. GCI executes billions of dollars per month in foreign exchange transactions alone. In addition to Forex, GCI is a primary market maker in Contracts for Difference (”CFDs”) on shares, indices and futures, and offers one of the fastest growing online CFD trading services. GCI has over 10,000 clients worldwide, including individual traders, institutions, and money managers. GCI provides an advanced, secure, and comprehensive online trading system. Client funds are insured and held in a separate customer account. In addition, GCI Financial Ltd maintains Net Capital in excess of minimum regulatory requirements.

DISCLAIMER: GCI’s Daily Market Commentary is provided for informational purposes only. The information contained in these reports is gathered from reputable news sources and is not intended to be U.S.ed as investment advice. GCI assumes no responsibility or liability from gains or losses incurred by the information herein contained.

Dollar Continues to Strengthen versus Counterparts

Source: ForexYard

The dollar strengthened versus all of its 16 major counterparts in today’s Asian trading, rising near a two week high versus the yen, ahead of a report today that is expected to show U.S unemployment claims declined. The slowly improving job market as well as signs consumer confidence is on a rise boosted optimism about recovery of the world’s largest economy.

The EUR/USD pair dropped over 100 pips from yesterday’s high to currently trade at $1.3633, from $1.3733. The dollar gained to 82.70 yen from 82.36 in New York yesterday.

Later today, traders should follow Britain’s Asset Purchase Facility and MPC Rate Statement. The Bank of England is expected to leave its key lending rate unchanged at a record low 0.5%. Another major indicator to be released today is the U.S unemployment claims, which is expected to show another decline; potentially boosting the USD even further if the outcome is as expected.

Forex Market Analysis provided by ForexYard.

© 2006 by FxYard Ltd

Disclaimer: Trading Foreign Exchange carries a high level of risk and may not be suitable for all investors. There is a possibility that you could sustain a loss of all of your investment and therefore you should not invest money that you cannot afford to lose. You should be aware of all the risks associated with Foreign Exchange trading.

EUR/AUD Likely to Enter Downward Correction

By Anton Eljwizat

The volatile of the EUR/AUD pair continues to be affected by the volatile forex market. The last week has seen a lot of bullish strength in the EUR/AUD pair. However, as I demonstrated below, it seems that the pair’s bullish run may have run out of steam, and a bearish correction could be underway soon. Forex traders can take advantage of this imminent downward movement by entering short positions at an excellent entry price.

• The Chart below is the 4-hour chart for EUR/AUD by ForexYard.

• The technical indicators that are used are the William Percent Range, Relative Strength Index (RSI), and Slow Stochastic.

• Point 1: The Slow Stochastic indicates a bearish cross, signaling that the next move may be in a downward direction.

• Point 2: The Relative Strength Index (RSI) indicates that the price of this cross currently floats in the overbought territory, signaling downward pressure.

• Point 3: The Williams Percent Range signals further bearishness for the pair, which in turn indicates further downward pressure to occur anytime soon.

EUR/AUD 4-Hour Chart
EUR-AUD 10-2-2011

Forex Market Analysis provided by ForexYard.

© 2006 by FxYard Ltd

Disclaimer: Trading Foreign Exchange carries a high level of risk and may not be suitable for all investors. There is a possibility that you could sustain a loss of all of your investment and therefore you should not invest money that you cannot afford to lose. You should be aware of all the risks associated with Foreign Exchange trading.

USD May Turn Bullish Today

Source: ForexYard

Following yesterday’s losses, the US dollar has the potential to stage a bullish correction today providing that this week’s Unemployment Claims figure comes in as predicted. Analysts are currently forecasting a number of around 411K, which if true, would signal a further decline in unemployment in the US.

Economic News

USD – Dollar Begins to Rebound in Asian Trading

Comments yesterday from Fed Chairman Bernanke sent the dollar plummeting against most of its main currency rivals, including the euro and yen. Bernanke voiced concerns regarding the high level of unemployment in the US, which investors interpreted as a sign that the Fed will continue with its stimulus package. The EUR/USD spiked well over 100 pips yesterday, peaking at just above the 1.3740 level. Meanwhile, the USD/JPY fell close to 40 pips, dropping as low as 82.18 during the evening session.

The dollar was able to stage a minor recovery in the overnight session, largely because riskier currencies like the euro lack strong fundamental news to boost them to new highs against the greenback. The EUR/USD fell over 20 pips, and is currently on its way to dropping below the psychologically significant 1.3700 level. The USD/JPY shot up some 25 pips last night, and is currently trading at 82.55.

Today, dollar traders will want to keep a close watch on the latest US Unemployment Claims figure, set to be released at 13:30 GMT. Given Bernanke’s comments yesterday, today’s figure is likely to carry more weight than usual in the marketplace.
Analysts are currently forecasting the number to come in around 411K, which if true, would represent a drop over last week. Barring any surprises, the positive employment data will likely lead to some gains for the dollar in the afternoon session.

EUR – Euro May Turn Bearish Today

The euro saw a bullish day yesterday following pessimistic comments from the US Fed Chairman regarding the current state of the US economic recovery. Against the dollar, the euro surged over 100 pips and was able to breach the psychologically significant 1.3700 barrier. The EUR/GBP moved up some 50 pips before staging a slight downward correction during the overnight session. In addition, the EUR/JPY has gone up close to 100 pips in the last 24 hours, and is not showing signs of a possible reversal.

Today, euro traders will want to pay attention to the fundamental news out of the UK and US. At 12:00 GMT, the UK will release its Official Bank Rate. Analysts are debating whether the MPC will raise national interest rates above their current level of 0.50%. If so, riskier currencies like the British pound and euro are likely to see strong upward movement. That being said, new unemployment claims in the US are expected to drop when the latest figure is released at 13:30 GMT. This could give the US dollar a boost against the euro in the afternoon session.

JPY – Yen Continues to Take Losses as Risk Taking Returns to Marketplace

The JPY took losses against virtually all of its main currency rivals yesterday, as speculation that the demand for Japanese exports may be weakening weighed down on the currency. The GBP/JPY moved up close to 70 pips yesterday, and peaked at just below the 133.00 level. Currently the pair is trading 132.80. The EUR/JPY continues to move up after gaining more than 100 pips in trading yesterday. The pair currently stands at 113.15.

Today, yen traders will want to pay attention to the major news out of the UK and US. Should the UK Monetary Policy Committee decide to leave national interest rates at their current levels, investors may revert back to safe haven currencies like the yen in mid-day trading. Furthermore, if the US reports a drop in the number of people seeking first time unemployment insurance, the yen is likely to see additional gains against the European currencies.

Crude Oil – Crude Down from Yesterday’s Highs

Following yesterday’s brief spike in the price of crude oil, the commodity has remained largely steady throughout the overnight session. Crude jumped as high as $88.14 a barrel yesterday, following the release of the US Crude Oil Inventories figure. Stockpiles in the US are smaller than what analysts had predicted, meaning that demand is up in the world’s largest oil consuming nation.

That being said, the impact of the inventory figure proved to be short lived, and oil is currently trading at $86.75 a barrel. Today, traders will want to pay attention to the effect the US Unemployment Claims has on the dollar. If the dollar turns bullish in afternoon trading, expect crude to continue to drop throughout the day.

Technical News

EUR/USD

Technical data is providing mixed signals for this pair. The 8-hour chart’s Williams Percent Range is currently in the overbought region. At the same time, all indicators on the daily chart are in neutral territory and are not showing a specific direction for the pair. Traders may want to take wait and see approach today, as a clearer picture is likely to present itself later on.

GBP/USD

The Relative Strength Index on the daily chart is currently approaching overbought territory in a sign that a downward correction is likely to occur. Furthermore, the MACD on the same chart has formed a bearish cross. Going short with tight stops may be the preferred strategy today.

USD/JPY

The Stochastic Slow on the 8-hour chart has formed a bearish cross, meaning that downward movement is likely to occur today. Furthermore, the 4-hour chart’s Williams Percent Range is currently in overbought territory. Traders are advised to go short in their positions today.

USD/CHF

The Williams Percent Range on the daily chart is in overbought territory and angling downward, in a clear sign that downward movement is likely to occur. The Relative Strength Index on the same chart is approaching the overbought zone. Going short is likely to be the wise choice today.

The Wild Card

GBP/JPY

The Relative Strength Index on the daily chart is approaching overbought territory in a clear sign that downward pressure exists for this pair. Furthermore, the both the MACD and Williams Percent Range on the 8-hour chart indicate that bearish movement is likely to occur today. Now may be a great time for forex traders to open up sell position for this pair before the downward breach occurs.

Forex Market Analysis provided by ForexYard.

© 2006 by FxYard Ltd

Disclaimer: Trading Foreign Exchange carries a high level of risk and may not be suitable for all investors. There is a possibility that you could sustain a loss of all of your investment and therefore you should not invest money that you cannot afford to lose. You should be aware of all the risks associated with Foreign Exchange trading.

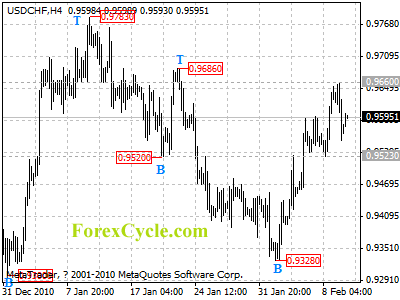
USDCHF remains in uptrend from 0.9328

USDCHF remains in uptrend from 0.9328, and the pullback from 0.9660 is likely consolidation of uptrend. Support is at 0.9523, as long as this level holds, uptrend could be expected to continue and next target would be at 0.9700 area. However, a breakdown below 0.9523 support will indicate that a cycle top had been formed at 0.9660 level on 4-hour chart and the rise from 0.9328 had completed, then deeper decline could be seen to 0.9400 zone.

usdchf

Daily Forex Forecast

Another Breakout Year For San Miguel Corporation (SMC)?

San Miguel Corporation, SMC philippine stocks, Ramon Ang, Ron Acoba, right-angled and descending broadening triangle, daily stock picks, stock market trading

Ramon Ang-led San Miguel Corporation of SMC in the Philippine Stock Exchange was under the spotlight during the last quarter of 2010. From around PHP 74.00 in October 2010, SMC had risen in a relatively fast pace to end the year at PHP 163.80. Now, that’s a gain of almost 120% in less than two months! Anyway, opened 2011 on a positive note when it reached a high of PHP 189.50 during the first 2 days of trading. However, the once ‘on-fire’ stock has apparently lost some of its steam. After reaching the mentioned high until the present, SMC has just moved sideways while marking a low of PHP 150.00 back in January 24.

As you can see from its chart above, SMC has consolidated within a right-angled and descending broadening triangle formation. Notice that when the stock weakened, the red moving average came to the rescue to pick it back up. In the coming days or so, SMC could swing higher if it is able to move past the resistance of the triangle at around PHP 189.00. Check also that the MACD has just made a bullish crossover, indicating a likely move higher soon. In any case, a failure to move past the triangle’s resistance could send it a drift once again or worse back to PHP 150.00.

On the fundamental side, SMC President Ramon Ang said the SMC could double its total revenues this year to PHP 530 billion from PHP 230 billion last year by consolidating its four power-generation plants and Petron Corporation (PCOR). He even went a step further when he said that the company is going to aim for a revenue level of PHP 1 trillion by 2016. Consolidating its other businesses and continually strengthening its infrastructure and power portfolio could be its ticket towards its goal. Moreover, the company will be spending about $4 billion in new investments in energy, telecommunications, and transportation. In fact, the company is already seeking to enter into a venture with Citra Lamotoro Gung Persado (Citra) of Indonesia and Star Tollway Corporation so that they can make a stronger group that can participate in the government’s public-private partnership (PPP) program.

More on LaidTrades.com

The Aussie (AUD/USD) Setup In The 1-Hour Chart

Hello traders! My forex pick for the day is the Australian dollar versus the US dollar currency pair (AUD/USD). What I wanted to show is the possible 5-day symmetrical triangle pattern forming in its 1-hour chart. In case you do now know, symmetrical triangles have 50% chances of breaking out/breaking down and what usually determines the breaking point is where the trend is coming from. If the triangle’s coming from an uptrend, then there would be a higher chance of the price breaking out from the pattern’s resistance. If the triangle’s coming from a downtrend, then there’s a higher chance of a breakdown from the pattern’s support. In the current case of this Aussie pair, the triangle we are seeing is coming from an uptrend. The price is also moving above the 50 and 100-period moving averages which gives an overall bullish bias for the pair. Once the triangle’s resistance gets breached, the upside target price could be the 1.0254 all-time high. I got this by gauging the size of the triangle’s base then added it to the possible breakout point. In case a breakdown occurs, the target price could be 1.0055. However, before it reaches that level, it needs to first clear out the 1.0083 support.

More on LaidTrades.com