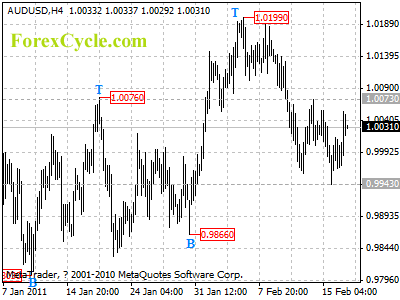
AUDUSD remains in downtrend from 1.0199

AUDUSD remains in downtrend from 1.0199, the price action in the trading range between 0.9943 and 1.0073 is treated as consolidation of downtrend. As long as 1.0073 resistance holds, downtrend could be expected to resume and next target would be at 0.9850-0.9900 area. However, a break above 1.0073 resistance will indicate that a cycle bottom had been formed at 0.9943 level on 4-hour chart, and the fall from 1.0199 has completed, then further rise to 1.0150 area could be seen.

audusd

Forex Signals

Bearish Divergence In Semirara Mining Corporation (SCC)?

Semirara Mining Corporation or SCC in the Philippine Stock Exchange is a subsidiary of DMCI Holdings, Inc. (DMC) which is majority owned by the Consunji family. The name “Semirara” was derived from Semirara Island where the company generates most of its revenue from. They are engaged in exploring, developing, and mining coal resources in the Island which can be found in the Visayan region of the Philippines. The Corporation also has a long term contract with National Power Corporation (NPC) to supply power for the power plants in Calaca, Batangas.

From my colleague’s last post on Semirara Mining last January (kindly check here), he mentioned that there is a cup and handle pattern and the stocks could move higher upon breakout. It did. However, as we take a look at its chart now, there could be a bearish divergence setting up. A bearish divergence forms when a financial instrument records a higher high and the MACD forms a lower high like what’s indicated in the image above. If it indeed is one, it could signal that the stocks are starting to lose its upward momentum which could eventually eventually trigger a break below the 9-month uptrend. In case it does, a significant support could be found at PHP191.30. If the stocks fall further below that level, the next support could be PHP180.00.  Above all, you don’t have to worry – at least at the moment. As long as the 9-month uptrend remains intact, the bulls are still on its side. A rebound from its uptrend line could send it back its immediate resistance at PHP217.00; its all-time high. Even better, a move past above that could make way to PHP230.00.

At this time of uncertainty, I would rather keep my money here. A bearish divergence, like I said, could signal a possible turnaround in the stock but until does, I would still go long. That’s just me though.  Remember that “a trend is your friend.” And scanning through all the local stocks, not one is still riding on a nice uptrend.

More on LaidTrades.com

Oriental Peninsula Resources Group (ORE) To Swing Higher?

Oriental Peninsula Resources Group, ORE philippine stocks, nickel mining, stock market trading, daily stock picks, Ron Acoba, falling wedge

Oriental Peninsula Resources Group’s performance in 2010 was one for the records as it posted a stellar gain of about 450% inside a year. Imagine, ORE’s shares were only trading at around PHP 0.81 during the beginning of last year. And  a little over a month since then, it had exploded and never looked back until it peaked at a high of PHP 4.55 on November 23. From then on, profit taking and consequent sell-off due to negative market sentiment occurred which prompted ORE to gradually slip back to PHP 2.81 yesterday (February 15, 2011).

A lot of people, especially those who got in near the top, are asking whether ORE will still turnaround. In my opinion, I can say there’s a pretty good chance that it will. From a technical perspective, ORE has been trading within a falling wedge pattern. While some of you might think that this is negative given its direction, it is not. On the contrary, a falling wedge is actually bullish since it only depicts a temporary correction in prices. Should ORE break above the wedge’s resistance (around PHP 3.50), it could once again aim for its previous high at PHP 4.55.

Remember, for those who are planning to go long on this stock, it is advisable to wait for a breakout first before buying.

More on LaidTrades.com

Use This Professional Trader’s Technique to Find Value

By Jared Levy, Editor, Smart Investing Daily, taipanpublishinggroup.com

For the past 17+ years, I have followed the financial markets and studied their behavior. One of the main reasons I fell in love with the marketplace was the fact that not only can you control your own destiny so to speak, but every day is new and exciting. Each new trading day brings with it new surprises and challenges to learn and potentially profit from. The financial market is an ever-evolving creature that many try to tame and often fail.

Even with all the change happening day in and day out, there are still some fundamental “rules and guidelines” that govern the actions of the “beast.” To prevent disaster, you need to spot major deviations in these guidelines and have an action plan.

Don’t get me wrong; there are no black-or-white guidelines when it comes to buying or selling a stock. Anyone who tells you X price is the exact buy level and Y price is the exact sell level probably has a bridge they can sell you as well.

I’m talking about rational, collective value reasoning. Masses of professional traders tend to have similar beliefs and if you know what they are you can use them to your advantage.

Let me explain what that means.

Finding “Value”

Both Sara and I have talked about these concepts in the past. Generally, both of us use some sort of common (or sometimes unique) gauge to measure both the fundamental health of a company and perhaps we examine the chart patterns of its price to decide when to buy or sell.

Sara wrote a great article on some ways to check for value in a company back in September 2010. Back then, we both thought there was serious upside opportunity in many areas of the stock market. Here are my notes on valuing the markets back in October.

Fast-forward five months and +33% later in the S&P 500 (SPY), and now finding value may be a bit more difficult…

(Investing doesn’t have to be complicated. Sign up for Smart Investing Daily and let me and my fellow editor Sara Nunnally simplify the stock market for you with our easy-to-understand investment articles.)

Financial Markets Are Forward Looking

The stock market is a leading indicator of the economy and of future value of the companies that are traded within it. Basically, the stock market has a six to 12 month future telescope that it looks through. If the market thinks that a company is going to make more money in the future, traders will often buy the stock now in anticipation of that event.

Earnings reports and news releases are “checkpoints” along the way to make sure that the stock is behaving the way the market anticipates; they help traders “rationalize” their forward-looking thesis. If those checkpoints offer disappointing news, stocks may go down; if the checkpoints offer positive surprises, the stocks may go even higher.

Traders have many ways of evaluating whether a stock is a buy or a sell. There are several common measurements that traders and investors use to confirm their collective thought process. If those measurements are strong, then the market may collectively rationalize an increase in a stock’s price and vice-versa. But what happens when price gets too far ahead of those expectations? Here is one method you can use.

Rationalizing Netflix With a Simple Guideline

One of the most common measurements of value is not the price of the stock itself, but something called the price-to-earnings ratio (P/E ratio). It’s very simple; you take the price of the stock and divide that by amount of money that a company is earning per share in a year’s time. Netflix, Inc. (NFLX:NASDAQ) earned $2.96 per share over the last four quarters. With Netflix trading at an all-time high of $246, it is trading at 83 times annual earnings. That is super HIGH! The higher the P/E, the more expensive the stock and vice versa.

The average P/E ratio of the S&P 500 index over time is about 16 times earnings. (The normal range is about 14-20). Now in all fairness, analysts expect Netflix to earn more money next year, they expect that P/E to drop to about 56 times… Still very high!

You don’t have to be good at math to know that 56 is extremely elevated compared to a market average of 16. Even the great Apple (AAPL:NASDAQ) is only trading at 20 times its past year’s earnings; Google (GOOG:NASDAQ) at about 23 times. So by this measurement alone, Netflix is extremely overpriced.

Let’s not forget that Netflix actually missed on its revenue expectations and gave a weaker revenue growth outlook for the future. So I still cannot understand why investors are pushing this stock to nosebleed levels. But irrational behavior is not uncommon; you just have to recognize it.

When I am unable to “rationalize” selling or buying a stock (in the case of Netflix), I simply walk away or perhaps take the opposite view.

Should You Buy Netflix Here?

As cool of a business model as it has and as much as I can see its revenue growing, there could be a rubber-band effect forming here. When a stock starts to run too far ahead of its earnings and the market, you can imagine it stretching a rubber band further and further. At the first sign of weakness, the rubber band can snap back into place, which would bring Netflix lower in this case.

The basic reasoning for the recent run-up is the expectation that Netflix will add subscribers to its high-margin streaming video service. To be fair, it did add 5.65 million customers last quarter. But its streaming service is not without faults or competition, and you will be hard-pressed to find the latest blockbusters in its streaming lineup.

Frankly, based on the charts, I wouldn’t be surprised if we saw Netflix return to the $205-$210 level in the next month or so, down from current levels at around $247. There are other indicators in the charts that also point to a short-term pullback. Use caution if you are looking to go long here.

Editor’s Note: Legally tell Uncle Sam to shove it! In 30 minutes you can make one simple — and totally legal — change to your life that can increase your income and reduce your tax burden all at once. Get all the details here.

About the Author

Jared Levy is Co-Editor of Smart Investing Daily, a free e-letter dedicated to guiding investors through the world of finance in order to make smart investing decisions. His passion is teaching the public how to successfully trade and invest while keeping risk low.

Jared has spent the past 15 years of his career in the finance and options industry, working as a retail money manager, a floor specialist for Fortune 1000 companies, and most recently a senior derivatives strategist. He was one of the Philadelphia Stock Exchange’s youngest-ever members to become a market maker on three major U.S. exchanges.

He has been featured in several industry publications and won an Emmy for his daily video “Trader Cast.” Jared serves as a CNBC Fast Money contributor and has appeared on Bloomberg, Fox Business, CNN Radio, Wall Street Journal radio and is regularly quoted by Reuters, The Wall Street Journal and Yahoo! Finance, among other publications.
Madoff Tells NYT Banks ‘Had to Know’ of Fraud Scheme

Feb. 15 (Bloomberg) — Bernard Madoff asserted in a prison interview that banks and hedge funds he did not identify were somehow “complicit” in the fraud scheme that sent him to jail for 150 years, the New York Times reported. In a two-hour interview from the Butner, North Carolina, prison visitor room conducted by the newspaper, Madoff said, “they had to know.” Bloomberg’s Deirdre Bolton and Matt Miller report. (Source: Bloomberg)

Potential Reversal for NZD/USD

By Anton Eljwizat

The NZD has dropped significantly versus the USD in the past 2 weeks, and it is currently traded around 0.7540. And now as evident in the data below, the daily chart is giving bullish signals, indicating that NZD/USD pair might go up. Forex traders can take advantage of this impending movement by having their Entry Orders in place to capture this reversal.

• Below is the daily chart of the NZD/USD currency pair.

• The technical indicators that are used are the William Percent Range, Relative Strength Index (RSI), and Slow Stochastic.

• Point 1: The Slow Stochastic indicates an impending bullish cross, signaling that the next move may be in an upward direction.

• Point 2: The Relative Strength Index (RSI) indicates that the price of this cross currently floats in the oversold territory, signaling upward pressure.

• Point 3: The Williams Percent Range has peaked near at the -100 marker, which means that there may actually be a strong level of upward pressure.

NZD/USD Daily Chart
NZD-USD 16-2-2011

Forex Market Analysis provided by ForexYard.

© 2006 by FxYard Ltd

Disclaimer: Trading Foreign Exchange carries a high level of risk and may not be suitable for all investors. There is a possibility that you could sustain a loss of all of your investment and therefore you should not invest money that you cannot afford to lose. You should be aware of all the risks associated with Foreign Exchange trading.

The US dollar faces correction in overnight market versus major counterpart currencies

The US dollar faced correction on overnight trading on Tuesday as China reported the increase of 4.9 percent in its consumer price index as compared to analysts’ expectations of 5.4 percent. The dollar index DXY which measure greenback’s movement versus its six major rival currencies declined to 78.50 in overnight trading as compared to 78.602 on Monday’s North American trading session.

The Australian dollar also advanced 0.2 percent to 1.0039 against the US dollar on the positive news of less increase in Chin’s CPI index.

On the other hand analysts are expecting a rise of 0.6 percent in US retail sales for the month of January as compared to nil growth in the prior month. The surge in retail sales is expected on the basis of increase in core spending and food and energy prices.

The Euro also rose to 1.3510 against the US dollar as compared to1.3484 on Monday despite the negative sentiments about euro zone’s sovereign debt situation.  Investors were also uncertain about the future outlook of WestLB one of the Germany’s major financial institutions however analysts believe that Germany’s economy is the only factor which can provide support for the single currency.  Economists are expecting strong economic data for the quarter by Germany.

The British Pound also gained against the US dollar to 1.6047 in overnight trading as compared 1.6036 on late Monday.

However the greenback advanced to 83.46 versus the Japanese Yen in Asian trading session as compared to 83.26 on Monday’s North American trading session despite the factor that Japanese central bank managed to kept the overnight call rate to very low level which is expected by most analysts.

About the Author

Daily forex trading news written by Rehan from DailyForexTrade.com

Forex Daily Market Commentary

By GCI Forex Research

Fundamental Outlook at 0800 GMT (EDT + 0400)

USD

Dollar performance was mixed during the Asia session with losses incurred against the euro, while further gains were made versus the yen. EURUSD traded 1.3473-1.3528, USDJPY 83.20-83.56. AUDUSD was temporarily supported by China’s CPI print, which was more benign than consensus forecasts. An uneventful BoJ policy announcement had no currency impact. There were no major data releases in the US overnight, but today should be more eventful. Advance retail sales are due and the winter weather in January could make it a more volatile release. We are looking for +0.1% on the headline release vs. consensus of +0.5%, largely due to bad weather. A disappointing headline print could knock the dollar and Treasury yields lower. But our economists note that even if the data comes in around their lower estimate, their forecast is consistent with total real consumer spending (including services), staying largely unchanged on the month.
EUR

A regular monthly meeting of Eurozone finance ministers broke up as expected without any agreement on how Europe’s existing financial rescue mechanism might be enhanced over the coming weeks. However, Eurogroup president Juncker said agreement had been reached on the size of the ESM – the permanent mechanism that is due to take over in 2013. Juncker said the EU’s contribution to the ESM would ensure an effective EUR500 bn lending capacity, and said the IMF will make contributions on top of that. Juncker also said there could be an extra Eurogroup meeting on March 21, ahead of the end of month EU leaders summit.
The ECB revealed it had purchased no sovereign bonds under the Securities Markets Program by Tuesday of last week.
JPY

The BoJ kept the policy rate unchanged and continues to target a range of 0-0.1%. No changes were made to any of the asset purchase or lending facilities.
GBP

We expect another above-target CPI print of 4.00% y/y, in line with consensus, which could keep BoE rate hiking expectations elevated.
CHF

We raise our 3m EURCHF forecast to 1.35 to reflect that Swiss outperformance may be coming to an end as the global economy reflates and as the SNB continues to ease rates.
AUD

The RBA minutes from the Feb 1 meeting provided little in the way of additional insight into the policy board’s current thinking. The key message was that recent consumer caution and lower than expected CPI have convinced the RBA that it need be in no hurry to hike again. Our Australian economists continue to see the first 2011 policy rate hike in August/September.

TECHNICAL OUTLOOK
EURUSD 1.3428 support.
EURUSD NEUTRAL Move below 1.3428 would expose 1.3364. Initial resistance at 1.3621.
USDJPY BULLISH Resistance at 83.68 continues to hold; push above the level would expose 84.51. Support at 82.71.
GBPUSD BULLISH While support at 1.5922 holds, expect recovery towards 1.6138 and 1.6186.
USDCHF BULLISH Break through 0.9776/84 would expose 0.9852. Support is at 0.9575.
AUDUSD NEUTRAL Model is neutral; 1.0137 and 0.9961 mark the near-term directional triggers.
USDCAD BEARISH Support at 0.9832/20 zone holds; break through this would expose 0.9712. Near-term resistance at 0.9918.
EURCHF BULLISH Clearance of 1.3086 exposes 1.3015. Resistance at 1.3206.
EURGBP BEARISH Momentum is negative; eyes 0.8389/77 support zone. Near-term resistance is at 0.8462.
EURJPY BULLISH Rise above 113.44 would expose 114.01/94 resistance area. Support lies at 112.06.

Forex Daily Market Commentary provided by GCI Financial Ltd.

GCI Financial Ltd (”GCI”) is a regulated securities and commodities trading firm, specializing in online Foreign Exchange (”Forex”) brokerage. GCI executes billions of dollars per month in foreign exchange transactions alone. In addition to Forex, GCI is a primary market maker in Contracts for Difference (”CFDs”) on shares, indices and futures, and offers one of the fastest growing online CFD trading services. GCI has over 10,000 clients worldwide, including individual traders, institutions, and money managers. GCI provides an advanced, secure, and comprehensive online trading system. Client funds are insured and held in a separate customer account. In addition, GCI Financial Ltd maintains Net Capital in excess of minimum regulatory requirements.

DISCLAIMER: GCI’s Daily Market Commentary is provided for informational purposes only. The information contained in these reports is gathered from reputable news sources and is not intended to be U.S.ed as investment advice. GCI assumes no responsibility or liability from gains or losses incurred by the information herein contained.

GBP/JPY Uptrend might be in the End

By Anton Eljwizat

In the last three weeks trading, the GBP/JPY experienced much bullishness, as it stands now at 135.40. However as I demonstrate below, it seems that the pair’s bullish run may have run of steam, and a bearish correction could be underway soon. Forex traders have the opportunity to wait for the downward breach on the hourlies and go short in order to ride out the impending wave.

• Below is the 8-hour chart of the GBP/JPY currency pair.

• The technical indicators that are used are the William Percent Range, Relative Strength Index (RSI), and Slow Stochastic.

• Point 1: There is a “doji” candlestick that has formed on the chart, indicating that a reversal should take place.

• Point 2: The Slow Stochastic indicates an impendin bearish cross, signaling that the next move may be in a downward direction.

• Point 3: The Relative Strength Index (RSI) indicates that the price of this cross currently floats in the overbought territory, signaling downward pressure.

• Point 4: Williams Percent Range also supports the upward direction.

GBP/JPY 8-Hour Chart
GBP-JPY 16-2-2011

Forex Market Analysis provided by ForexYard.

© 2006 by FxYard Ltd

Disclaimer: Trading Foreign Exchange carries a high level of risk and may not be suitable for all investors. There is a possibility that you could sustain a loss of all of your investment and therefore you should not invest money that you cannot afford to lose. You should be aware of all the risks associated with Foreign Exchange trading.

GBP Strength Looks to Continue

Source: ForexYard

A news heavy trading day saw sharp rallies in the pound while the Aussie dollar traded lower.

Economic News

USD – Dollar Shrugs Off Poor Retail Sales

Traders overlooked disappointing January retail sales numbers as the dollar was mixed versus the major currencies. Retail sales for the previous month failed to meet economists’ expectations, positing a 0.3% increase on expectations of a 0.5% jump. December’s sales numbers were revised lower to 0.5% from 0.6%, underscoring the negative tone of the report.

Other US economic data showed investors continued to increase their purchases of long term US securities as the TICS capital flow report released results showing 69.5B USD in purchases. Expectations were for purchases to total 91.3B.

When discussing the President’s Federal budget plan, Treasury Secretary Timothy Geithner said the budget problems cannot be ignored and are not a result stemming from the financial crisis. A return to financial prudence will be needed and US deficits are too high at this time.

At the end of the trading day, the dollar was mixed with gains coming versus the euro and the Aussie dollar. The EUR/USD finished at 1.3485 after opening the day at 1.3507. The dollar was up sharply versus the yen as the USD/JPY closed near its high of 83.80 from its opening day price of 83.40. The AUD/USD fell below parity to 0.9980 from 1.0041.

Today traders will be focusing on the release of key US economic data as well as the release of the Fed Meeting Minutes. At 13:30, monthly building permits will be released and also month over month PPI. Inflationary pressures are nonexistent in the US and traders will focus on the housing data and any changes in the Fed’s economic expectations.

The EUR/USD is currently trading in a bearish channel after turning lower following its failure at 1.3860. Further declines are expected with a possible target at 1.3250, the 61.8% retracement of the January to February move. Support is found at the bottom channel line at 1.3390. Resistance comes in at 1.3570 followed by last week’s high at 1.3740.

EUR – Pound Rises on Interest Rate Expectations

The pound traded higher following the fifth consecutive letter from BOE Governor Mervyn King to the Chancellor of the Exchequer on why inflation is higher than expected. King’s comments highlighted the uncertainty surrounding future British inflation levels that have been primarily driven by rising commodity prices and an increase in UK VAT. The letter also highlighted the view of higher inflation above targets forecasted by the BOE.

In light of the letter, traders bid the pound higher on expectations of an interest rate increase by the BOE in the near term.

The GBP/JPY added 1.3% in value and closed higher at 135.46 from 133.51 while GBP/USD rallied to a closing price of 1.6140 after opening the day at 1.6044.

Traders will once again be focusing on comments by BOE Governor King in the morning.

The move higher by the Cable was enough to breach above the declining wedge pattern that has held the GBP/USD in check since failing to breach the 1.6280. Judging from the consolidation pattern, an estimate following the breach should target this previous resistance level.

JPY – Dollar Continues to Book Gains Versus the Yen

In yesterday’s trading the greenback strengthened against the yen to a level not seen over the past two months. As traders shrugged off poor performing US retail sales numbers, they continued to buy dollars and sell yen as expectations for an improving US economy takes shape.

At the close of yesterday’s New York trading session, the USD/JPY was trading near its session high of 83.80 from its opening day price of 83.40.

Continued gains have been booked in the USD/JPY following a breakout of the triangle consolidation pattern. The pair’s appreciation stymied at the 200-day moving average which comes in at 83.90. A breach above this level should then target the December high of 84.50, followed by the September high at 85.90. Support for the pair is found at this week’s low of 83.10 followed by the descending leg of the triangle which comes in today at 82.60.

Crude Oil – Spot Crude Oil Continues to Fall

Prices for spot crude oil booked another day in the red as traders expect rising crude oil inventories in the US may off-set the recent destabilization in the Middle East. Following an $8 rally at the beginning of the Egyptian protests, spot crude oil has given back those gains and then some.

At the end of the day, spot crude oil was trading lower at $84.30 after opening the day at $85.15.

Since peaking at $93, spot crude touched a two and a half month low earlier in the day. Driving prices lower is stabilization on the Egyptian front as well as limited tensions in large oil producing nations such as Saudi Arabia. Also easing the price pressures are traders’ expectations for larger than expected US crude oil inventory numbers.

Today at 15:30, the US weekly crude oil inventory report will be released. Market expectations are for a 1.8M barrel increase. Last week the report showed a rise of 1.9M barrels.

Yesterday’s low of $83.30 and $80.25 should serve as support levels with resistance found at $89.40 and $93.00.

Technical News

EUR/USD

A close below the 1.3480 level should target the 61.8% Fib retracement at 1.3250. This level lines up nicely with the mid-January pivot of 1.3240. Resistance comes in at 1.3570 followed by last week’s high at 1.3740, though any gains in the pair should be capped by the falling trend line off of this year’s high.

GBP/USD

Yesterday’s breakout higher was enough to breach above the declining wedge pattern that has held the GBP/USD in check since failing to breach the 1.6280. Judging from the consolidation pattern, an estimate following the breach should target this previous resistance level.

USD/JPY

The pair’s appreciation stymied at the 200-day moving average which comes in at 83.90. A breach above this level should then target the December high of 84.50, followed by the September high at 85.90. Support for the pair is found at this week’s low of 83.10 followed by the descending leg of the triangle which comes in today at 82.60.

USD/CHF

With textbook precision, the USD/CHF has turned lower after retracing 61.8% of its December downtrend. An initial target for the pair looks to be the 38.2% retracement level at 0.9590 followed by the mid February low of 0.9520. Resistance for the pair comes in at 0.9720 and 0.9775.

The Wild Card

EUR/CHF

The pair has shown a propensity to be sold off when it approaches its 200-day moving average. On two prior occasions (both in November of 2010) the pair fell following unsuccessful attempts to trade above this long term moving average. The recent two day decline looks to have verified the exhaustion of the bulls, making a short setup entry opportunity for forex traders. Support is found at 1.2930, followed by 1.2770, and 1.2720.

Forex Market Analysis provided by ForexYard.

© 2006 by FxYard Ltd

Disclaimer: Trading Foreign Exchange carries a high level of risk and may not be suitable for all investors. There is a possibility that you could sustain a loss of all of your investment and therefore you should not invest money that you cannot afford to lose. You should be aware of all the risks associated with Foreign Exchange trading.