This “Stock Market Sensitive” Currency Could Tumble Along with Stocks Soon!

If there was every a “stock market sensitive” currency, it’s the Australian dollar.

You see, when traders/investors are willing to stick their necks out enough to get into stocks, they are also willing to go into riskier, higher yielding currencies at the same time.

In fact, you can see how closely the Aussie (AUD/USD) tracks U.S. stocks by checking out the chart below. Click on the chart to enlarge it.

The S&P 500 is Overdue for a Sizable Correction…And So is the Aussie Dollar!

Then when you apply Elliott Wave analysis, you can see that the S&P 500 has already completed its “5 waves up” pattern. Now it’s time for a “3 waves correction” downward against that uptrend. In fact, you can look at the yellow arrow on the chart to see how this may play out.

While the overall, long-term uptrend in stocks is probably not over…a major correction is still “in the cards” for the near-term. As U.S. stocks correct severely in the coming weeks to months…the Aussie dollar will follow suit and do the same.

As investors bail out of riskier assets and scamper off to the sidelines, it will actually benefit the U.S. dollar at the same time.

Oh sure…in the end, the buck is toast, but our dollar does catch some occasional breaks along the way, particularly when stocks fall and investors run towards defensive, risk adverse assets like the greenback.

Both of these dynamics at work at once really “doubly” hammers the AUD/USD pair and causes it to tumble lower.

Long-term, Australia still has great fundamentals and its dollar will do great over time. But anything can get overdone in the near-term and right now the Aussie dollar and the S&P 500 are both poised to tumble very soon.

Then once the dust settles and both of these have had sizable corrections…their long-term uptrends will likely resume. But not until its shaken out the “weak hands” in the market first.

Sean Hyman

http://wcw.worldcurrencywatch.com/

http://www.globalcurrencyexpo.com

http://www.dollarescape.com

Are Asian Currencies Massively Undervalued?

By Justice Litle, Editorial Director, Taipan Publishing Group, taipanpublishinggroup.com

China’s currency is 35% cheaper (if not more) than it was in 1993. Is a protectionist backlash in the cards?

Earlier this month, Tudor Investment Corp. sent an interesting piece of research to clients. The gist — China’s currency is undervalued in a very big way.

According to measures based on productivity and purchasing power parity, or PPP, the Chinese renminbi (RMB) is 35% to 72% cheaper than it was in 1993.

How many things can you think of that have gotten at least a third cheaper, and possibly more than two-thirds cheaper, over the past 18 years? Apart from technology and data storage costs, there isn’t a whole lot.

And yet, if Tudor’s research is sound, that’s how much China’s currency has dropped relative to the buck.

Tudor sees this devaluation as “a major, if not the primary, contributing factor to the nearly 6 million lost jobs suffered in the United States’ manufacturing sector.”

U.S. manufacturing employees, in other words, have been subject to a job-grabbing “currency war” that has gone on for nearly two decades. A cheaper currency means cheaper exports and higher sales, at a cost to higher-priced exporters who can’t compete.

There is further argument that China devaluation has fed America’s debt woes. How? In at least four ways:

  • By keeping its exports cheap, China encouraged Americans to import more “stuff” on credit.
  • By causing millions of U.S. manufacturing jobs to disappear, China caused an invisible reduction in U.S. government revenue — taxes never collected on wages never earned.
  • By recycling U.S. dollars back into Treasury bonds, China encouraged even greater leverage in the borrow-and-spend cycle, their bond buying having kept long-term interest rates low.
  • By acting as lead manipulator, China forced other Asian countries in the region to follow suit, giving them the non-choice of devaluing like the dragon or losing competitiveness.

(This isn’t the first time I’ve talked about China’s currency. Sign up for Taipan Daily to receive all my investment commentary.)

This is the old “Bretton Woods II” story your editor has written about in past years. China, along with other Asian exporters and Middle East oil exporters, created a new vendor finance-type relationship with the West.

The West bought tons of “stuff” (and oil)… the creditors took the flow of dollars and plowed it back into Treasury bonds… and via those Treasury purchases America’s long-term rates were kept low, fueling mortgage leverage and private equity leverage and every other form of cheap money vice.

It had the feel of a giant party while it lasted. China was booming, America was booming, housing and equities were booming. The price of oil was skyrocketing but nobody cared (at least pre-2008 anyway). It was a case of leverage on top of leverage — creditors gone crazy and debtors gone wild.

But whose fault is it all really? The problem with blaming China for America’s spending excesses is that it’s akin to blaming the bartender when a drunk goes on a binge. Was it really the bartender’s fault? Or was it the guy consuming the alcohol? And yet — what if the bartender knew his patron had a problem, and kept slinging out gin and tonics as fast as he could?

Your editor is a fan of free markets and free trade. Protectionist thoughts do not come easily. But currency manipulation is one of those topics where simple answers do not apply.

For example: Can it really be called “free trade” if one country is pushing down its currency at the competitive expense of another? Is it really a “free market” if private sector manufacturers are forced to compete with government-enabled challengers?

These questions are easy to deal with when everything is going well — you just ignore them. Nobody cares much about ramping debt levels when the party’s in full swing. Just make up some stuff about a “global savings glut” and let the leverage roll.

After the party ends, however, things can get messy. When the reality of carpet stains and destroyed furniture comes about — if not worse — that’s when voices rise as blame gets passed around.

As of this writing, there is still an abundance of blind hope that the U.S. economy will recover nicely. So far there has been no forced reckoning, no painful deleveraging, and no need on the part of the authorities to admit how they screwed up. For many, the Federal Reserve’s “extend and pretend” policies are (thus far) seen as a success. To the extent that China copied the West’s easy-money ways, its actions are painted with the same brush.

But for America, the reality of persistent unemployment looms. Tens of millions of Americans remain on food stamps — the hidden underbelly the stock market says nothing of. And the proposed solutions to the problem are laughable.

Just recently knucklehead chatter of “QE3” (quantitative easing 3) has started up, resolving the unemployment problem if deemed that QE2 was not enough.

But QE3 will not work any better than QE2 did — especially if the real jobs problem is a permanent loss of competitiveness through mercantilistic currency policies. At some point the Federal Reserve will be seen as a bunch of ineffectual jokers — once people wake up to the stagflation nightmare Bernanke is creating.

When that bitter realization hits, there will be new demands to deal with America’s unemployment problem — furious demands, more stringent and vocal than before. This will lead back around to the China devaluation issue, and a likely protectionist backlash.

All the more reason, then, to be prepared for a rude shock in the months ahead. If the mercantilist foundations of the Asian miracle are challenged head on — with increasingly harsh words and harsh measures exchanged — the “Bernanke Put” could again become background noise as global growth stalls.

Editor’s Note: China has seized a near total monopoly on supplies of a natural resource treasure that is 100% mission critical to just about every piece of military technology — from satellites to smart bombs. Learn what these materials are… why they are so critical… and how a pending Department of Defense report could make you gains of 950% or more. Get your hands on the exclusive investment report.

About the Author

Justice Litle is the Editorial Director of Taipan Publishing Group, Editor of Justice Litle’s Macro Trader and Managing Editor of the free financial market news e-letter Taipan Daily. Justice began his career by pursuing a Ph.D. in literature and philosophy at Oxford University in England, and continued his education at Pulacki University in Olomouc, Czech Republic, and Macquarie University in Sydney, Australia.

Aside from his career in the financial industry, Justice enjoys playing chess and poker; he enjoys scuba diving, snowboarding, hiking and traveling. The Cliffs of Moher in Ireland and Fox Glacier in New Zealand are two of his favorite places in the world, especially for hiking. What he loves most about traveling is the scenery and the friendly locals.

Schroeder Says Buffett’s Annual Letter Elevated CEO Role

Feb. 28 (Bloomberg) — Alice Schroeder, a Bloomberg columnist and author of “The Snowball: Warren Buffett and the Business of Life,” discusses Buffett’s annual letter to Berkshire Hathaway Inc. shareholders. Schroeder speaks with Betty Liu on Bloomberg Television’s “In the Loop.” (Source: Bloomberg)

What To Watch: February 28th, 2011

Kicking off the week, look for earnings from Quiksilver Resources, Salix Pharmaceuticals, Warnaco Group, Range Resources and Sotheby’s. You can also be on the lookout for a number of economic data reports including Personal Income, Personal Spending, Personal Consumption Expenditures and Personal Home Sales.

Commodities, Forex & Stocks: Thoughts and Analysis on Gold, the US Dollar and the SP500

Chris Vermeulen, thegoldandoilguy.com

So far 2011 has been an interesting to say the least. Stocks and commodities have been jumping around with high volatility generating mixed trading signals. This choppy price action typically indicates trends are in their late stages. The late stages of a trend is very difficult to trade because volatility rises meaning larger day to day price swings, and at any time the price could either drop like a rock or go parabolic surging higher in value. Generally the largest moves take place during the final 10% of trend, but with a sharp rise in price keep in mind the day to day gyrations are much larger than normal, hence the false buy and sell signals back to back on some investment vehicles.

Taking a look at the charts it’s clear that we are on the edge of some sizable moves in both stocks and commodities. It’s just a matter of time before a correction is confirmed or this current pullback in stocks is just a dip (buying opportunity). I am in favor of the longer term trend at work here (bull market) but it only takes a 1 or 2 bid down days and that could change.

SPY (SP500 Price Action) – 60 Minute Chart

This chart shows intraday price action with my market internals. It is signaling a short term bottom within the overall uptrend on the equities market. The big question is if this is a just an opportunity to buy into this Fed induced bull market or the start of a larger correction?

Currently I am bullish but the next couple trading sessions could confirm my bullish view or a correction could be unfolding. Until then, we must remain cautious.

Price Of Gold – Weekly Chart

Gold has staged a strong recovery in the past four weeks. But it has yet to break to a new high. I do feel as though it will head higher because of the way silver has been performing (new highs). But it is very possible we get a pause for a week or two before continuing higher.

Because of the international concerns in the Middle East both gold and silver should hold up well even if the US dollar bounces off support. But, if the US dollar breaks down below its key support level we could see stocks and commodities go parabolic and surge higher in the coming months. It’s going to be interesting year to say least…

Dollar Weekly Chart

This long term view of the dollar shows a MAJOR level which if penetrated will cause some very large movements across the board (stocks, commodities and currencies).

In short, a breakdown will most likely cause a spike in stocks and commodities across the board which could last up to 12 months in length. On the flip side a bounce from this support zone will trigger a pullback in both stocks and commodities. This weekly chart is something we must keep our eye on each Friday as the weekly candle closes on the chart.

Weekend Trend Report:

In short, 2011 has been interesting but trading wise it’s has yet to provide any real low risk trade setups which I am willing to put much money on. There are times when trading is great and times when it’s not. It all comes down to managing money/risk by trading small during choppy times (late stages of trends), and times when we add to positions as they mature building a sizable portfolio of investments which I think will start to unfold over the next few months.

I continue to analyze the market probing it for small positions as this market flashes short term buy and sell signals.

Last week we say a lot of emotional trading and that typically indicates large daily price swings should continue for some time still so keep trades small and manage you positions.

You can get my FREE Weekly Analysis here: http://www.thegoldandoilguy.com/trade-money-emotions.php

Chris Vermeulen

Rogers Says He’s `Short’ Emerging Market, Nasdaq Stocks

Feb. 28 (Bloomberg) — Jim Rogers, chairman of Rogers Holdings, talks about his investment strategy for global stocks and commodities. Gold advanced, approaching a record, as tensions in the Middle East boosted oil prices, increasing demand for precious metals as a protector of wealth and hedge against inflation. Rogers also discusses his strategy for the U.S. dollar. He speaks in Hong Kong with Rishaad Salamat on Bloomberg Television’s “On the Move Asia.” (Source: Bloomberg)

AUD/USD- Technical Update

printprofile

A bullish movement in AUD/USD has pushed a number of technical indicators into the over-bought territory. As I will demonstrate below, the AUD/USD may very well be heading for a reversal, as a bearish cross has taken place on the Slow Stochastic. In addition, the Williams Percent Range and Relative Strength Index indicates that the price of this cross currently floats in the overbought territory, signaling downward pressure. Forex traders can take advantage of this impending movement by having their Entry Orders in place to capture this reversal. Don’t forget your Stops and Limits!

AUD-USD 28-2-2011

Oil continues to surge on Middle East unrest

By GCI Forex Research

Crude Oil

Crude Oil Movement

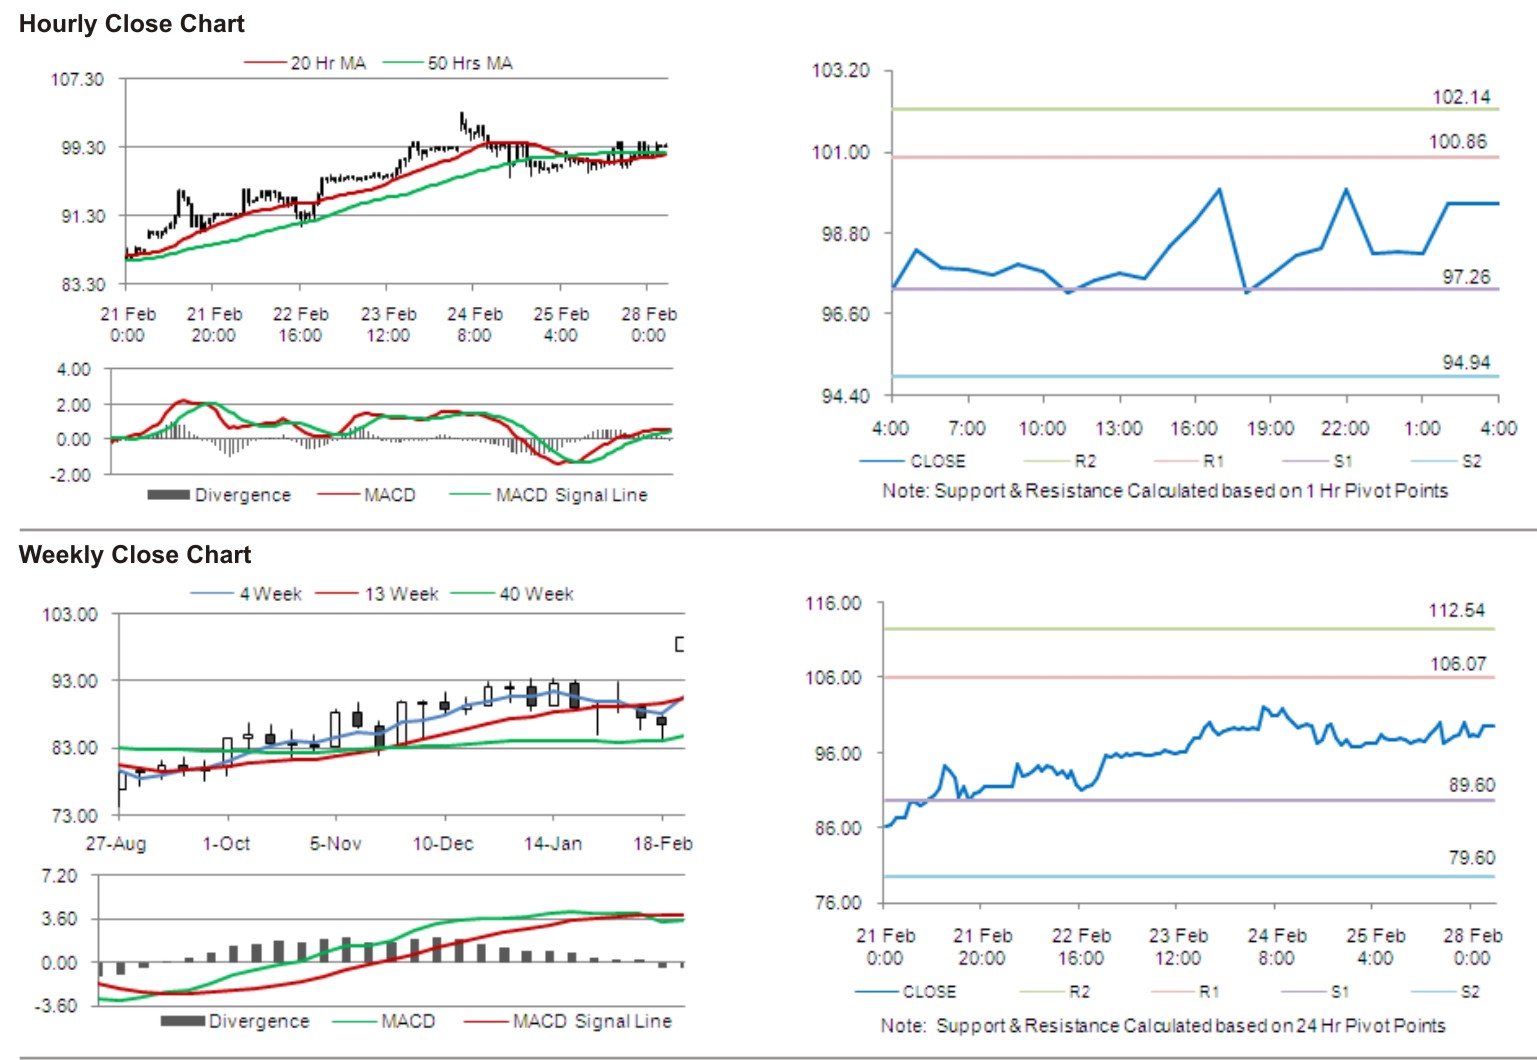
Oil prices advanced 1.49% against the USD for the 24 hour period on Friday, ending 23:00GMT, closing at 98.24.

Oil advanced as the worsening situation in the Middle East stirred renewed concern about disruptions to oil production.

At GMT 0400, Oil is trading at USD 99.59 per barrel in the Asian session, 1.37% higher from 23:00GMT.

The pair has its first resistance at 100.86, followed by the next resistance at 102.14. On the other side, the first support is at 97.26, with the subsequent support at 94.94.

The currency pair is showing convergence with its 20 Hr and 50 Hr moving averages.

Forex Daily Market Commentary provided by GCI Financial Ltd.

GCI Financial Ltd (”GCI”) is a regulated securities and commodities trading firm, specializing in online Foreign Exchange (”Forex”) brokerage. GCI executes billions of dollars per month in foreign exchange transactions alone. In addition to Forex, GCI is a primary market maker in Contracts for Difference (”CFDs”) on shares, indices and futures, and offers one of the fastest growing online CFD trading services. GCI has over 10,000 clients worldwide, including individual traders, institutions, and money managers. GCI provides an advanced, secure, and comprehensive online trading system. Client funds are insured and held in a separate customer account. In addition, GCI Financial Ltd maintains Net Capital in excess of minimum regulatory requirements.

DISCLAIMER: GCI’s Daily Market Commentary is provided for informational purposes only. The information contained in these reports is gathered from reputable news sources and is not intended to be U.S.ed as investment advice. GCI assumes no responsibility or liability from gains or losses incurred by the information herein contained.

AUD/USD Likely to Turn Bearish

By Dan Eduard

After spending the last week in a prolonged upward trend, it appears that the AUD/USD pair may have finally hit a significant resistance line. Technical indicators are showing that the pair is likely to turn bearish in the near future, providing forex traders with an excellent opportunity to jump on this trend from the beginning.

We will be looking at the 8-hour AUD/USD chart provided by ForexYard. The technical indicators being examined are the Williams Percent Range, Relative Strength Index and Stochastic Slow.

1. The Williams Percent Range is currently approaching the 0 level, indicating that the pair is well into the overbought zone. Typically this is a sign that a downward correction is forthcoming.

2. The Relative Strength Index, currently just below the 80 line, has just crossed into overbought territory. This lends further evidence to our theory that a bearish move is likely to occur.

3. Finally, the Stochastic Slow has formed a bearish cross. With both indicator lines pointing downward, it appears that a downward correction may occur very shortly.
AUDUSD tech

Forex Market Analysis provided by ForexYard.

© 2006 by FxYard Ltd

Disclaimer: Trading Foreign Exchange carries a high level of risk and may not be suitable for all investors. There is a possibility that you could sustain a loss of all of your investment and therefore you should not invest money that you cannot afford to lose. You should be aware of all the risks associated with Foreign Exchange trading.