March 2 (Bloomberg) — The top 10 hedge funds, measured by total dollar returns since they started, made profits for their investors of $28 billion in the second half of 2010, the Financial Times reported, citing research by LCH Investments. That was more than the combined profits of Goldman Sachs Group Inc., JPMorgan Chase & Co., Citigroup Inc., Morgan Stanley, Barclays Plc and HSBC Holdings Plc, the newspaper said. Bloomberg’s Deirdre Bolton reports. (Source: Bloomberg)
Forex Daily Market Commentary: The Dollar continues recovering
By GCI Forex Research
FUNDAMENTAL OUTLOOK at 0800 GMT (EDT +0400)
USD
The dollar continued to recover lost ground on the back of weaker risk appetite. Ratings agency comments about Greece and Portugal did not help. Nor did calls for a cut to the OCR by New Zealand Prime Minister Key. Weaker-than-expected Australian Q4 GDP also contributed to the sombre mood. EURUSD traded 1.3744-1.3811, USDJPY 81.82-81.98. Gold and oil remain elevated and the Nikkei-225 is down 2.4% at the time of writing. US data releases were largely in line and Fed Chairman Bernanke offered little new in his semi-annual testimony on monetary policy to Congress. Bernanke said the Fed is not debasing the dollar and pointed to the need for sustained stronger job creation. He also believes that the recent jump in commodity prices will not have a permanent effect on broader inflation. The ISM Manufacturing slightly exceeded estimates. ADP employment data is due.
EUR
S&P said its ratings on Greece and Portugal remain on credit-watch negative. In Greece’s case, the agency said the rating will depend on the features of the proposed new European rescue mechanism due to come into being in 2013. Greece’s compliance with the terms of the existing EU/IMF rescue plan is also a consideration. S&P added that Portugal may have to resort to EFSF and IMF funding, in which case the rating would depend on the terms of any consequent loan agreements.
Eurozone PMI releases were generally strong, beating consensus in Germany, Italy, and France. The German unemployment rate also fell marginally to 7.3%. The Eurozone CPI estimate came in line with expectations at 2.4%, still significantly above the ECB’s target level.
GBP
A number of BoE policymakers testified before a parliamentary committee, but no new views were expressed. Governor King once again said that raising interest rates to make a gesture is “self-defeating”. Deputy Governor Bean echoed King’s previous comments that inflation in the region of 4-5% is likely, but will then come down.
AUD
The AUD weakened slightly when Q4 GDP came in fractionally softer than expected at +0.7%q/q (cons. +0.7%) and +2.7% y/y (cons. 2.8%).
NZD
The NZD fell sharply after Prime Minister Key said he would welcome a cut in the OCR, and that he cannot rule out a recession in the first half of this year
CAD
The BoC left policy unchanged as expected, and did not signal any near-term shift. Officials noted improving performance in the US and in Canada, but they also cited challenges from persistent CAD strength and an uncertain global outlook. Elevated oil prices are supportive for Canada and we continue to expect the BoC to resume tightening ahead of the rest of the G10 dollar-bloc central banks.
TECHNICAL OUTLOOK
GBPUSD 1.6330 resistance.
EURUSD BULLISH Focus is on 1.3862 break of which would expose 1.3948/74 zone. Near term support is at 1.3705.
USDJPY BEARISH Support defined at 81.62; move below this would expose 81.13. Initial resistance is at 82.24, yesterday’s high.
GBPUSD BULLISH Initial resistance at 1.6330, the reaction high defined yesterday, ahead of 1.6379. Support is defined at 1.6145.
USDCHF BEARISH Support zone is at 0.9228/00, breach of this would expose 0.8951 next. Near-term resistance at 0.9392.
AUDUSD BULLISH Pullback through 1.0088 exposes 1.0002. While this holds, expect recovery towards 1.0202 and 1.0256 next.
USDCAD BEARISH Break of 0.9684 would expose 0.9600. Resistance at 0.9800.
EURCHF BEARISH Support lies at 1.2706, break of this would expose 1.2686 and 1.2592. Near-term resistance is at 1.2893.
EURGBP BULLISH As long as support at 0.8423 holds, expect gains towards 0.8555 ahead of 0.8593.
EURJPY NEUTRAL 114.19 and 111.96 mark the near-term directional triggers.
Forex Daily Market Commentary provided by GCI Financial Ltd.
GCI Financial Ltd (”GCI”) is a regulated securities and commodities trading firm, specializing in online Foreign Exchange (”Forex”) brokerage. GCI executes billions of dollars per month in foreign exchange transactions alone. In addition to Forex, GCI is a primary market maker in Contracts for Difference (”CFDs”) on shares, indices and futures, and offers one of the fastest growing online CFD trading services. GCI has over 10,000 clients worldwide, including individual traders, institutions, and money managers. GCI provides an advanced, secure, and comprehensive online trading system. Client funds are insured and held in a separate customer account. In addition, GCI Financial Ltd maintains Net Capital in excess of minimum regulatory requirements.
DISCLAIMER: GCI’s Daily Market Commentary is provided for informational purposes only. The information contained in these reports is gathered from reputable news sources and is not intended to be U.S.ed as investment advice. GCI assumes no responsibility or liability from gains or losses incurred by the information herein contained.
Technical Signal – EUR/CHF – Downtrend Looks to Continue
By Russell Glaser
After a technical retracement the EUR/CHF should resume its sharp downtrend.
In early February the EUR/CHF collapsed at the 200-day moving average February’s move took the pair from 1.3200 to 1.2700.
The EUR/CHF has since undergone a technical retracement of the February move, climbing as high as the 38.2% Fibonacci level from the February downtrend at 1.2900 where the pair ran into resistance and the bearish trend resumed.
A technical retracement actually reinforces a strong trending environment and signals further moves in the direction of the trend. As such, following a breach of the 1.2700 support level, we may expect the EUR/CHF to now target the 2010 low at 1.2400.
Resistance is found at yesterday’s high of 1.2900, followed by 1.2970, and the falling trend line off of the October and February highs which comes in today at 1.3100.

Forex Market Analysis provided by ForexYard.
© 2006 by FxYard Ltd
Disclaimer: Trading Foreign Exchange carries a high level of risk and may not be suitable for all investors. There is a possibility that you could sustain a loss of all of your investment and therefore you should not invest money that you cannot afford to lose. You should be aware of all the risks associated with Foreign Exchange trading.
Gold: Cooling off this morning after yesterday’s surge
 Gold Movement
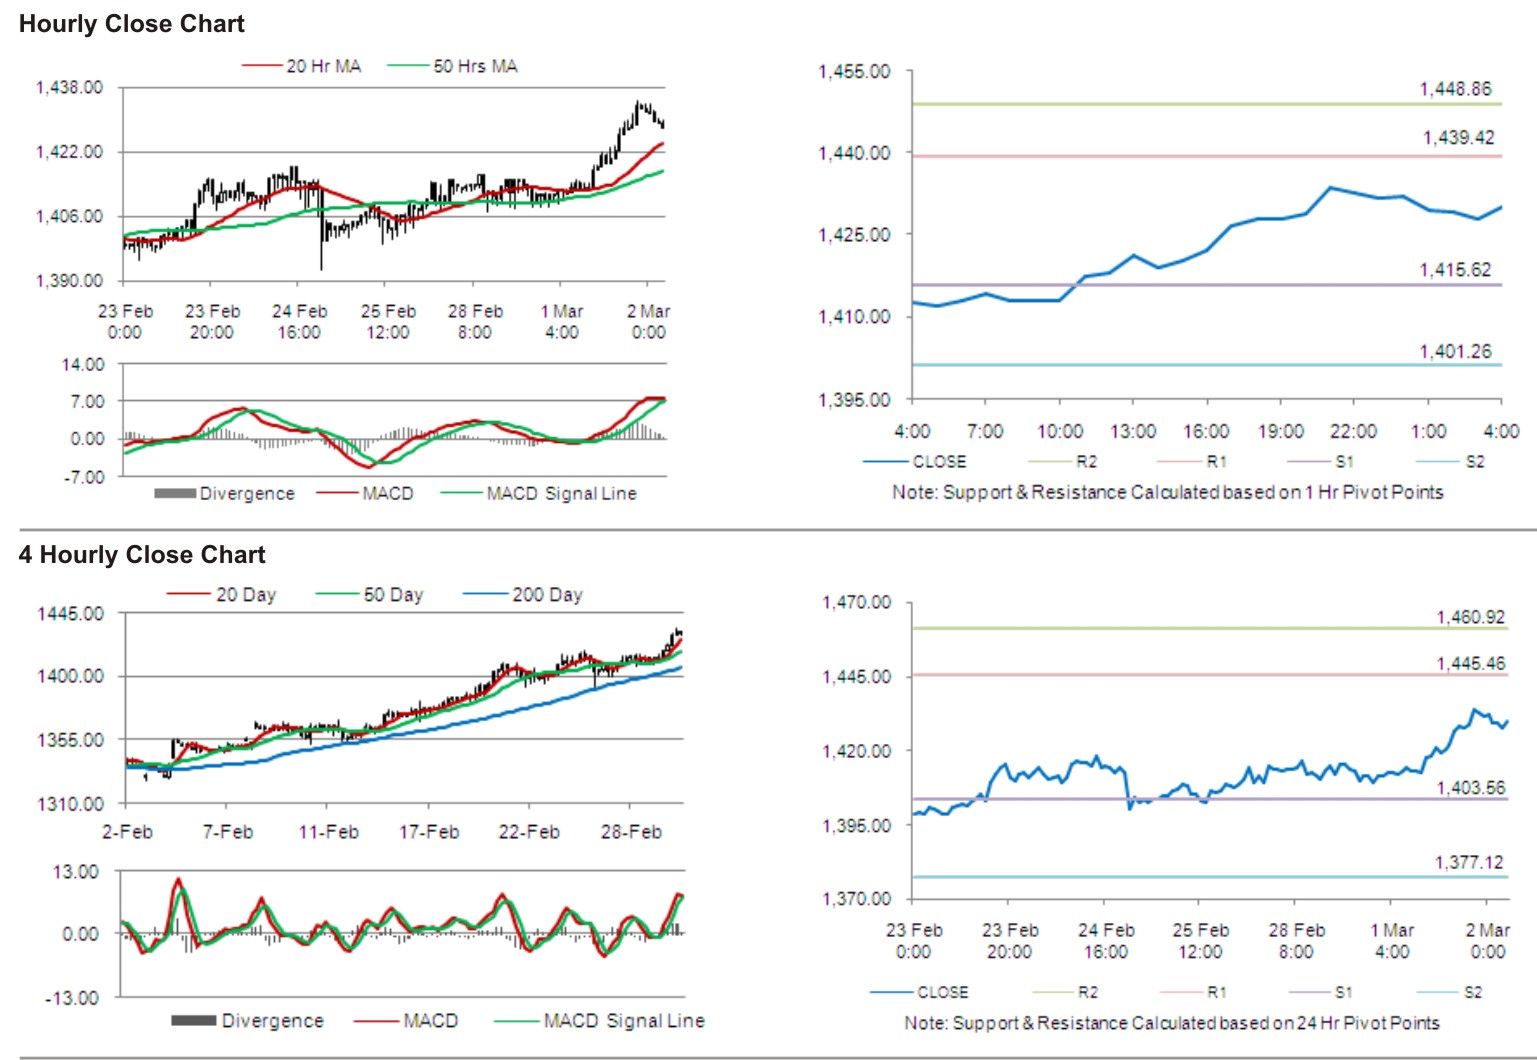
Gold prices traded higher by 1.43% against the USD in the 24 hour period ending 23:00GMT, at 1,431.79 per ounce.
In the Asian session at 4:00GMT, gold is trading at USD 1429.99 per ounce, 0.13% lower from 23:00GMT.
The pair is expected to find its first short term resistance at 1,439.42, with the next resistance at 1,448.86. The pair is expected to find support at 1,415.62 and subsequently at 1,401.26.
The pair is trading just above its 50 Hr moving average and well above its 20 Hr moving average.
Forex Daily Market Commentary provided by GCI Financial Ltd.
GCI Financial Ltd (”GCI”) is a regulated securities and commodities trading firm, specializing in online Foreign Exchange (”Forex”) brokerage. GCI executes billions of dollars per month in foreign exchange transactions alone. In addition to Forex, GCI is a primary market maker in Contracts for Difference (”CFDs”) on shares, indices and futures, and offers one of the fastest growing online CFD trading services. GCI has over 10,000 clients worldwide, including individual traders, institutions, and money managers. GCI provides an advanced, secure, and comprehensive online trading system. Client funds are insured and held in a separate customer account. In addition, GCI Financial Ltd maintains Net Capital in excess of minimum regulatory requirements.
DISCLAIMER: GCI’s Daily Market Commentary is provided for informational purposes only. The information contained in these reports is gathered from reputable news sources and is not intended to be U.S.ed as investment advice. GCI assumes no responsibility or liability from gains or losses incurred by the information herein contained.
ADP Non-Farm Figure Set to Generate Volatility
Source: ForexYard
The US dollar saw very little substantial movement during the Asian trading session as investors eagerly await today’s ADP Non-Farm Employment Change figure, set to be released at 13:15 GMT. Analysts are predicting the ADP number to come in below last month’s, which if true, would likely cause the greenback to turn bearish.
Economic News
USD – Dollar May Reverse Yesterday’s Gains Today
The USD had an unusually strong day yesterday, following the release of better than expected manufacturing data that boosted confidence in the US economic recovery. Following the release of the data, the EUR/USD began to tumble, eventually dropping close to 80 pips. Currently the pair is trading around the 1.3770 level. Similarly, the GBP/USD fell close to 70 pips, and is currently trading close to the 1.6240 level.
The day was not entirely positive for the dollar. Middle East turmoil is still driving investors toward safe haven currencies. As such, the greenback remains bearish against the Swiss franc. The USD/CHF cross dropped close to 40 pips since yesterday morning, and is currently trading around the 0.9280 level.
Today, investors are eagerly anticipating the release of the ADP Non-Farm Employment Change figure, set for 13:15 GMT. The figure is considered to be one of the most important US economic indicators, and heavy trading is expected as a result. At the moment, analysts are predicting a drop in the employment figure over last month. If true, the dollar could reverse yesterday’s gains.
In addition, the Fed Chairman is scheduled to testify 15:00. Should he continue to voice concerns over the unemployment situation in the US, investors are likely to short the buck in evening trading.
EUR – Euro Extends Bearish Trend
The EUR/USD unexpectedly turned bearish yesterday, as the combination of the pair hitting a key resistance level and positive US manufacturing data caused investors to short their positions. In addition, the euro has extended its losses against the safe-haven Swiss franc. The EUR/CHF has dropped close to 100 pips since yesterday afternoon, and is currently trading around the 1.2770 level.
While no significant euro-zone data is scheduled to be released today, traders will want to pay close attention to the US ADP Non-Farm Employment Change figure. If the figure comes in at 178K as expected, investors are likely to go long in their EUR/USD positions. At the same time, the ADP figure is notoriously hard to predict. A better than forecasted figure may cause the euro to drop further against the dollar.
JPY – Yen Moves Up Based on Safe-Haven Appeal
The yen’s appeal as a safe-haven asset led to gains in overnight trading against riskier currencies like the euro and UK pound. The EUR/JPY is currently down well over 100 pips from yesterday afternoon and is trading at 112.60. Meanwhile, the GBP/JPY has dropped around 95 pips in the same amount of time, and is currently trading around 132.90.
The combination of poor global economic indicators and the continuous uncertainties in the Middle East have caused investors to revert to less volatile currencies like the yen. While there are no significant economic releases out of Japan today, yen traders will want to continue to keep up to date about the situation in Libya. Further violence in the country is likely to continue to drive investors toward the yen.
OIL – Spot Crude Oil Closes above $100
Crude oil is once again trading close to the $100 a barrel level as investors remain concerned about the situation in the Middle East. Fears that the violence that has rocked Libya over the last week will spread to other oil producing countries continue to drive prices up.
Today, in addition to any developing news out of the Middle East, traders will also want to pay attention to the US Crude Oil Inventories figure, set to be released at 15:30 GMT. Analysts are predicting an increase in US stockpiles from last week. If true, the price of oil may actually go down during the evening session, as it would be a sign of decreased demand in the US.
Technical News
EUR/USD
Virtually all technical indicators on the 8-hour and daily charts are showing this pair trading in neutral territory. Traders may want to take a wait and see approach for the moment, as a clearer picture is likely to present itself as the day progresses.
GBP/USD
A bearish cross on the 8-hour chart’s Stochastic Slow indicates that the pair is in overbought territory and may see a downward correction in trading today. In addition, the Williams Percent Range on the daily chart is hovering in the overbought region. Going short may be the preferred strategy today.
USD/JPY
A bullish cross has formed on the 8-hour chart’s MACD, indicating that the pair could see upward movement today. This theory is supported by the Relative Strength Index on the daily chart. Going long appears to be preferable for this pair today.
USD/CHF
Both the Relative Strength Index and Williams Percent Range on the daily chart indicate that the pair is in oversold territory. Traders can take this as a sign that the pair may see an upward correction in trading today.
The Wild Card
NZD/JPY
The Relative Strength Index on the daily chart has just crossed over into the oversold zone, indicating the pair could see upward movement today. Furthermore, the 8-hour chart’s MACD has just formed a bullish cross. Forex traders now have an opportunity to open up long positions and catch this trend at the beginning.
Forex Market Analysis provided by ForexYard.
© 2006 by FxYard Ltd
Disclaimer: Trading Foreign Exchange carries a high level of risk and may not be suitable for all investors. There is a possibility that you could sustain a loss of all of your investment and therefore you should not invest money that you cannot afford to lose. You should be aware of all the risks associated with Foreign Exchange trading.
AUD Toying with Key Resistance Levels

For those watching, the persistent rise of the Australian dollar (AUD) was given impetus recently by soaring commodity prices. With Australia’s economy linked with the price of precious metals, the climb in Gold and Silver has been met by a rise in the Aussie as well.
What is interesting to note is where the Aussie has reached against a number of its currency rivals. Three pairs stand out in particular: AUD/USD, AUD/CAD, and AUD/CHF (see charts below).
These pairs are all testing price parity (the AUD/CHF is not necessarily testing it, but is close enough to warrant interest). Both the AUD/USD and AUD/CAD reached this price mark in October 2010 and have been flirting with this level ever since. The AUD/CHF reached it much sooner, but has since fallen below parity due to the Swiss franc’s rising appeal over the second half of 2010.
What is worth noting for the first two – but not necessarily the third – is that parity against the USD and CAD represents a price range which has historically lacked sufficiently sustainable support. The question then to ask is, Can the AUD hold its gains against these monetary giants?
The CAD is linked with Crude Oil prices which makes its decline versus the AUD somewhat intriguing. The fundamental support doesn’t appear as strongly in that pair, but the AUD is rising relatively faster regardless.
Making a speculative assessment, it seems the AUD is bouncing within a price range against a few of its primary rivals that has been historically difficult to break beyond. So long as precious metals continue to climb, which appears a given in today’s market, the AUD should continue to find support.
This makes it interesting to wonder why its value hasn’t climbed well beyond parity against these currencies. It may be even more interesting to ask about what forces are holding it back.
AUD/USD – Weekly Chart

AUD/CAD – Weekly Chart

AUD/CHF – Weekly Chart

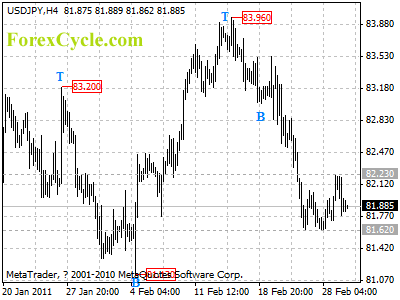
USDJPY traded in a range between 81.62 and 82.23
USDJPY traded in a range between 81.62 and 82.23. The price action in the trading range is treated as consolidation of downtrend from 83.96. As long as 82.23 resistance holds, another fall towards 81.13 support is possible after consolidation. However, a break above 82.23 will indicate that the fall from 83.96 had completed at 81.62 already, then the following upward move could bring price to 93.00 zone.
Video Trading Analysis: These 2 Stocks are ready to rocket higher?
By Adam Hewison
These two stocks popped onto our radar screen today thanks to our Trade Triangle technology.
In this short video you will see exactly how to best use our Trade Triangles and with just a few clicks, you’ll be spotting winning trades in minutes.
Some of you may have heard of these two stocks, but the chances are that they have been flying under the radar for the other 99% of traders. The good news is that our Trade Triangle technology is programmed to spot big moves when they begin, not months later after the market has moved and you are kicking yourself for not getting in sooner.
Today’s educational video shares with you how to get the most out of the markets in the least amount of time. I hope you enjoy it.
As always our videos are free to watch and there are no registration requirements. All we ask in return is that you tell your friends about MarketClub and this video and leave your comments on our blog.
All the best and enjoy the video.
Adam Hewison
President of INO.com
Co-founder of MarketClub
Why the “Safe Haven” Currencies Are Anything But Safe in 2011
Years ago, back in my stock broker days, I used to spend a lot of time on the phone with our high-end clients.
You could say that I made my living talking to millionaires. I’d chat with these guys worth more money than most of us make in three or four lifetimes.
Know what I learned?
Strangely the super-rich only wanted “steady, safe” investments. They wanted money market accounts and muni-bonds of all things – just because they seemed “safe.”
Well, then the credit crisis hit. Suddenly even those “safe” money market accounts were losing money. And muni-bond prices fell off a cliff.
In short, all of a sudden these “safe” assets weren’t safe anymore.
This isn’t uncommon. There is always a point where safe, steady investments suddenly turn a corner and become more risky.
During the credit crisis, we saw plenty of these “safe” investments fall by the wayside. and it’s about to happen again – in the currency market.
It’s the reason why I’m shorting these two so-called “safe haven” currencies this year.
These Two “Safe Currencies” Are
About to Come Under Attack
You have probably heard the terms “defensive currencies” or “safe haven” currencies. It refers to the currencies that rise in value when markets fall apart. Not surprisingly, these currencies did very well during the global recession.
…the Japanese yen and Swiss franc.
These two currencies have soared against most currencies for the past three years in a row. So the masses will think that there’s no reason why the party should come to an end now.
Heck, these currencies are on a roll – they have to keep rising, right? Well that may be what everyone believes. The reality is a bit different.
A shift is coming in these currencies. It’s a “tipping point” that they are beginning even now. The problem now is that these “safe” assets have gotten too strong for their own good.
Why I Believe the Yen & Franc
Rallies are About to End
Honestly, if you know what you’re looking for, it’s almost easy to see why the Japanese yen and Swiss franc are about to fall. Here’s a closer look at why…
- These strong currencies are killing their exporters. As an exporter, you want a cheap currency, because it makes your exported goods appear cheaper in the global market. Right now, Switzerland and Japan are facing the opposite problem – their currencies are so expensive that it’s hurting all these exporters. In fact, the biggest companies in Japan and Switzerland have been bleeding money because their currencies are simply too strong. That means these currencies will have to drop in value sooner rather than later.
- These strong currencies are slowing down the Swiss and Japanese economies. There’s a saying that the cure for higher prices is…higher prices. The higher prices go, the more it will zap the demand. Eventually prices reach a point when most people can’t afford it. Then the price tanks down to a level to finally meet the demand in the market again. Well, just as higher prices slow down the sales of a product, they also slow down the sales of goods and services within a country. That in turn hurts the country’s GDP. As the higher price currency slows down the country, it eventually makes the currency drop due to the dire economic outlook that the strong currency brought about. That’s about to unfold in the months ahead.
- These strong currencies are crushing stock prices, which crushes the sentiment in these countries. As stock prices fall, the whole country loses faith in the markets. Think about it. If your 401k and IRA are doing well, you’re happy and you spend more. However, if your 401k and IRA are sinking in value, you become more cautious. You start cutting back and spending less as you suddenly feel poorer. So crashing stock prices hurts investor sentiment. That can turn into a vicious cycle. And as the strong currency chips away at the earnings of these enormous exporters, it’s going to bring down their stock price and the overall sentiment in the country along with it.
- My Flash Point Indicator is showing that these currencies are about to head south! My Flash Point Indicator is really more of a system. It’s a combination of several technical indicators I watch. Right now, my entire system is saying that the yen and franc are coming down off their lofty levels.
How to Play this Trend for 2011
In short there are plenty of reasons both fundamental and technical that tell me these two safe havens are about to sink in value.
Now there are several ways you can play this (including ETFs etc. in the stock market). But my favorite ways are in the spot Forex market.
Already this year, I’ve been playing some stronger currencies against the sinking Japanese yen for my Currency Cross Trader subscribers.
We have already grabbed three 100 pip winners this year simply by pairing stronger currencies against the sinking Japanese yen. Soon, we will be doing the same with the overbought Swiss franc.
So get ready for the yen and franc to continue the process of softening and then beginning an outright downtrend later on in the year.
Bottom line: Nothing stays safe forever. Look to short the Japanese yen and Swiss franc this year.
Have a Nice Day,

Sean Hyman, Editor
Currency Cross Trader
blog: http://wcw.worldcurrencywatch.com
Swedish Krona Rallies
By Russell Glaser
Both the USD/SEK and the EUR/SEK have fallen to new lows as central bank comments show the Riksbank attempting to rein in inflation in light of rising commodity prices and strong GDP growth.
Hawkish comments from the Riksbank caused yesterday’s surge in the value of the krona with tougher talk on inflation coming from the central bankers during the last monetary policy meeting on February 14th.
The bankers suggested what might motivate them to increase the base interest rate more than the typical 25 bp. During the previous meeting the monetary policy committee increased Sweden’s repo rate by 0.25% to 1.5%.
At the previous meeting, the Riksbank stressed growth in Sweden remains strong as is unemployment, but both have slowed recently due to the rise in commodity prices. The central bank also noted noticeable improvement in the US economy has helped the Swedish economy. However, uncertainties remain in the euro zone.
The current inflationary target for the Riksbank stands at 2.0%. However, in January the rate of inflation rose 2.5% when measured on a yearly basis. In December the rate of inflation measured 2.3%.
The next meeting for the monetary policy committee will take place on April 19th with the results of the meeting to be released the following day. Here the Riksbank may once again increase interest rates to stymie persistent inflation, further boosting demand for the krona.
On the heels of the release of the meeting minutes, the Swedish krona surged to new highs versus both the dollar and the euro, shrugging off negative retail sales data that came in below forecasts, -0.1% on expectations of a 0.7% increase.
The USD/SEK made two significant technical moves yesterday, falling below the support line at 6.3540 and holding at the 6.2890 level. The move is a breach below the falling wedge pattern that has held since October 2010. A close below the lower line of the wedge may incite further selling of the pair. Resistance is found at this week’s high at 6.4450 and the February high of 6.5400.

Forex Market Analysis provided by ForexYard.
© 2006 by FxYard Ltd
Disclaimer: Trading Foreign Exchange carries a high level of risk and may not be suitable for all investors. There is a possibility that you could sustain a loss of all of your investment and therefore you should not invest money that you cannot afford to lose. You should be aware of all the risks associated with Foreign Exchange trading.
