Silver Likely to See Bearish Move

By Dan Eduard

Following the steep increase in the price of silver in recent days, it appears that the precious metal may be due for a downward correction. Technical signals are indicating that bearish movement may be impending, which could bring prices down to the 34.50 level.

We will be analyzing the 8-hour silver chart, provided by Forexyard. The technical indicators being looked at are the Relative Strength Index, Stochastic Slow and Williams Percent Range.

1. The Relative Strength Index is currently at the 80 level, well in the overbought zone. This is typically a sign that a bearish move is likely to occur in the near future.

2. A bearish cross has formed on the Slow Stochastic, indicating a downward correction may take place.

3. Finally, the Williams Percent Range remains well in overbought territory. This can be taken as a sign that the price of silver is likely to drop, giving traders an excellent opportunity to open sell positions for a potentially significant profit.
tech

Forex Market Analysis provided by ForexYard.

© 2006 by FxYard Ltd

Disclaimer: Trading Foreign Exchange carries a high level of risk and may not be suitable for all investors. There is a possibility that you could sustain a loss of all of your investment and therefore you should not invest money that you cannot afford to lose. You should be aware of all the risks associated with Foreign Exchange trading.


GBP Shines As Interest Rate Expectations Rise

Source: ForexYard

The British pound performed well today following greater than expected inflation data that increased expectations for an interest rate increase by the Bank of England. The Aussie dollar also put in a strong showing, building on momentum and strong fundamentals.

Economic News

USD – CAD Falls on Disappointing Retail Sales

The Canadian dollar slumped yesterday as retail sales surprisingly declined -0.3% m/m in January after a -0.2% decline in December. Market expectations were for a rise of 1.0%. Core retail sales were unchanged from the previous month with economists forecasting a rise of 0.8%. The decline in retail sales is the second consecutive drop in Canadian retail sales and is a chink in the armor of the Canadian economy.

Canada had the strongest growth of the group of 7 nations in the 4Q and employment numbers have rebounded nicely, but consumption has been a laggard as displayed by the last two monthly retail sales reports. The Bank of Canada also expects the housing market to slow. Given the slowdown in consumer spending and expected slowdown in the housing sector, the market may begin to price in a pause in rising Canadian interest rates.

Yesterday the USD/CAD rose to a high of 0.9813 before trading back at 0.9809. The pair opened the day trading at 0.9781. Technicals show the USD/CAD remains in a sharp downtrend despite last week’s rebound in the value of the pair to the 100-day moving average. Strong bids may be seen at this level. Resistance comes in at last week’s high of 0.9970 and 0.9815. Support is found at yesterday’s low at 0.9750 and the yearly low of 0.9666.

EUR – Pound Rises on Increasing Inflationary Pressures

The pound was a strong performer today after the release of higher than expected CPI data brought strong bids to sterling. UK y/y CPI rose by 4.4%. The previous year’s UK CPI rose 4.0%. Economists had forecasted a rise in prices of only 4.2%. UK core inflation came in at 3.4% on expectations of 3.1%.

Higher than expected inflationary data has given traders reason enough to bring forward expectations for an interest rate hike which would strengthen the pound versus the dollar as the US still remains in a state of monetary policy easing. The BOE could begin raising rates as early as May. Currently the Official Bank rate of Britain stands at 0.5%.

The end result of the data release prompted traders to buy the pound and the GBP/USD moved to its highest level this year, rising to 1.6400 from an opening day price of 1.6300.

The UK budget will be released later today as well as BOE meeting minutes which may show a hawkish tone from the central bank.

Further gains should be expected from the pound as momentum is currently rising on both the daily and the weekly charts. Resistance for the GBP/USD should be the January 2010 high at 1.6460 with a long term target at the November 2009 high of 1.6875.

JPY – Yen Exchange Rate Begins to Stabilize

A noticeable drop off in volatility of the Japanese yen characterized yesterday’s trading. This lends to the theory that coordinated intervention by the Japanese Finance Ministry and the G7 nations has succeeded.

The 14-day Average True Range for the USD/JPY stands at 1.31, or 131 pips. Yesterday’s volatility was well below that level with the pair only moving 48 pips.

The pair closed the day near its opening price 80.94. Other Japanese crosses also had relatively low volatility. Judging from the significant drop off in volatility, the intervention could be deemed a success. Speculators who were buying yen on expectations of insurers repatriating foreign currencies to Japan in order to pay insurance claims from the earthquake and tsunami may have been driven out of the market at the hand of the G7.

The Aussie dollar put in a strong performance yesterday that caps a solid 3-day run. The AUD/USD rose as the pair may have been undervalued following the disaster in that Japan which caused some market participants to slow expectations for rising interest rates by the Reserve Bank of Australia.

The AUD/USD climbed to a high of 1.0127 before closing at 1.0110. Last week the pair fell to a low at 0.9704 where bids were seen near the 200-day moving average. Resistance for the pair is located at 1.0200 followed by the all-time high of 1.0255. Support is found at 0.9940.

Crude Oil – Falling Dollar Supports Rising Crude Prices

Dollar weakness gave support to spot crude oil prices as the commodity strengthened by 1.8% yesterday, climbing to their highest level since the natural disaster in Japan. Increased fighting in Libya and further protests in the Middle East has kept the crude market in fear of supply disruptions.

Yesterday, spot crude oil prices finished the day near their high at $104.99 after opening the day at $103.84.

Increased fighting in Libya along with the crash of a US F-15 fighter plane raised concerns of a prolonged conflict in Libya which would limit the return of Libyan supplies to the market.

Also adding to tensions was a defection of Yemen army brass to opposition parties, which has raised fears of turmoil in Yemen. Despite Yemen’s lack of being a major crude oil producer, its proximity to Saudi Arabia who is a major supplier of crude oil will likely increase tensions in the region.

Today US weekly crude oil inventories will be released and expectations are for a rise of 2.0M barrels. The previous week saw an increase of 1.7M barrels. While Libya is not a supplier of crude oil to the US, it does supply significant amounts to Europe, particularly Italy. A larger than expected draw-down in US crude oil supplies should be another reason for crude oil bulls to continue with yesterday’s buying.

Technical News

EUR/USD

Yesterday the pair reached a new 2011 high at 1.4247 before falling back during the Asian trading session. The uptrend is firmly intact with the 20-day simple moving average providing support, coming in at 1.3970. Traders should be looking to buy on dips in the pair with resistance coming in at 1.4280 followed by 1.4580.

GBP/USD

Momentum has shifted to the upside as monthly, weekly, and daily momentum are all pointing higher, signaling further potential gains. The pair is currently testing the trend line off of the 2007 high. A close above this level may bring additional bids to the pound. Targets for the pair are 1.6275 and 1.6875.

USD/JPY

Volatility for the pair has significantly fallen off following intervention by the G7 to stabilize the yen. A move below the 80 level may bring further action by the world’s central banks. Traders may want to be patient with the pair to find better entries. Shorts could be initiated near the 200-day moving average at 83.

USD/CHF

Following the breakdown in the value of the pair, a bearish pennant pattern has formed. An estimate of the move from the consolidation pattern would drop the pair 400 pips near the 0.8600 level. Support for the pair comes in at 0.9130.

The Wild Card

USD/CAD

The pair appears to find significant resistance near the 100-day moving average line. Opportunities to enter short on the pair near this level at 0.9940 may allow forex traders to enter into the downtrend with targets at the swing low on the daily chart at 0.9666.

Forex Market Analysis provided by ForexYard.

© 2006 by FxYard Ltd

Disclaimer: Trading Foreign Exchange carries a high level of risk and may not be suitable for all investors. There is a possibility that you could sustain a loss of all of your investment and therefore you should not invest money that you cannot afford to lose. You should be aware of all the risks associated with Foreign Exchange trading.

Daily Market Review for the 23.03.2011


GBP-CHF

In the daily time frame the pair got back to the resistance point (blue area) that is located between 1.4890 to 1.4830, in addition very close to the downtrend line peak of February 15th, due to the fact that the CC150 is still under the 100th level (blue level) there is a high potential that this area will be used as a good resistance to short position in the lower ranges.

Graph A:

Graph B:

Potential Trade   

There is the Short position after the stop of the price pattern M or the breakdown of the range in the hourly time frame with half the indicator RSI of the 50th level downward.

Target- depth of the patter/range.

EUR-JPY

The pair presses on the upper area of the range in the weekly time frame after a major hammer that created a third channel point to the range. The CC150 indicator tries to give an angle above the 0 line and acknowledges the break out of the above range in the case that if it would occur.

In the 4 hour time frame the price did not make a Fibonacci resistance of the uptrend, so maybe the price will search for the better support levels from its current location before the above break out, the supporting levels are:

  1. The area 113.50 – moving average area 200 and 23.6 Fibonacci of the uptrend
  2. The area 112.00 – resistance 38.2 of the uptrend

As can be seen by the graph bellow:


Silver Likely to See Bearish Move

printprofile

Following the steep increase in the price of silver in recent days, it appears that the precious metal may be due for a downward correction. Technical signals are indicating that bearish movement may be impending, which could bring prices down to the 34.50 level.

We will be analyzing the 8-hour silver chart, provided by Forexyard. The technical indicators being looked at are the Relative Strength Index, Stochastic Slow and Williams Percent Range.

1. The Relative Strength Index is currently at the 80 level, well in the overbought zone. This is typically a sign that a bearish move is likely to occur in the near future.

2. A bearish cross has formed on the Slow Stochastic, indicating a downward correction may take place.

3. Finally, the Williams Percent Range remains well in overbought territory. This can be taken as a sign that the price of silver is likely to drop, giving traders an excellent opportunity to open sell positions for a potentially significant profit.
tech

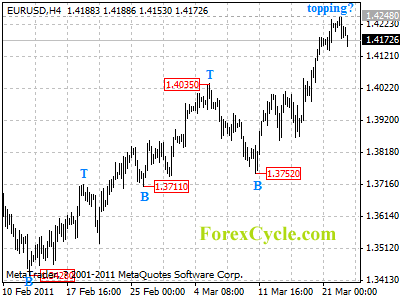
EURUSD pulled back from 1.4248

Being contained by 1.4281 (Nov 4, 2010 high) resistance, EURUSD pulled back from 1.4248, suggesting that a cycle top is being formed on 4-hour chart. Range trading between 1.4100 and 1.4248 is expected in a couple of days. However, the fall from 1.4248 is treated as consolidation of uptrend from 1.3752, another rise towards 1.4500 is still possible after consolidation, and a break above 1.4248 could signal resumption of uptrend.

eurusd

Daily Forex Analysis

Daily Wrap: 3/22/11

A 3-day winning streak came to an end on Wall Street today as stocks finished lower in the wake of airstrikes in Libya, which sent oil prices higher once again. Meanwhile, the impact from the crisis in Japan is far from over.

Warren Buffett Looking At India For Investments

Warren Buffett is visiting India for the first time ever, and the billionaire master investor said he sees the subcontinent as “a logical investment destination,” and is looking at opportunities to invest in the massive country. He said his firm, Berkshire Hathaway (NYSE:BRK.B,NYSE:BRK.A) is actively looking at large countries like India for investments, adding he considers the country much more than an “emerging market.” India is the second most populous country in the world after China, but is far more densely populated. Buffett spoke in Bangalore, where he visited TaeguTec India, a unit of Israeli manufacturer Iscar, in which Buffett bought a majority stake four years ago.

Canadian Retail Sales fall, Leading Indicators on rise. Loonie on defensive in Forex Trade

By CountingPips.com

The Canadian dollar has been on the defensive today in forex trading action as data released showed that Canadian retail sales decreased unexpectedly in the month of January. Retail sales declined by 0.3 percent to C$37.1 billion in January following a 0.2 percent decrease in December, according to the monthly report released by Statistics Canada today.

The fall in retail sales was unexpected as economic forecasts were looking for a 1.0 percent increase for the month.

Core retail sales, excluding automobile sales, were unchanged in January following an increase by 0.6 percent in December. The flat reading in core sales was below the forecasts that were expecting a 0.7 percent increase.

Contributing to the slide in the retail sales numbers was a decrease in motor vehicle sales and parts dealers by 1.5 percent in January. Gasoline station sales also had a declining month with a decrease of 1.4 percent while furniture and home furnishing sales fell by 2.3 percent in January.

Positively contributing to the monthly retail sales report was an increase at food and beverage stores by 0.7 percent while general merchandise store sales increased by 1.2 percent for the month.

Canada’s Leading Indicators rise in February.

A separate data release from Statistics Canada showed that the Leading Indicators index rose by more than expected for the month of February. The Leading Indicator Index, which measures future economic activity, advanced by 0.8 percent in February following an increase of 0.4 percent in January. Market forecasters were looking for a 0.7 percent advancement on the month.

Boosting the leading indicator index was an increase in stock market index by 2.7 percent while the housing index indicator rose by 1.8 percent. The new orders for durable goods indicator advanced by 1.0 percent and furniture and appliance sales gained by 0.9 percent.

Nine out of the ten components that make up the leading indicator index had increasing levels in February. On the downside, the business and personal services employment index declined by 0.2 percent in February.

Canadian dollar on defensive vs major forex currencies

The Canadian dollar has been trading lower today in the currency markets against the other major currencies. The Canadian dollar also known as the “loonie”, has lost ground verses the U.S. dollar, British pound sterling, Japanese yen, Australian dollar and the New Zealand dollar while trading virtually unchanged against the euro, according to currency data from Oanda in the US session afternoon.


Asian market wrap: Very little movement in Asia; By FastBroker Research Team

Written by FastBrokers House
2011-03-22 00:00

It’s been a very slow day in Asia with the majors trading inside 30 pip ranges. Japanese financial markets returned after a long weekend, with the Nikkei putting on an additional 3%.

USD/JPY opened at 81.10, rose to 81.30 just before the Tokyo open as dealers bet on more BOJ action. These positions were then cut in early afternoon trade as it became obvious that the BOJ were not going to intervene. Ranges: 80.88/81.30, EUR/JPY 115.03/52

EUR/USD closed in NY at 1.4220 and has spent the majority of the session near that same level. Range: 1.4201/31

AUD/USD tried to rally in early trade as traders again bet on a risk-on day and possible intervention. This momentum also dissipated quite quickly when the pair couldn’t best the overnight highs. Ranges: 1.0035/67

Cable has been similarly quiet ahead of the CPI data in a few hours time. Ranges: 1.6290/1.6316, EUR/GBP .8709/25

Market Commentary provided by FastBrokers.

Disclaimer: FastBrokers’ market commentary is provided for information purposes only and under no circumstances should be regarded neither as an investment advice nor as a solicitation or an offer to sell/buy any financial product. FastBrokers assumes no responsibility or liability from gains or losses incurred by the information herein contained.

Risk Disclosure: There is a substantial risk of loss in trading futures and foreign exchange. Please carefully review all risk disclosure documents before opening an account as these financial instruments are not appropriate for all investors.

Mozilla Launches New Firefox 4 Browser

The Mozilla Corporation officially launched its Firefox 4 web browser today, 8 months after it first entered public beta testing. The primary goals for the new browser were improvements in performance, standards support, and the user interface. Some are wondering whether Mozilla Firefox, currently the world’s most popular web browser, has lost its edge. The 8-month beta period was longer than Microsoft’s (NASDAQ:MSFT) 6-month beta for Internet Explorer 9, which launched last week, and in the 2 years since Google’s (NASDAQ:GOOG) Chrome browser was launched, it has upgraded 10 times. Mozilla has had trouble meeting release dates historically, and Firefox 4 required an astounding 12 beta releases before the company was willing to sign off on the product. The firm has now decided to step back and reevaluate its product plans, with the goal moving forward to complete smaller, less ambitious releases in a timelier manner. Mozilla VP Mike Shaver explained, “The intention here is not to rush features, it’s to let features that are done get to users without waiting for features that aren’t.” Certain features of the new browser had been finished for months, but couldn’t be released separately because they relied on other, uncompleted features. Firefox 4 has an overhauled, faster JavaScript engine, bookmark syncing, a clean new user interface, and it still runs on Windows XP, whereas even Microsoft’s IE 9 does not. From an overall performance standpoint, however, Firefox 4 trails both Chrome and IE 9, and it still separates its address bar and search bar, whereas the other browsers have combined those into 1 integrated bar. The Mozilla Corporation is a wholly owned subsidiary of the Mozilla Foundation, a 501(c)(3) organization that exists to support and provide leadership to the open source Mozilla project. The Mozilla Corporation had revenue of $91.3 million in 2009, the most recent year available.