Bullish Bias On The Philippine Peso

USDPHP, USD/PHP, US dollar, philippine peso, bangko sentral ng pilipinas, ron acoba, BSP Governor Amando Tetangco Jr., Ron Acoba, daily forex picks, forex trading, forex market, descending channel, symmetrical triangle

Both technical and fundamental data support a bullish bias for the Philippine peso against the US dollar (bearish USDPHP). Let me show you how. 

Technically, the USDPHP pair has continued to trade within a descending channel after it broke down from a symmetrical triangle formation. Now, as long as this current trend persists and until a reversal takes place, it is likely that the pair would resume moving along its present direction. Zooming closer, the Philippine peso has been exchanging at around PHP 43.500 to a dollar for the past several days. In any case, any increase in buying appetite for the peso could have it appreciate back to PHP 42.00.

On the fundamental side, the Bangko Sentral ng Pilipinas (BSP) is set to publish its monetary policy decision some time today. the central bank is widely expected to hike its benchmark interest rate by 25 basis points to 4.25% due to the previous higher-than-expected inflation rate in the Philippines and the jump in the commodity prices, particularly crude oil, because of the political turmoil in the Middle East.

The year-over-year inflation in the Philippines in February surged to 4.3%, surpassing the central bank’s forecast of only 3 to 4.1%. January’s figure was only at 3.6%. Given the unexpected rise in inflation, it is normal for the BSP to adjust its monetary stance to control any changes in prices. One way that it could so is by raising its overnight interest rates. Such would discourage excess lending and spending that would therefore dampen inflation.

The political turmoil in the Middle East, first it was Egypt and now it’s Libya, has been causing a lot of panic in the financial markets as well. The WTI crude oil has suddenly jumped back to above $105.00 per barrel due to concerns that the “war” in Libya could have a negative impact on the supply of oil.

While some economists believe that the BSP could just follow the European Central Bank (ECB) in keeping its rates unchanged and just being a little more hawkish in its statements, either of the two would still be bullish for the Philippine peso. You see, being “hawkish” means that inflation is still expected to rise in the future. Such would then be, of course, “priced in” by the market. An interest rate hike, however, would generally quickly reflect on the peso.

More on LaidTrades.com

Oracle Said It Will Cease All Efforts To Develop Technology around Intel’s (NASDAQ:INTC) Itanium chip

Oracle (NASDAQ:ORCL) said that it will cease all efforts to develop technology around Intel’s (NASDAQ:INTC) Itanium chip, which reportedly took Intel and Hewlett-Packard (NYSE:HPQ) by surprise. The company said its decision on the chip came after multiple conversations with Intel senior management, which made it clear that their strategic focus is on their x86 microprocessor and that Itanium was nearing the end of its life. HP issued a statement saying, “We are shocked that Oracle would put enterprises and governments at risk while costing them hundreds of millions of dollars in lost productivity in a shameless gambit to limit fair competition.” Oracle has a potential upside of 14.6% based on a current price of $31.41 and an average consensus analyst price target of $36.

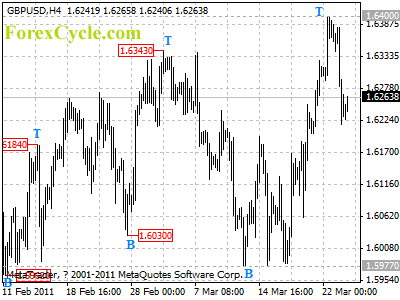
GBPUSD pulled back from 1.6400

After breaking above 1.6343 resistance, GBPUSD pulled back from 1.6400. However, the fall from 1.6400 is treated as consolidation of uptrend, as long as 1.6185 support holds, another rise towards 1.6500 is still possible after consolidation. However, below 1.6185 will indicate that lengthier consolidation of uptrend is underway, then deeper decline to 1.6000 area could be seen.

gbpusd

Daily Forex Forecast

Options Report:March 23,2011

Welcome to the Financial News Network Options Report.On the call side, D.R. Horton is seeing close to 14 times the normal amount of calls today despite a disappointing new home sales report. MELA Sciences and Dollar Tree calls are at around 5.5 times the average volume as investors are betting bullishly on the companies. Motricity calls are at 4.7 times the average amount after Jim Cramer mentioned the company positively. Northern Oil & Gas calls are also seeing heavy volume today, close 4.5 times the average amount, despite shares of the company being down around 10% today.Taking a look at the put side of the ledger, Cameron International puts are at over 6.5 times the average amount today after the company was named in the review of the BP Oil Spill by the US Government. Nexen puts are at 4.5 times their normal volume, as investors look to be bearish on the company today. Best Buy puts are at 4.5 times the average amount ahead of their quarterly earnings report before the market opens tomorrow. Finally Dell puts are at 4.3 times the average amount today bearish bets by investors. This has been you daily options update from the Financial News Network. Stay tuned for more insight into where the big money is placing their bets each day

De Vaulx Says He’s Adding to Japan Stock, Gold Holdings

March 23 (Bloomberg) — Charles De Vaulx, portfolio manager at International Value Advisers LLC, and Mark Travis, chief executive officer at Intrepid Capital Corp., talk about investment strategy. De Vaulx and Travis also discuss the performance of U.S. stocks. They speak with Pimm Fox and Julie Hyman on Bloomberg Television’s “Taking Stock.” (Source: Bloomberg)

Japanese Gov’t Expects Cost of Earthquake, Tsunami to be as much as $308 billion

The Japanese government said Wednesday that the economic cost of the earthquake on March 11 and tsunami could be as much as $308 billion, which is more than double the cost of the Kobe earthquake that happened in 1995.Construction and related costs are expected to total 16 trillion to 25 trillion yen, according to reports. The estimate is focused on infrastructure-related damages, as well as damages to homes, factories and other buildings. However, it does not take into account losses related to the nuclear-power plant.The report also said that the disaster is expected to knock about half a percentage point off economic growth in the next fiscal year.

Goldman Sachs CEO Blankfein to Be Called in Galleon Insider-Trading trial

U.S. federal prosecutors plan to call Lloyd Blankfein, the chief executive of Goldman Sachs Group Inc. (GS) to testify in the insider-trading trial of Galleon Group hedge-fund manager Raj Rajaratnam, MarketWatch and other news outlets report. In a letter to U.S. District Judge Richard J. Holwell, prosecutors said they intend to call Blankfein to testify regarding Rajat K. Gupta, a former Goldman director who the Securities and Exchange Commission has accused of passing confidential information to Rajaratnam. The prosecutors said they want Blankfein to testify on “Gupta’s service on the Goldman Sachs Board of Directors, the duties of confidentiality that Gupta owed to Goldman Sachs, and certain confidential information that Gupta obtained through his service on Goldman’s board in 2008.” The prosecutors sought to limit the defense from questioning Blankfein over Goldman’s role in the financial crisis or any pending investigations of Goldman. Such questions would be irrelevant because “this office has not notified Mr. Blankfein or Goldman Sachs that either is a target (or, for that matter, a subject) of any pending criminal investigation,” they wrote, according to the news reports.

A Major Technical Turning Point for the S&P 500

By Jared Levy, Editor, Smart Investing Daily, taipanpublishinggroup.com

Eleven days ago, I noticed a major shift in some closely watched correlations and saw a marked change in some of the indicators that I follow, indicating a further breakdown in the markets. At the time of that Smart Investing Daily article, the index (SPX) was trading at about 1,305. After a 55-point (4%) drop, the markets as of this past weekend looked like they might be finding some support, but don’t be fooled.

The S&P 500 gives us an excellent representation of the broad market and many chartists (including me) turn to it for guidance on the overall direction of the market.

For the near term at least, I have major concerns about the technical bullish “trend” that we had been in up until mid-February. It’s quite common for stocks to take a “breath” and either move sideways (consolidate) or actually move lower for a short period, then resume trend higher.

A break in a bullish trend is normal, but when major basic indicators no longer support a “bullish” trend, it may be time to reverse course. This might be what is happening now. This bearish sentiment is also backed by some key fundamental data. Also, don’t let one or two-day rallies fool you into a false sense of confidence.

Patterns Emerge

Looking at the chart below (taken before the open on Monday), you can see the convergence of the 20-and 50-day moving averages. That level of about 1,302 is an area that I have deemed the “fail point,” clearly marked with a red arrow. You probably won’t find this term in any technical charting books, but it’s really simple to understand.

When the 20-day moving average crosses below the 50-day, this can indicate a change in a short-term trend (perhaps lasting a couple weeks). Furthermore, if the stock’s price, or in this case the S&P 500’s price, is below the 50-day, that is even more reason to stay bearish.

*I began writing this at 4 a.m. on Monday before a day of travel — amazing how the S&P moved right to the 1,300 mark…

Check this out:

Daily chart of the S&P 500 back to October 2010
S&P 500 Index
View larger chart

We are at a serious inflection point in the market at least from a technical perspective. If the S&P hits that level of 1,302 and does not climb above it with strength and hold there, I would NOT be looking to get long! Even worse would be a complete failure of the index at that level. To me, a failure could spark some serious selling.

I’m not saying that the market can’t recover in time; I am specifically referencing the action for the next couple of weeks, perhaps until earning season begins.

If we don’t rally at all from here, look to the 1,264 level for some support; then the next leg down could take us to 1,224. The latter may be more realistic given the circumstances.

The Pieces Don’t Fit

Housing

I have heard the argument that the P/E ratio of the total S&P 500 is relatively low. I know that some are saying housing is slowly recovering, but you know that’s just not good enough. For most Americans their home is the only asset (besides stocks) that keeps up with inflation.

Since home prices have been retreating to pre-2003 levels, one would think that if we were truly recovering and Americans realize that their home is just the only thing that can keep up with inflation, existing home sales would be screaming — but they are NOT. Granted, they have strengthened, but we saw the same thing last year, then a fizzle (take a look at the chart below). Without a stable housing market, I have a problem with betting the farm on a real recovery.

Month-over-month sales figures for existing homes
 Sales Figures for Existing Homes
View larger chart

Below is the Case-Shiller home price index, showing percentage change in prices. It doesn’t look so hot.

Case-Shiller Home Price Index
View larger chart

Perhaps we are going to truly have a jobless recovery (here in the U.S.). From my vantage point, it’s no longer about U.S. employment, but population growth, modernization and employment abroad that is fueling the majority of the “recovery” here in the States. So I guess the American worker is screwed, but our GDP and stocks can still grow?

Take a look at the unemployment rate chart (month over month) below; does that chart spell strong consumer to you?

(P.S. This chart does not include the total unemployment rate, nor does it adjust for skew in the size of the “labor” pool. More on that later…)
Unemployment rate chart (month over month)
Unemployment Rate Chart
View larger chart

Inflation

So you would think if more people were unemployed and their houses worth less, inflation must be low… maybe prices are even dropping. Nope…

Well, Chairman Bernanke doesn’t seem too worried, but take a look at the chart below. It displays the monthly changes in average prices that consumers pay for goods, on a year-over-year basis. Again, it doesn’t take a rocket scientist to see that prices and unemployment are still very high and our home values are basically dead in the water.

CPI monthly percentage change year over year
CPI Monthly Percentage
View larger chart

(Investing doesn’t have to be complicated. Sign up for Smart Investing Daily and let me and my fellow editor Sara Nunnally simplify the stock market for you with our easy-to-understand investment articles.)

Putting the Puzzle Together

Something’s got to give and I don’t know if it’s prices — food, materials, energy, etc. — or stocks themselves suffering from higher input costs and weak consumer demand.

But you know, with all that’s going on in the world, I don’t see oil dropping sharply within the next month. Top that off with continued demand from China and the globe for food and infrastructure, and I don’t see a sharp decline in food or material demand.

I am more concerned about the profitability of companies that can’t generate as much revenue from high material, food and energy costs and that can’t make millions on a weak consumer. There are many companies that fall into this category.

Consumer spending around the world is what will drive demand in those businesses. The conundrum is that there are many companies that have benefited greatly from the rise in energy, food and materials, and perhaps they towed the rest of the market along for the ride.

Right now, the American consumer is still struggling to a great extent on average, and at the end of day, I don’t care how good “consumer sentiment” is; without consumer real strength (not some monthly sentiment reading), many companies can’t grow profits. A wise man once told me that stocks can’t go higher without increasing profits (for very long).

We will know soon enough when earnings season begins April 11.

Editor’s Note: Things are about to change drastically in the U.S. and around the world. But it may not be the reason you think. There’s a growing crisis creeping just under the surface of our nation’s financial problems. When this “under-crisis” finally breaks through the surface, expect all hell to break loose.

Find out where the real danger lies in this exclusive investment report.

About the Author

Jared Levy is Editor of WaveStrength Options Weekly, our options trading research service and Co-Editor of Smart Investing Daily, a free e-letter dedicated to guiding investors through the world of finance in order to make smart investing decisions. His passion is teaching the public how to successfully trade and invest while keeping risk low.

Jared has spent the past 15 years of his career in the finance and options industry, working as a retail money manager, a floor specialist for Fortune 1000 companies, and most recently a senior derivatives strategist. He was one of the Philadelphia Stock Exchange’s youngest-ever members to become a market maker on three major U.S. exchanges.

He has been featured in several industry publications and won an Emmy for his daily video “Trader Cast.” Jared serves as a CNBC Fast Money contributor and has appeared on Bloomberg, Fox Business, CNN Radio, Wall Street Journal radio and is regularly quoted by Reuters, The Wall Street Journal and Yahoo! Finance, among other publications.

Fed Rejected Bank of America’s Plans For Increased Dividend

The Federal Reserve rejected Bank of America’s (NYSE:BAC) plan for an increase in its dividend in the second half of 2011, according to a regulatory filing. The company submitted a capital plan to the Fed as part of completed bank stress tests. However, Bank of America said that it was given another opportunity to submit a comprehensive plan to the Fed, which may reconsider its decision.

GBP/USD outlook 23 March 2011

GBP/USD – 23 March 2011

Yesterday cable finally broke and had a solid close above the 1.63 level we mentioned in our earlier analysis. With the previous 4 days being strongly bullish a pull back would be expected. The 1.63 level now sits as support for this market and any retrace back to this area could be seen as a potential buying opportunity to rejoining the current uptrend.


A strong price action set up would need to be seen before entering any long trades.


gbpusd230311dailyanalysis


The 4hr chart supports the daily chart and could prove to give a defined entry should a pull back to this area occur. We can see the market has been respecting the trend line we’ve drawn starting from the end of January. We’ve seen a number of ‘bounces’ of this line from above and below. The trend line is crossing the 1.63 level and should any pull back to this area occur our bullish bias would be further confirmed.


gbpusd230311dailyanalysis4hrchart

http://www.vantage-fx.com