NZD/USD Testing Key Resistance Level

By Russell Glaser

The NZD/USD is encroaching on a significant resistance level that if broken should spur further bids.

Earlier today the New Zealand dollar reached as high as 0.7955 and is currently testing the October high of 0.7975. A weekly close above this resistance level will target the Q1 2008 high at 0.8210.

To the downside, the previous resistance levels at 0.7830 and 0.7630 should turn into supports. The rising uptrend off of the 2009 and 2011 lows comes in this week at 0.7200, followed by 0.7117.

NZDUSD_Weekly


Forex Market Analysis provided by ForexYard.

© 2006 by FxYard Ltd

Disclaimer: Trading Foreign Exchange carries a high level of risk and may not be suitable for all investors. There is a possibility that you could sustain a loss of all of your investment and therefore you should not invest money that you cannot afford to lose. You should be aware of all the risks associated with Foreign Exchange trading.

Rising Risk Appetite Causes Volatile Shifts in Forex Market

Source: ForexYard

The euro zone’s fundamental data have lately been showing growing weakness in the region as global industrial production begins to slow on Japan’s nuclear crisis and soaring oil prices. Monetary policy adjustments have many currencies trading more volatile than they have been recently. The British pound has experienced a few price swings and the move into and out of carry trades has made trading the Swiss franc, Japanese yen and even US dollar more unpredictable.

Economic News

USD – Retail Sales Data Boosts USD

The US dollar gained some ground yesterday as positive figures from the retail sales data and poor fundamentals out of Europe helped drive investors into the greenback. The more volatile reading from general retail sales, including automobiles, showed only a 0.4% growth whereas the core data published 0.8% growth. Supporting the retail sales figure was a better than expected reading from this afternoon’s business inventory report which had inventories growing only 0.5%.

The impact from these data was felt almost immediately on USD pairs as the greenback inched higher against a number of its currency rivals from the injection of positive news. Retail sales measures consumer spending and provides investors an early look into the month’s estimates on consumer sentiment. It therefore tends to have a visible impact on dollar pairs; today was no exception.

Coupling the sales data with this morning’s industrial production figures out of Europe, which revealed slower growth than was expected, helped the EUR/USD pull down from Tuesday’s gains. Traders may begin to anticipate a draw-down in the pair as fundamentals tilt more and more towards the greenback. With today’s PPI figures out of the United States, there is a chance that stable inflationary growth will help continue the recent trends in the market.

EUR – EUR Trades Lower as Industrial Production Figure Disappoints

The euro experienced a downturn yesterday as the region’s industrial production figures failed to meet expectations. The EUR/USD bounced off its 1.45 resistance line and currently trades near the 1.4440 level as of this morning. Very little technical information supports the price to move in either direction, but fundamentals appear to be shifting in favor of the greenback.

The euro zone’s fundamental data have lately been showing growing weakness in the region as global industrial production begins to slow on Japan’s nuclear crisis and soaring oil prices. Monetary policy adjustments have many currencies trading more volatile than they have been recently. The British pound has experienced a few price swings and the move into and out of carry trades has made trading the Swiss franc, Japanese yen and even US dollar more unpredictable.

The euro zone is largely absent from the economic calendar today, with most news circling American inflationary and unemployment data as well as Canada’s manufacturing sector. On a different note, the G7 begins its meetings today ahead of the weekend’s G20 and IMF meetings. The topic will be on recent global economic activities, with special emphasis on the Japanese nuclear crisis. Major currencies will likely be experiencing heavy volatility as a result of these meetings.

JPY – Japanese Yen Meeting Resistance as Risk Appetite Returns

This week’s talk of rising risk aversion may have come to a halt yesterday as American retail sales data helped highlight growing consumer optimism, higher oil inventories signaled resistance for over-bought crude oil, and British unemployment fell an unexpected 0.2%. The impact has been for safe havens, like the Japanese yen, to find its feet swept out from underneath it.

The yen has fallen against most of its currency rivals since yesterday. The USD/JPY has risen from 83.47 yesterday afternoon to 83.93 by this morning. Against the British pound, traders have witnessed a leveling-off effect as the pair consolidates around 136.40. With the economic calendar today focused on American economic news, the yen will likely not experience much change unless the US economy continues to release positive data. If that is the case today, traders may want to anticipate a second rise in risk appetite as traders move to higher yielding currencies.

OIL – Unexpected Rise in Inventories Lifts Oil Prices

After dropping almost 3.3% in trading since Tuesday, the price of Crude Oil appears to be receiving some support, though traders appear weary of a rising price of oil. US crude inventories grew last week by 1.6M barrels, beating expectations for a 0.9M barrel rise.

The price of oil has only gained modestly on the day, reaching from $105.20 towards $107.00 over the past 24 hours. Technical traders appeared to be weighing in at a buy mark located near the $105.30 mark, eventually tilting the commodity back into a bullish posture, albeit weakly. With much news expected out of the American economy today, oil prices could undergo significant volatility as traders begin to gauge the impact of price swings in the US dollar.

Technical News

EUR/USD

The pair continues to test the 1.4520 short term resistance level. Daily stochastics are beginning to decline and a pullback may be in store. The support of 1.4245 may provide a good entry level as this coincides with the rising trend line off of the January low and 20-day moving average. A bullish strategy remains in effect with a target at 1.4850.

GBP/USD

A bit of consolidation has occurred following a failed breach of the 1.6425 level. However, rising stochastics on the weekly chart point to an eventual break of this price level. As sometimes happens, the pair retraced back to the trend line from the 2007 high has moved higher. This level could be the weekly low. The next resistance lies at 1.6460, followed by 1.6880 for an initial target. On an extension, the target moves higher to the 2009 high at 1.7040, a level that coincides nicely with the 200-week moving average.

USD/JPY

The pair has sold off following a failed breach of the 85.50 level, a price that coincides with the trend line off of the 2007 high. Last night the pair found resistance at the March high of 83.30. A close below this level on the weekly chart could set the stage for a move lower to 81.00 and a further decline to the bottom channel line which comes in this week at 76.60. To the upside, a breach of 85.50 would set the stage to test the 88 level.

USD/CHF

Following a failure of the pair to close above the 50-day moving average the downtrend has resumed. 14-day Momentum is falling sharply and the pair should eventually test the all-time low from March at 0.8904.

The Wild Card

Silver

After a pullback at the $42 mark on Monday where the daily candlestick made an outside day pattern, a candlestick reversal pattern that engulfs both the high and the low of the previous day’s candlestick, the commodity looks move higher. Yesterday’s candlestick closed on a shaved head indicating that momentum has swung to the upside. Forex traders should look for a retest of the $42 level.

Forex Market Analysis provided by ForexYard.

© 2006 by FxYard Ltd

Disclaimer: Trading Foreign Exchange carries a high level of risk and may not be suitable for all investors. There is a possibility that you could sustain a loss of all of your investment and therefore you should not invest money that you cannot afford to lose. You should be aware of all the risks associated with Foreign Exchange trading.

Daily Market Review for the 14.04.2011

EUR-USD

Time:19.30  Rate:1.4477

Strategy: short

Daily time frame

The price was not able to break out another day the level of 1.4520, and the upper side of the parallel upward channel. Most likely the price will decrease to the level of 1.4330 in the first stage. (a third retracement of CD).

As can be seen by the graph bellow:


4 hour time frame

 The price created an evening star (brown background) under the resistance level 1.4520 and the breakdown of the level 1.4430, will most likely bring it to the level of 1.4330, retracement of the third Fibonacci of the continuous upward movement (broken blue line).

Potential Trade

Short

Enter: 1.4430

Stop: 1.4525

Target: 1.4330

As can be seen by the graph bellow:


GBP-USD

Time: 19.30  Rate: 1.6277

Strategy: short

Daily time frame

The price was supported on the level of 1.6240 (third retracement of the continuous upward movement- broken blue line). The breakdown of the price of this support level will bring it to the level of 1.6110 (two thirds retracement of the continuous upward movement).  

As can be seen by the graph bellow:


4 hour time frame

The price broke the resistance level 1.63, and we believe that in the first stage will get to 1.62, support level. If and when the price will break the price level 1.6200, most likely will get to the level 1.60.

As can be seen by the graph bellow:


Important news for the 14.04.2011

Time: 15.30 USD PPI m/m

Time: 15.30 USD unemployment Claims

Time: 15.30 USD Core PPI m/m

All day: G7 meetings


RISK DISCLAIMER

Forex trading involves high risk. Before any trade, you should consider carefully the investment objectives and the level of risk. The data sent by mail is not necessarily real-time data or precise. Real-Forex is not liable for the losses resulting from the utilization of the data. Real-Forex (Finnocorp Trading Solution Ltd

.) is not liable for losses or damages as a result of reliance on the information provided by e-mail or on the overall data, quotes, charts, signals buy / sell. It is hereby clarified that the investor must be aware of risks involved in trading in financial markets, which is a form of investment that may contain potential risks.

Real-Forex team

Trade like the pro’s with a true ECN Forex broker

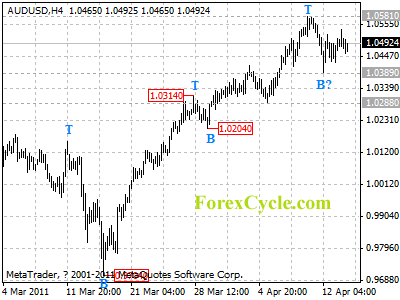
AUDUSD traded in a narrow range between 1.0389 and 1.0581

AUDUSD traded in a narrow range between 1.0389 and 1.0581. The price action in the range is likely consolidation of uptrend from 0.9704. As long as 1.0389 support holds, we’d expect uptrend to resume, and one more rise towards 1.1000 is still possible. However, a breakdown below 1.0389 will indicate that the upward movement from 0.9704 has completed at 1.0581 already, then the following downward move could bring price back to 1.0100-1.0200 area.

audusd

Daily Forex Forecast

Bear Alert on Southeast Asia Cement Holdings (CMT)

southeast asia cement holdings, CMT philippine stocks, head and shoulders, rising wedge, ron acoba, daily stock picks, stock market trading

Putting your money into the shares of Southeast Asia Cement Holdings or CMT in the Philippine Stock Exchange is a bad idea for me as of the moment. Well, at least that’s what its chart is telling me. 

CMT has actually performed so well during the past 6 weeks when it bounced from a low of around PHP 1.20 all the way up near PHP 1.80. But don’t get fooled by this price action as looking further will tell you that this recent run-up could be nothing more than a short term rally. As you can see from its chart above, CMT broke down from a head and shoulders pattern. Shortly after it did, it found its way to a low of PHP 1.20. It then rebounded into what appears to be a rising wedge pattern. Now, a rising wedge is generally a bearish pattern since it also represents a temporary bounce in prices. In any case, a fall below the wedge’s support could send it all the way back to PHP 1.20. Notice also that peak of the wedge coincides with the 50% Fibonacci retracement that I drew. This further indicate the possibility of a break down soon.

So beware and stay on your toes.

More on LaidTrades.com

High Oil Prices, Debt Levels, and Unemployment = Good Times?

If I listen to the market commentators on TV, they seem to tell me that things are going well…

However, when I look at the price of oil hitting $112 a barrel and gasoline prices heading back to $4 a gallon are we back to “good times”…when I look at unemployment level I see that the U.S. is at 8.8% still. Are those good times? I see that Obama is going to talk about raising taxes in a speech tomorrow. Are those good times? I see that if we don’t raise our debt ceiling before May 16th, then we’ll have utter chaos.

Now does all of that equal “good times”? I can’t see it.

When I drive through neighborhoods, I still see too many foreclosure signs in the yards. I still see over 44  million Americans on government assistance programs, etc.

That’s why I believe the Elliott Wave counts are correct. They count the recent rally as a correction upward in a larger bear market.That’s very different from the recent upswing being a new “bull market”. Big difference.

I also think the correction upward in stocks could be nearing its end now or may have even ended already. If the Dow, S&P 500 and Nasdaq can’t push through their former highs, then we’re probably looking at a double top on those charts. If you consider things like the huge MACD divergences on those charts, then it’s even more likely that a top could be forming.

When you look at all of this and then you consider that most of the G-7 nations can’t even grow at 1% right now on a year-over-year basis…you know that we’re on the bring of another recession. In fact, New Zealand, the U.K. and Japan all have negative GDP readings right now.

So if something doesn’t change drastically and quickly, then those tough times could be back.

If they do…this time we’d have tough times with higher debt levels than before. We’d have tough times but with weaker dollars due to all of the “money printing” from the Fed. We’d have tough times but still high inflation….again due to the money printing program of the Federal Reserve.

Okay, but here is the good part…even when there is a gloomy picture, there are still plenty of opportunities to make money trading currency pairs. You can trade successfully through both bull and bear markets in stocks. You can have success through high unemployment or low unemployment…high oil prices or low, etc. That’s the good news…and that’s why I love trading in the forex market. It gives me more control over my future in the midst of many things going on around me which are far out of my control.

Sean Hyman

[email protected]

Editor, Currency Cross Trader

www.globalcurrencyexpo.com

Robinsons Land Corporation (RLC) Poised For A Move North

robinsons land corporation, RLC philippine stocks, double bottom, john gokongwei, ron acoba, daily stock picks, stock market trading

John Gokongwei-led Robinson’s Land Corporation or RLC in the Philippine Stock Exchange had been trading on a downward slope since November 2010. Recently, though, it is showing some signs of a possible reversal. 

Since peaking at above PHP 18.00 last year, RLC’s move south accelerated when it broke down from a head and shoulders pattern. Eventually, it found itself at a low of PHP 11.00. During the last two months, however, RLC has been showing some signs that the market could start to pick it up again. If you can see from the chart above, RLC appears to have been bottoming already as it has been forming a possible double bottom pattern. Also, it has already broken above its downtrend line. A bullish reversal, therefore, would be confirmed if RLC is able to move past the pattern’s neckline at around PHP 13.50. If it does, it’s minimum upside target (gauged by projecting the height of the pattern from the neckline) would be just below PHP 16.00.

More on LaidTrades.com

Rizal Commercial Banking Corporation (RCB) Makes A Move!

The stocks of publicly listed company, Rizal Commercial Banking Corporation or RCB in the Philippine Stock Exchange, went  up by 2.9% to PHP28.75 during today’s trading session. This move was backed up with significant amount of volume that makes me consider this a convincing breakout from the 6-month descending channel pattern. If buying pressure follows through, the stocks could reach my conservative target price of PHP31.00 which I got by adding the height of the channel to the breakout point. A few days ago, RCB has also passed above the 100 and 200-day moving averages which tells us the bulls are still around. The MACD has just gone above the positive territory and the RSI is in a stable condition which even strengthens this stock. On the downside, the immediate support could be the 2-month uptrend. If the stocks further drop below that, the next support could be the 2-year uptrend.


In the bigger picture, what appears to be RCB’s resistance at PHP31.00 is actually the neckline of a possible 4-year cup and handle formation with the handle being the 6-month descending channel. If it is indeed one and the stocks breakout from this humongous pattern, my conservative target price would be the PHP45.50 all-time high. However, before it reaches that marker, it needs to surpass the PHP37.50 resistance.

More on LaidTrades.com