Non-Farm Employment changes will strong USD or …

This is economic data released after the month ends, first Friday of next month. Job creation is an important leading indicator of consumer spending, which accounts for a majority of overall economic activity of the country; 

Last month job gains occurred in professional and business services, health care, and mining. In manufacturing sector, Employment continued growth. The U.S. Bureau of Labor Statistics will release today. Nonfarm payroll employment increased by 216,000 in March-2011, and the unemployment Rate was changed at 8.8%. The number of unemployed persons (13.5 million) and the unemployment rate (8.8%) changed in March. In March month, employment in the service-providing sector continued to expand, by a gain of (78,000) in professional and business services. Most of the gain occurred in temporary help services (29,000) and in professional and technical services (35,000), health care employment (37,000), over the last 12 months, health care has added 283,000 jobs, or an average of 24,000 jobs per month. Employment in leisure and hospitality rose by 37,000 over the month, with more than 2/3 of the increase in food services and drinking places (27,000). 


More …

EUR/USD Technical Analysis – May/06

EUR/USD

EURUSD broke support and going down side toward 50. % (1.4548), 61.8% (1.4455) of 1.4156 to 1.4939. EURUSD broke consolidation on down side, now retracement possible toward 1.4750-1.4773 area as broke wedge formation on 1 hour chart. EURUSD break of 1.4507 supports next will be 1.4455-1.4409 area on intraday. In EURUSD strong resistance is at 1.4845, if break of this resistance further going up side toward 1.5065 next target. EURUSD reversed 78.6% (1.2984) extension 127.2% (1.4750), 161.8% (1.5350) of 1.4288 to 1.2579 still in progress on daily chart.

New High:  1.4719, 1.4913, 1.4734.

New Low:  1.4331, 1.4525, 1.4346.

Pivot Point: R3-1.5037, R2-1.4889, R1-1.4797, PP-1.4649, S1-1.4500, S2-1.4409, S3-1.4260.


LatestEURUSD
Last1.4895
High1.4899
Low1.4805
5 day1.4840
10 day1.4758
20 day1.4596
50 day1.4263
100 day1.3845
200 day1.3604

For more please visit ForexTradingEVO.com

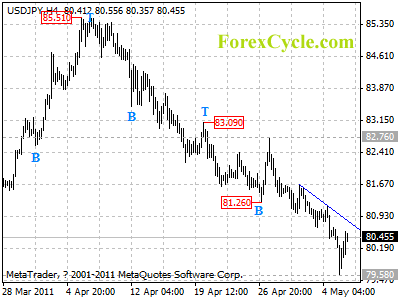
USDJPY remains in downtrend from 82.76

USDJPY remains in downtrend from 82.76, the bounce from 79.58 is treated as consolidation of downtrend. Resistance is at the downtrend line on 4-hour chart, as long as the trend line resistance holds, downtrend could be expected to continue, and next target would be at 79.00 area. On the other side, a clear break above the trend line resistance will indicate that a cycle bottom has been formed at 79.58 on 4-hour chart, and the downtrend from 82.76 has completed, then further rally could be seen to 81.50 zone.

usdjpy

Written by ForexCycle.com

Commodities Move Sharply Lower on Euro Decline

printprofile

The euro is in a free fall versus the dollar following a speech by ECB President that was absent of the typical wording to prepare markets for an interest rate hike. The pause in ECB tightening fed into risk aversion as commodities continued their decline in-line with US dollar gains. Today’s sharp move lower across asset classes signals a change to the risk-off mode.

The EUR/USD shed more than 3 cents today as the pair was in a tailspin, triggered after the ECB press conference that failed to produce live up to traders’ interest rate expectations. The pair fell to a low of 1.4509 from 1.4840, taking out a plethora of stops on the way. The euro was also down sharply in the crosses with the EUR/GBP down at 0.8870 from 0.8996, and the EUR/JPY was lower at 116.53 from 119.63.

Trichet’s speech had the effect of reversing the overbought euro but also the commodities bubble. Crude oil prices collapsed below $100 for the first time since mid-March. Gold and silver also continued their declines that began earlier this week with spot gold falling to $1,472 and spot silver dropping to $35.35 from $39.24. Spot silver is down this week by almost 26%. The S&P 500 is down by 1.00%.

While it may be premature to call this a turn in the market, the sharp move across asset classes signals a change to the risk-off mode. The risk aversion could carry over into tomorrow’s trading with the release of the monthly jobs report. Traders should keep one eye on global equities as a rally in the bourses may bring about a renewed bout of euro buying. However, a weak jobs report may feed into further USD buying and the EUR/USD decline could continue. A drop to the 1.4280 support level would still keep the pair’s bullish trend intact, perhaps inducing buyers at better levels to enter.

Awaiting Tomorrow’s Non-Farm Payroll Data?

printprofile

A big hubbub has been made regarding the past two weeks. Last week it was interest rate differentials and the sharp decline of the US dollar. This week it is the death of Osama bin Laden, the Royal Wedding in Britain, and Golden Week in Japan (not to mention the celebration of Cinco de Mayo by the Spanish-speaking world is today). But have you forgotten the most impactful data release of each new month?

This week is the long-awaited Non-Farm Employment Change (Non-Farm Payrolls, or NFP) release from the US Department of Labor’s Bureau of Labor Statistics. This data release is perhaps the most important figure published by the US economy. More so than interest rate decisions. More so than inflationary figures. More so than industrial readings.

Non-Farm Payrolls is the primary gauge of the US employment sector. It carries the heaviest impact on the forex market since it is a direct line into the lifeblood of the American economy: jobs.

Yesterday’s NFP estimate by Automatic Data Processing Inc. (ADP) revealed a below-forecasted figure of only 179K jobs being added by the private sector. Tomorrow’s NFP report will factor in the same information but include jobs data from the public sector as well. It is a leading indicator of economic health and should never be disregarded, especially in these times of economic uncertainty.

Today’s rate statements out of Britain and the euro zone left many investors unsure about the timing of future rate decisions. The result has been a broad sell-off in the euro and British pound in exchange for safer assets like the US dollar and Japanese yen. Should tomorrow’s NFP data come below forecasts, this shift into safe haven investments may pick up steam, further boosting the USD and JPY. Don’t miss out on tomorrow’s NFP data release, it should be a doozy.

Weekly Initial Jobless Claims rise more than expected

By CountingPips.com

U.S. jobless claims increased by much more than expected in the week that ended on April 30th and reached the highest level in eight months, according to a release by the U.S. Labor Department today. Weekly initial jobless claims rose by 43,000 workers to a total of 474,000 unemployed workers following the prior week’s 431,000 revised number of claims. The 474,000 jobless claims marked the highest level since August 2010.

The 4-week moving average of unemployed workers increased by 20,250 workers from the previous week to a total of 431,250.

Market forecasts were expecting jobless claims to decline to 440,000 workers.

Meanwhile, workers seeking continuing claims for unemployment benefits for the week ending April 23rd also increased for the week. Continuing claims decreased by 74,000 workers to a total of 3,733,000 unemployed workers.

The 4-week moving average of continuing claims fell by 1,250 workers to a total of 3,700,750.

Anticipate a Weaker-Than-Expected Jobs Report

job marketRecently the financial stock market has been slow to react to anything. Events and data that would normally get a big reaction from the markets have had minimal effect. Even the killing of the most wanted man on Earth did little to influence U.S. stocks.

That calm trend may be about to change…

What News Matters for the Financial Stock Market?

All news, economic data and corporate announcements such as earnings reports have some influence on the financial stock market. A successful investor forms opinions about the economy and the companies he or she invests in based on all kinds of news. But an investor also needs to be aware of what news the financial stock market uses.

Think of the market as a telescope looking ahead about four to 12 months. Because of this “forward view,” we use the market as a leading indicator of strength of the economy.

Even though the stock market looks forward, there are checkpoints to make sure it is not getting ahead of itself or that it has gone far enough! The checkpoints are news reports and economic data. If these are not meeting expectations, the markets can correct.

Different news matters at different times. But one major checkpoint may need to really step up the pace, if the financial stock market is going to continue higher.

(Investing doesn’t have to be complicated. Sign up for Smart Investing Daily and let me and my fellow editor Sara Nunnally simplify the stock market for you with our easy-to-understand investment articles.)

The Employment Situation

The unemployment rate, though important, is considered a lagging indicator of economic health. This means that the economy could be improving and the unemployment rate might be slow to respond.

Remember earlier I mentioned that the financial stock market is like a telescope? Well, you can also think of it as a rubber band. When the market moves higher and economic conditions improve, the tension on the band decreases. But when the market has been moving higher and the economy doesn’t improve fast enough, the tension increases. Too much tension and a snap-back will happen. That is not good for investors.

The jobs report, which contains the unemployment rate, is released on the first Friday of every month. It is closely watched…

The rate at which we add jobs in this country is being scrutinized more and more and is becoming a major source of tension in the markets. Traders are starting to be concerned.

The unemployment rate is at 8.8%, according to the Bureau of Labor Statistics.

Expectations are for the unemployment rate to stay at 8.8% for April, but analysts are also looking for 185,000 jobs to be added. (I know these unemployment numbers can be misleading and confusing. If you are wondering how jobs can be created and the unemployment rate can stay the same, read this Smart Investing Daily.)

The bottom line is, I don’t think the economy created 185,000 jobs last month. I think the number will be much lower, perhaps below 150,000. Here’s why:

1. Unemployment claims have been on the rise.

If you look at the chart below, you can see that new unemployment applications have actually been on the rise. The numbers have been coming in higher than expected and the revisions have been worse on average. This paints a grim picture for the jobs number Friday.

Unemployment claims since Feb. 10
Unemployment Chart
View larger chart

2. ADP report was worse than expected.

ADP is the nation’s largest payroll company. It offers its employment data on the first Wednesday of every month to help investors get an idea of the market climate. Anyone who is familiar with the unemployment situation knows that the ADP report isn’t the best gauge of the actual jobs number; one could say that it tends to be more “optimistic” than the actual data from the BLS.

If that optimism were based on facts, we should have had a decent report last month. Unfortunately, the ADP jobs report came in far less than expected (see the second chart below). This is not what you should see if the economy is growing.

Monthly jobs added – BLS
Jobs Chart
View larger chart

Monthly jobs added – ADP
Unemployment Chart
View larger chart

What Will Happen?

Well, expect a bad number. Based on the research I have done, the economy will add far fewer jobs than expected. The market will likely sell off on the news.

But you should then keep an eye on how the government reacts. With market movement, it is not just about this report. A jobs market that remains weak will provide an excuse for our friends at the Fed and in Washington to keep printing money. People without jobs can’t really spend extra money. So according to Bernanke, because people can’t buy things, consumer prices (inflation) won’t rise.

And since Bernanke still thinks inflation will be short-lived and doesn’t seem to care about the spending power of the average American, the weak dollar policy will continue. As illogical as it is, markets will continue to rally.

As much as jobs matter to most of us, the stock market likes some unemployment. The market will most likely get its wish tomorrow — a reason to climb.

Editor’s Note: Agricultural commodities are about to explode in price, sending food prices soaring. That’s bad for restaurants and consumers… but it’s great for farmers and commodity investors.

Get the details from Taipan’s Velocity Trader.

Article brought to you by Taipan Publishing Group. Additional valuable content can be syndicated via our News RSS feed. Republish without charge. Required: Author attribution, links back to original content or www.taipanpublishinggroup.com.

{jtagstpg} {authorstpg}

Other Related Sources:

  • Why the Stock Markets Closed Lower Yesterday
  • The McJobs Era — Would You Like Rage With That?
  • U.S. Stocks Sink over Disappointing Economic Data
  • My Technical Market Analysis: Parabolic moves in Silver and Gold increase unpredictability

    By Chris Vermeulen,thegoldandoilguy.com

    The past few weeks we have been seeing the US Dollar slide to new lows at an increasing rate. The strong devaluation of the dollar has sent precious metals like silver and gold rocketing higher out of control sending them parabolic!

    During the past 6 weeks both silver and gold have been rising in a parabolic formation. Meaning the price is going straight up with strong volume as everyone gets greedy and buys into the commodities at the same time. Most of you who follow my work already know that if the general public is piling into an investment rocketing prices higher, you better start focusing on tightening your protective stops and or taking some profits off the table before the price collapses.

    Take a look at the weekly chart of Silver below:
    Silver was grinding its way higher from July into March of this year. Only in the past 6-7 weeks did we start to see silver open up and run with expanding candles growing at an accelerated rate. This virtually straight up rally is a signature pattern and tells me that price action is now VERY unpredictable and anyone getting involved should be tightening their stops and or taking partial profits on price surges.

    Parabolic moves can provide some big gains but most traders end of giving it all back and then some because the price can drop very abruptly as seen on this chart.

    The weekly chart of gold below shows much of the same thing but without the extreme volatility that silver has.

    Now, if you take a look at the US Dollar chart it’s starting to look very bullish in my opinion. The chart shows a falling wedge which typically means the selling pressure should be coming to an end soon. I’m not sure how large the bounce/rally will be. I do think a quick move to the 75 level is very likely in the near future though.

    I find that metals tend to turn just before the dollar does. So I’m very cautious here on buying any stocks or commodities at the moment. The past 2 years we have seen stocks and commodities have an inverse relationship with the dollar so a rising dollar means a market pullback will take place. Sell in May and Go Away…?

    Mid-Week Trading Conclusion:
    In short, we exited our SP500 position this week for a nice 6% gain in a couple weeks making that our third profitable back to back index play. At this time I’m not ready to buy or short the market until all the charts line up for another low risk entry point. Things are 50/50 odds here and that’s not good enough for me.

    That’s it for now, but remember you can get my free trading reports each week at: http://www.thegoldandoilguy.com/trade-money-emotions.php

    Chris Vermeulen