FOREX: Currency Specs add to Dollar shorts. Euro contracts at highest level since 2007 last week

By CountingPips.com

The latest Commitments of Traders (COT) report, released on Friday by the Commodity Futures Trading Commission (CFTC), showed that large futures speculators increased their short positions of the US dollar against the other major currencies last week. Non-commercial futures positions, those taken by hedge funds and large speculators, were overall net short the US dollar by $35.01 billion against other major currencies as of May 3rd. The data is a rise from the total short position of $27.75 billion on April 26th, according to the CFTC data and calculations by Reuters which calculates the dollar positions against the euro, British pound, Japanese yen, Australian dollar, Canadian dollar and the Swiss franc.

This week’s notable changes were euro positions increasing to the highest level since July 2007 while Japanese yen positions continued to improve and were short by 18,819  contracts.

EuroFx: Currency speculators increased their net long positions for the euro against the U.S. dollar for a second straight week to their highest level since July 2007. Futures positions in the euro rose to a net total of 99,516 long positions as of May 3rd following a total of 68,279 long positions on April 26th.


The COT report is published every Friday by the Commodity Futures Trading Commission (CFTC) and shows futures positions as of the previous Tuesday. It can be a useful tool for traders to gauge investor sentiment and to look for potential changes in the direction of a currency or commodity. Each currency contract is a quote for that currency directly against the U.S. dollar, where as a net short amount of contracts means that more speculators are betting that currency to fall against the dollar and net long position expect that currency to rise versus the dollar. The graphs overlay the forex spot closing price of each Tuesday when COT trader positions are reported for each corresponding spot currency pair.

GBP: British pound sterling positions edged lower as of May 3rd to a total of 30,807 net long positions after rising the week before to a total of 33,583 long contracts on April 26th.


JPY: The Japanese yen net contracts improved to a total of 18,819 net short contracts reported on May 3rd. This is from 36,997 short contracts on April 26th.


CHF: Swiss franc long positions moved higher for a fourth straight week to a total of 18,381 net long contracts following a net of 17,841 long contracts on April 26th.


CAD: The Canadian dollar positions moved lower for a second consecutive week to a total of 54,041 contracts as of May 3rd after CAD net contracts had fallen to a total of 59,063 net long contracts on April 26th.


AUD: The Australian dollar long positions declined for the fourth straight week to a total net amount of 73,421 long contracts as of May 3rd. AUD positions had totaled 80,867 net long contracts on April 26th.


NZD: New Zealand dollar futures positions increased higher for a seventh consecutive week. NZD contracts increased to a total of 12,800 long positions as of May 3rd from a total of 11,457 long contracts on April 26th.


MXN: Mexican peso long contracts dipped for a second week after reaching the highest level in at least a year. MXN contracts fell to 124,260 net long contracts as of May 3rd from a total of 131,806 long contracts as of April 26th.


COT Data Summary as of May 3, 2011
Large Speculators Net Positions vs. the US Dollar

EUR: +99516
GBP: +30807
JPY: -18819
CHF: +18381
CAD: +54041
AUD: +73421
NZD: +12800
MXN: +124260

Further COT Resources from around the web:

Greece’s Rumored Exit from the Euro Zone Dragging EUR Lower

Source: ForexYard

The German newspaper der Spiegel noted a rumor that was floating around last Friday which said Greece had considered exiting the 17-nation euro zone during one of its recent policy meetings. Though profusely denied by German and Greek officials, the powerful force of the rumor in speculative circles has drastically pulled down on the strength of the EUR.

Economic News

USD – Traders Bullish on USD as Euro News Hastens Flight to Safety

The US dollar experienced strongly bullish results since last Friday as traders began to shift away from the euro following the European Central Bank’s (ECB) announcement to hold rates steady and rumors that Greece may quit the euro zone. The result has been for the value of the euro to drop like a stone versus its currency counterparts, and the US dollar looks poised to capture much of the beneficial side-effects.

With Friday’s Non-Farm Payroll (NFP) figure revealing surprise growth in the US employment sector, traders appear less reluctant to go into the greenback in order to stave off further losses in their portfolios. The US economy has so far benefited from this shift as a stronger dollar should give Americans more buying power in the days ahead. The issue of interest rate differentials has generated market tension over the past two weeks and, indeed, the shift in value among the safe-havens and the EUR has made currency forecasting a much more difficult profession.

As for today, traders will focus more attention on Europe and Canada given the US economy is not scheduled to publish any news or data releases. Japan’s monetary policy meeting minutes were published this morning and are in the process of being digested by investors. The Canadian economy will also be releasing its latest findings on housing starts. With increased risk aversion since last Friday, traders appear to be anticipating a continuation of the USD’s recent bullishness.

EUR – Rumors of Greece Exiting Euro Zone Gouges EUR Values

The euro appears to have lost substantially against its primary currency rivals since Friday following the European Central Bank’s (ECB) rate statement on Thursday and rumors that Greece may consider exiting the euro zone. The data releases published over the last several days have pushed many traders away from riskier assets as well. So far the shift in risk sentiment has favored the US dollar over its European rival.

The German newspaper der Spiegel noted a rumor that was floating around which said Greece had considered exiting the 17-nation euro zone during one of its recent policy meetings. Though thoroughly denied by German and Greek officials, the powerful force of the rumor in speculative circles has drastically pulled down on the strength of the EUR. Many analysts have also noted that ECB President Jean-Claude Trichet’s remarks during last Thursday’s rate policy statement made predicting the next rate adjustment far more difficult than they have been in the past. The value of the EUR/USD, as a result, has shifted from its recent high near 1.49 to a current price around 1.44.

As for today, the euro is largely absent from the calendar, but with a few reports which should not have much impact overall. Germany will publish its trade balance, which has largely already been priced in to the value of the region’s currency. The euro zone will also release its Sentix Investor Confidence report which tends to have little impact on the 17-nation bloc’s currency; as such, present trends established last Friday appear to be dominant in Monday’s market environment.

JPY – Japanese Yen Mixed as Investors Digest Policy Minutes

The JPY has been trading with largely positive results since Friday as investors turn their focus towards news out of Europe. After a week of ups and downs, the Japanese yen appears set to make gains today as investors largely flee riskier assets. The low interest rates of the Japanese economy have helped pull many investors into the safety of the yen following Thursday’s rate announcement by the ECB. Rumors of Greece’s exit from the euro zone have also sent traders on a hunt for safer assets.

With Japan’s economy coming back online from a week of holiday celebrations, the market should receive a modicum of additional liquidity from the return of this island giant. The impact may be felt in today’s early hours, but the news emerging out of Europe about last week’s rumors will likely lead today’s market environment. Traders should tune in to any comments made by European officials as these are likely to drive today’s more important portfolio shifts and adjustments.

Oil – Crude Oil Prices Still Falling, Can this Decline Continue?

The price of Crude Oil ended Friday significantly lower as traders largely began to pull out from their investments in physical assets while the US dollar made a rapid jump. The result has been a sharp drop in oil prices reaching as low as $96 by end of trading Friday. Will the fall continue through this week?

Recent events have made speculating about oil prices more difficult. The plummeting value of the US dollar through the early days of last week should have helped lift oil prices, but the commodity remained in free fall for the fourth consecutive day as of this morning. Rising stockpiles in the United States, reported Wednesday, may have helped fuel the shift away from oil as rising inventory tends to suppress price hikes. As for the rest of today, oil prices appear heavily leaning towards the downside, with technical support targets near $88 a barrel coming into view.

Technical News

EUR/USD

This morning the EUR/USD gapped higher by 60 pips after last week’s 6 cent decline which closed below the January trend line. Weekly stochastics are now falling after remaining oversold for some time. Daily stochastics are also showing signs of divergence and traders should keep an eye on this potentially bearish signal. If the EUR/USD fills the gap, the pair could target the support at 1.4150, a level that coincides with the 38.2% Fibonacci retracement from the January to April move. The 100-day moving average also could come into play at 1.4020. To the upside, the previous trend line should turn into resistance and comes in today at 1.4450. Friday’s high of 1.4585 is 2nd resistance level.

GBP/USD

Last week’s low for Cable at 1.6340 coincides with a 50% retracement from the March low to the April high. Should this support level hold, 1.6600 would be eyed followed by the April high of 1.6745. To the downside the mid-April low at 1.6160 stands out as a support, as does the rising trend line off of the May 2010 low which comes in this week near 1.6000.

USD/JPY

Weekly stochastics are rolling lower, indicating the momentum is to the downside on the pair. First support is last week’s low at 79.50 with an initial target for the pair at the lower channel line from the December 2008 low which lines up this week at 78.40. A breach here would target the pre-intervention low at 76.40. Resistance comes in at 81.20 from the trend line off of the April high.

USD/CHF

After making a new all-time low last week at 0.8553 the pair found resistance at the 20-day moving average at 0.8800. A continuation of the move higher would run into the trend line off of the April high which comes in at 0.8850. A breach there would target 0.8900 off of the mid-April low.

The Wild Card

Oil

A sharp decline in commodity prices last week and crude oil shed 17% in a week. Last week’s low coincides with a 61.8% retracement from the February low. Should the price continue to fall forex traders could target the rising trend line from the August lows at $90.10. A move higher would first target the mid-April low at $105.25 followed by last week’s high at $114.81.

Forex Market Analysis provided by ForexYard.

© 2006 by FxYard Ltd

Disclaimer: Trading Foreign Exchange carries a high level of risk and may not be suitable for all investors. There is a possibility that you could sustain a loss of all of your investment and therefore you should not invest money that you cannot afford to lose. You should be aware of all the risks associated with Foreign Exchange trading.

Debt Crisis Greece Warming

News continues to penetrate the emergency meeting of euro zone finance officials to discuss several aspects of the debt crisis of Greece and EUR are under pressure. Doubtful reports that Greece intends to leave the euro, so that the reflection meeting turned into consideration whether the terms bailout request Greece to change or to prepare for debt restructuring. If the bailout eventually adjust requirements, anticipated effects on the euro will not last long. If in the end default / restructuring of debt, is also suspected decline would be limited. 

More …

USDJPY broke above the downtrend line

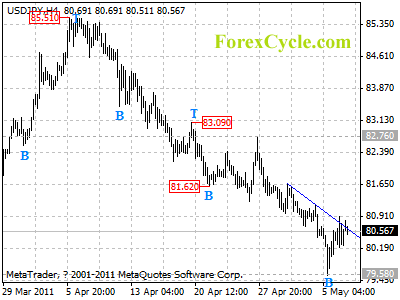
USDJPY broke above the downtrend line on 4-hour chart, suggesting that the short term downtrend from 82.76 has completed at 79.58 already. Now the bounce from 79.58 is treated as consolidation of longer term downtrend from 85.51. Range trading between 79.58 and 81.50 would likely be seen in a couple of days. As long as 81.50 resistance holds, downtrend could be expected to resume after consolidation, and another fall towards 78.50 area is still possible.

usdjpy

Daily Forex Analysis

Dollar Trend Reversal Ahead?

Bullish Dollar Price Action Suggests Correction Underway


The outlook has been pretty bad for the dollar recently.  The forex markets, however,  have a habit of turning just when everybody decides on a certain direction.


The US Dollar has been under the hammer for a while now but this week gave the dollar bulls something to cheer about.  Commodities were extremely volatile and were sold of with massive volume which suggests the smart money was dumping inventory.


If commodities are sold then the dollar benefits and it certainly has this week.  Aside from the commodities element there was the ECB and Trichet giving the markets a reason to be less focused on buying the euro; this has obviously benefited its main trading partner – the greenback.  


The main reason for my attention being drawn to further dollar upside potential is the weekly bullish engulfing candle on the dollar index (see below).  This combined with an equally pro-dollar candle on the EUR/USD gives me reason to believe there is a reasonable probability of more dollar upside over the coming sessions – if some initial follow through can break last weeks ranges.


Further Dollar Gold Silver analysis available at www.forex-fx-4x.com


USDJPY stays below a downtrend line

USDJPY stays below a downtrend line and remains in downtrend from 85.51. As long as the trend line resistance holds, downtrend could be expected to continue, and next target would be at 78.00-79.00 area. However, a clear break above the trend line resistance will indicate that a cycle bottom is being formed at 79.58 on daily chart, then the following upward move could bring price to 82.50-83.00 area.

For long term analysis, USDJPY is in consolidation of long term downtrend from 124.16 (2007 high). Range trading between 76.40 and 90.00 is expected in next several months.

usdjpy

Weekly Forex Forecast

Internet Earnings: Demand Media, Priceline.com

Online media company Demand Media (DMD) posted first quarter earnings after the close of trading yesterday for its first quarter as a public company. The company lost $5.6 million, or $0.13 per share, compared to a loss of $4.1 million, or $0.94 per share, in last years first quarter.

Is It Time to Buy Silver?

Precious MetalsUnless you have been hiding under a rock, you probably know that silver has had a major correction over the past week. The precious metal plummeted about 30% from a high of almost $50 an ounce to less than $35 yesterday. This six-day drop is one of the largest since 1983.

Silver has given back just about all of its gains for the past month and some traders are thinking it might be time to get long. But before you run and buy silver, there are a couple things to consider.

Forces That Move Silver

The U.S. Dollar

There are many theories on why this sell-off is happening. Obviously, any real strength or even support in the U.S. dollar will generally be bearish for precious metals like gold and silver. This is mostly because the U.S. holds the largest stockpiles of these metals and they are traded in U.S. dollars globally. Even though gold is more of a recognized currency, they both have sensitivity to changes in the U.S. dollar’s value.

The falling U.S. dollar has recently leveled out. That means we’ve seen a small correction in dollar-denominated commodities and metals overall. Earlier this week, the European and London central banks held their rates steady. The ECB also hinted that they may not raise their rates next month either. This is good news for the U.S. dollar.

The U.S. dollar traded higher late in the day yesterday and sent other dollar-sensitive commodities like oil and even stocks much lower on the day. Oil had its largest percentage drop in three years. If you don’t believe that the dollar is in control here, think again…

For now, it seems that the U.S. dollar will continue to be relatively weak. The rally seems more like a short-term bump rather than a long-term trend. Current Federal Reserve policy puts general downward pressure on the U.S. dollar.

Gold/Silver Ratio

Then there is the historical ratio between gold and silver. A good “average” ratio of gold to silver is about 55, according to many experts. That means 1 oz. of gold should buy 55 oz. of silver. The gold premium is because there is much more silver on this Earth than gold. Even though silver has industrial uses beyond gold, there is a global desire, respect and currency reserve with gold that silver just does not have.

If that ratio gets extremely high, like 100, that means that silver is cheap relative to gold and may be a good value. If the number is low, silver may be getting overly expensive.

On April 28, the gold-silver ratio was about 30, relatively low. Now the ratio is back up around 43, still low, but not extreme. I’d like to see that ratio above 48 if I were thinking of buying.

Using current gold prices of $1,494, that means a drop in silver prices to $31.12 an ounce. Remember, though, that ratios are a two-way street. That means gold prices can climb, too, putting the ratio closer to its “good average.”

(Sign up for Smart Investing Daily and let me and fellow editor Sara Nunnally simplify the market for you with our easy-to-understand articles.)

Technicals

Technical formations also play an important role in finding buy and sell points. Looking at iShares Silver Trust (SLV:NYSE), you can see the sharp sell-off on the right side of the chart. In my opinion, it seems that we are nearing a short-term bottom. The lower Bollinger band (gray area) was just broken yesterday, as prices dipped below the lowest level of the band. This is generally an indicator of an oversold condition just before a bounce.

I also would look to the 50% Fibonacci retracement line (dotted) of about $33 for support. (For more info on Fibonacci retracement lines, read this Smart Investing Daily article.) The danger here is the fact that we have broken below the 50-day moving average, which is not good for the bulls. To solidify a strong trend, I would like to see the price of SLV get above that 50-day moving average, at about $38.

You can’t simply view the charts in a vacuum. There are other things “manipulating” the market.

iShares Silver Trust
View Larger Chart

Margin Requirements

The manipulation here is the recent 500% jump in margin requirements for silver futures. When you buy a futures contract on silver (one futures contract is for 5,000 ounces of silver), you are required to put up a deposit called “margin.” That initial cost has risen tremendously as of late. They have also raised the amount of margin you have to pay once you are already in the trade and it starts to go against you.

If traders cannot meet the new margin requirements, they are forced to sell their contracts. This new rule will deter new buyers.

It’s like someone raising your rent from $1,000 to $5,000 in a month. Higher margin requirements can also make a sell-off worse, as contracts are sold to cover losing positions. These requirements affect everyone from individual traders to hedge funds. This is one of the main reasons why silver is making 10% moves daily.

Now in all fairness, the dollar cost of margin will rise as the price of silver rises, but the CME (COMEX) has increased the margin requirements abnormally in the past week and will raise them again Monday.

May traders are selling ahead of this hike.

ETFs

ETFs like the SLV hold actual silver and futures contracts. At present there are about 600 million ounces of silver held by ETFs. When traders begin to sell shares of an ETF like SLV, the ETF may sell silver futures to keep everything in balance. About 6 million ounces of silver have exited ETFs in the past week.

ETFs can also add to the domino effect, both long and short. But remember that stocks usually take the escalator up and the elevator down!

Once the hype settles down and the CME completes its margin increase on Monday, we should see silver prices stabilize. From my perspective, I see $33 as a level I may cautiously begin to buy. If silver breaks below that level, I think support will be around $29 until the Fed decides it’s time to cool inflation.

I am sure that Ben B. was feeling quite happy with the corrections in gold, oil and silver this week. Perhaps Americans will feel some reprieve as well…

Editor’s Note: Silver ETFs may be taking a big hit with these margin increases, but they’re not the only way to play silver right now. Michael Robinson, editor of 180 Trader, has been riding the silver bull, and this most recent drop might give his subscribers another great opportunity. For more information on silver and the companies Michael’s been recommending, check out 180 Trader.

Article brought to you by Taipan Publishing Group. Additional valuable content can be syndicated via our News RSS feed. Republish without charge. Required: Author attribution, links back to original content or www.taipanpublishinggroup.com.

{jtagstpg} {authorstpg}

Other Related Sources:

  • Is Silver a Better Precious Metal Investment Than Gold?
  • Two Ways to Protect Your Retirement Portfolio In a Down Market
  • Silver, Gold & Oil ETFs Advance As Libya, Inflation Back In Focus
  • FOREX Update: Nonfarm Jobs Report rises more than expected, unemployment rate edges higher to 9.0%.

    By CountingPips.com

    Today’s US government nonfarm payrolls employment data came in better than expected with a gain of 244,000 jobs for April while the unemployment rate edged just higher to 9.0 percent. The April data marked the third straight month hiring has topped 200,000 and follows revised gains of 221,000 jobs in March and 235,000 jobs in February.

    Market forecasters and economists were expecting the nonfarm payroll report to show a gain of approximately 185,000 jobs and the unemployment rate to remain at 8.8 percent for the month.

    The unemployment rate, at 9.0 percent, rose from 8.8 percent in March as more people joined the search for new jobs.

    Private companies created 268,000 jobs in April as the service sector added 224,000 jobs and the goods producing sector increased by 44,000 jobs. Government hiring decreased by 24,000 workers for the month.

    Within the service sector, retail hiring led the way in job creation with an increase of 57,000 workers while professional and business services hiring added 51,000 jobs in April. Education & health services jobs increased by 49,000 workers and leisure & hospitality saw 46,000 workers added to the payrolls for the month.

    In the goods producing sector, manufacturing jobs rose by 29,000 workers while mining jobs rose by 11,000. Construction hiring was higher by 5,000 jobs in April.

    Forex: US dollar mixed as Stocks rise

    The US dollar has had mixed results against the other major currencies in the forex markets today following the monthly government jobs report. The dollar has gained ground on the day versus the euro, Japanese yen and the Swiss franc while losing ground against the New Zealand dollar, Australian dollar, Canadian dollar and the British pound sterling.

    The US stock markets, meanwhile, have been on the rise in morning trading today with the Dow Jones industrial average increasing by over 140 points while the NASDAQ has been higher by over 25 points and the S&P 500 has increased by over 12 points at time of writing.

    In commodities, oil has edged lower slightly by $0.25 to the $99.55 level while gold futures have been higher by $13.90 at the $1,494.80 level so far today.