Economic Data Posits Risk Taking This Week

By ForexYard

Confidence and trade reports from the US and Canada last week portrayed a global economy somewhat stronger than what many had expected. The balance of imports to exports last Friday revealed a growing market, with smaller deficits, as businesses across the United States and Canada begin seasonal hiring for the holidays.

Economic News

USD – US Dollar Dips as Trade Data Supports Growth

The US dollar (USD) was seen trading mildly bearish Monday morning as traders saw a small decline in risk aversion following last week’s economic reports. The EUR/USD rose following the completion of a long-term consolidation trend, reaching a 4-day high. The GBP/USD saw somewhat higher gains, with the greenback inching the pair towards last week’s early high.

Confidence and trade reports from the US and Canada last week portrayed a global economy somewhat stronger than what many had expected. The balance of imports to exports last Friday revealed a growing market, with smaller deficits, as businesses across the United States and Canada begin seasonal hiring for the holidays. Such reports are likely to drive the US dollar lower as risk aversion declines and traders begin seeking out higher yields.

With a very light news day ahead, traders appear anxious for the week’s data which seems to be centered mostly on manufacturing reports. Today’s publications are somewhat limited to the US, however, with some figures on manufacturing due this afternoon. Liquidity will likely be held to a minimum making the market unlikely to experience any major swings, though.

EUR – EUR Trading Higher as Traders Seek Risk

The euro (EUR) was seen trading with largely bullish results this morning following last week’s mildly optimistic assessments from North American trade and confidence reports. Against the US dollar (USD) the euro was trading near a 4-day high, with few signs of halting the bullishness which appears to come on the coattails of a long-term consolidation pattern. Against the Great British pound (GBP), the EUR witnessed a similar, albeit weaker, gain in strength.

Traders appear to be clinging stronger to the 17-nation common currency with higher yielding investments in mind. With employment rising and trade increasing in the North American continent, it seems likely that more traders will opt for higher yields heading into the 2011 holiday season. Should data continue to move in such a direction, it is far more likely that the EUR will see further gains.

Economic sentiment across the euro zone remains negative overall, however, with many analysts and economists expecting moves towards safety by traders as early as next week. With a light news day ahead, many traders are awaiting more data releases later in the week before buying up further EUR. With today’s low liquidity, not much movement is expected, though random central bank statements could roil markets at any time.

JPY – Japanese Yen Expecting Little Movement

The Japanese yen (JPY) was seen trading higher versus most currencies this morning as its value as an international safe haven begins to get challenged by the prevailing economic conditions. Being linked to international risk sentiment, the yen has experienced an expected uptick during a period when shifts away higher yielding assets became prominent.

The latest moves of the JPY are causing some concerns, however, as many speculators were anticipating a downturn following the Bank of Japan’s (BOJ) latest rate statement. A strengthening yen has benefits for the buying power of the island economy, though its dependence on exports makes a strong yen unfavorable for longer-term growth in Japan’s current financial model. The persistence of the yen’s rising strength is causing some furrowed brows in Japan’s economic circles, and this may be a cause of its mixed trading behavior.

Silver – Silver Price Continuing in Bullish Channel

The price of Silver found modest support over the weekend amid the surging strength of the US dollar, the currency in which such assets are valued. Silver has been trading with stronger price action since early August, but traders have been awaiting a price correction from the rampant increase in risk aversion due to rising tensions from the euro zone’s periphery and a sudden lift off in dollar values.

As investors seek safety, the value of Silver, which has been seen trading with mixed results since two weeks ago, is expected to rise following its current bullish channel, bouncing off a recent low near $39.60 an ounce after a selloff in commodity futures pulled down on precious metals last week. A sudden rise in dollar values due to this week’s uncertain environment is expected to assist the sentiment favoring Silver, however. Should risk sentiment continue to bounce in sporadic directions this week, the price for this precious metal may continue to experience similar swings in value, favoring an upside as Silver holds within its bullish pattern.

Technical News

EUR/USD

The price of this pair appears to be floating in the over-bought territory on the daily chart’s RSI indicating a downward correction may be imminent. The downward direction on the 8-hour chart Slow Stochastic also supports this notion. When the downwards breach occurs, going short with tight stops appears to be preferable strategy.

GBP/USD

The cross has experienced much bullishness in the last few days, and currently stands at the 1.5810 level. There is much evidence in the chart’s oscillators that supports a possible bearish correction today. This is supported by the 8-hour chart’s Slow Stochastic. Going short with tight stops may turn out to bring big profits today.

USD/JPY

The pair has been range-trading for a while now, with no specific direction. The Daily chart’s Slow Stochastic providing us with mixed signals. The 4 hour charts do not provide a clear direction as well. Waiting for a clearer sign on the hourlies chart might be a good strategy today.

USD/CHF

The typical range trading on the hourly chart continues. The 4-hour chart RSI is floating in neutral territory. However, there is a fresh bullish cross forming on the daily chart’s Slow Stochastic indicating a bullish correction might take place in the nearest future. Going long might be a wise choice.

The Wild Card

Crude Oil

Crude Oil prices rose significantly in the last week and peaked at $87.69 per barrel. However, the daily chart’s RSI is floating in an overbought territory suggesting that a recent upwards trend is loosing steam and a bearish correction is impending. This might be a good opportunity for forex traders to enter the trend at a very early stage.

Forex Market Analysis provided by ForexYard.

© 2006 by FxYard Ltd

Disclaimer: Trading Foreign Exchange carries a high level of risk and may not be suitable for all investors. There is a possibility that you could sustain a loss of all of your investment and therefore you should not invest money that you cannot afford to lose. You should be aware of all the risks associated with Foreign Exchange trading.

AUD/USD – Weekly outlook 17 oct – 21 oct

AUD/USD – Weekly outlook 17 Oct – 21 Oct

October has so far been a very bullish month for the Aussie. We’ve had only 2 days that failed to close higher than their open and a break back above parity. The market is now nearing towards significant upper resistance areas. The coming day’s price movements could help determine the direction the Aussie takes for the remainder of the month.

1.0400 is the next area to the upside we will be monitoring. The level has held as support in June & August with it turning into resistance in early September. It is possible we see a bounce of this area in the coming week providing us with an opportunity to short this market, possibly back down to parity. Should we see any price action suggesting a rejection of the 1.04 area we will be looking to sell any bounces.

If we see a break and close above the 1.04 area the next significant resistance we will be monitoring is 1.06 and further upside resistance at 1.08.
 

aussiedaily_17oct11

The weekly chart below shows the market starting to form a downwards channel. Last week saw the price close almost perfectly at the upper resistance of the channel. If we are to see this channel pattern continue we would have to see the market sell off in the coming week back towards the lower line.


aussieweekly_17oct11

http://www.vantage-fx.com

EUR/USD weekly outlook 17 Oct – 21 Oct

EUR/USD – Weekly outlook 17 Oct – 21 Oct

October has seen the bulls taking charge of the market recovering much of the losses seen in the latter part of September when we saw fiber finally breaking out of its 5 month trading range. Although bullish momentum has been strong for the past two weeks, price action on the charts suggests this move could be a ‘pull back’ and we could once again see the bears taking hold in the coming days/weeks.

The daily charts show strong upper resistance that potentially could prove to be a barrier in any move higher for the EUR.

From May – Sept eur/usd was stuck in a 500-600 pip trading range with the market bouncing of upper resistance and lower support showing no clear direction. Mid way though September we finally saw the pair breaking out of the range and pushing lower. We can now see the market pulling back towards the lower end of the range, which could prove to be a strong resistance area.

eurusd17octoutlook

The lower end of the range was at 1.3950 – 1.4000. As you can see from the chart above the market has respected this area in the past. When the market initially broke out of the range we did see a retest of the ranges support which proved to be solid resistance. We are once again nearing to this resistance area and could see another bounce and push back lower.

A closer look on the dailies further confirms that 1.3950-1.4000 may prove to be a strong resistance area as it is between the 50% – 61.8% Fibonacci retracement levels. Drawing our fib levels from the most recent and relevant swing high to swing low shows the 50 & 61.8 levels tie in with our resistance area mentioned.


eurusd17octoutlookfibs

We will be waiting patiently for any price action rejection bars to form at this resistance area and looking to short this market back down to recent lows. However it is possible we see the bulls continuing to show their recent dominance and pushing the market back into its previous range. Should this occur we will be looking for bullish price action signals at 1.3950-1.4000.

http://www.vantage-fx.com

GBP/USD – Weekly outlook 17 oct – 21 oct

GBP/USD – Weekly outlook 17 Oct – 21 Oct

In recent trading days we’ve seen the bull’s starting to take control of cable once again; pushing the pair to its highest price since mid September. Although the recent bullish momentum has been picking up pace, this could been seen as a ‘pull back’ before seeing markets slide lower once again.

Cable is nearing strong upper resistance & 1.60 which proved to be a strong S&R level earlier in the year, not to mention its psychological affect on the market being a whole/round number.

In the chart below we can see the market pushing towards previous support at 1.5900 which could potentially turn in to resistance rejecting any move higher.

1.6100 is also an important area for the cable as it has shown to be a strong support/resistance area in July & August. Last Thursday’s daily candle closed as a bullish inside pin bar suggesting we may see further moves to the upside.

You may also notice that this recent bullish move was formed by a Hikkake pattern.


gbpusd17octoutlook

Similarly to the EUR/USD the cables resistance area is further supported by Fibonacci retracement levels. The 61.8 retracement is almost exactly where we have identified the strong resistance area at 1.6100. The price action S&R combined with the Fib retracements strengthen the likelihood of seeing a ‘bounce’ from the areas/levels mentioned.


gbpusd17octoutlookfibs

We will be looking for price action rejection signals at 1.5900 – 1.6100 with the bias of shorting this market back down to early October lows.

http://www.vantage-fx.com

Weekly Forex Market Outlook (October 17-21)

Fundamental Forex Market Outlook for the Upcoming Week

The key fundamental economic events that can strongly influence the forex market this week feature Australian Monetary Policy Meeting Minutes out from the RBA on Tuesday and the MPC’s Meeting Minutes out on Wednesday. Additional key economic releases due out this week are detailed further below, with the current market consensus expectations or the last result included in parenthesis whenever available.

Monday will be relatively quiet, with the day’s highlight being the BOC Business Outlook Survey. Tuesday will be busier and its key economic events include the RBA Monetary Policy Meeting Minutes, Chinese GDP (9.3%), UK CPI (4.9%), the German ZEW Economic Sentiment (-44.7), U.S.  PPI (0.2%) and. TIC Long-Term Purchases ( 27.8B), plus speeches by Fed Chairman Ben Bernanke and ECB President Trichet.

On Wednesday, the market will closely monitor the BOE’s MPC Meeting Minutes (0-0-9), U.S. Building Permits (0.61M) and U.S. Core CPI (0.2%).

Thursday will see the release of the closely watched U.K. Retail Sales (0.1%), and U.S numbers including Weekly Initial Jobless Claims (405K), Existing Home Sales (4.94M) and the Philly Fed Manufacturing Index (-9.0).

Friday’s schedule closes out the week featuring the German Ifo Business Climate survey (106.3), U.K. Public Sector Net Borrowing (11.9B) and Canadian Core CPI (0.2%.

Technical Forex Market Outlook for the Upcoming Week 

EUR/USD:

Weekly Forecast: Lower

Resistance: 1.3893, 1.3936, 1.3972, 1.4103, 1.4147, 1.4258, 1.4279, 1.4327, 1.4499/1.4503, 1.4548/74, 1.4695 and 1.4939.
Support: 1.3832, 1.3796, 1.3720/43, 1.3684/97,1.3565, 1.3520/24, 1.3450, 1.3360, 1.3333, 1.3241/44, 1.3145, 1.3055, 1.3000, 1.2968, 1.2873, 1.2733, 1.2643 and 1.2586.

200-day MA: 1.4075 and rising.

14-day RSI: 56.7 and rising.

euro usd forex chart

GBP/USD:

Weekly Forecast: Lower

Resistance: 1.5839/67, 1.5883, 1.5912/19, 1.5951, 1.6000, 1.6037, 1.6081, 1.6130, 1.6204/06, 1.6252/59, 1.6332/47, 1.6434/52 and 1.6500/98.

Support: 1.5632/85, 1.5525/31, 1.5483, 1.5422, 1.5373, 1.5339/55, 1.5326, 1.5293, 1.5270, 1.5123, 1.5000, 1.4947, 1.4872, 1.4785/97, 1.4500, 1.4474, 1.4345 and 1.4229.

200-day MA: 1.6134 and rising slightly.

14-day RSI: 54.0 and rising.

gbpusd forex chart

USD/JPY:

Weekly Forecast: Somewhat lower

Resistance: 77.19/47, 77.71, 77.85, 78.02, 78.66, 79.05, 79.40, 80.00, 80.22, 80.82, 81.34, 81.76, 82.01/22, 82.77, 83.09 and 83.77.

Support: 77.04, 76.90, 76.50/69, 76.30/32, 76.25, 76.14, 76.10, 75.94, 75.00 and 70.00.

200-day MA: 80.14 and falling.

14-day RSI: 54.6 and flat.

usdjpy forex chart

USD/CHF:

Weekly Forecast: Somewhat lower

Resistance: 0.9180, 0.9277/0.9339, 0.9368, 0.9774/83, 0.9971, 0.9997, 1.0000 and 1.0065.

Support: 0.8979, 0.8916/26, 0.8883, 0.8873, 0.8797, 0.8788, 0.8728, 0.8646, 0.8622, 0.8536, 0.8239 and 0.8000.

200-day MA: 0.8769 and falling mildly.

14-day RSI: 52.2 and falling.

usdchf forex chart

AUD/USD:

Weekly Forecast: Higher

Resistance: 1.0341/60, 1.0373/96, 1.0473, 1.0481, 1.0511, 1.0564/70, 1.0599, 1.0624, 1.0633, 1.0659, 1.0683/93, 1.0718/26, 1.0763, 1.0784, 1.0909, 1.1000/15, and 1.1064/79.

Support: 1.0229, 1.0100, 1.0012, 0.9863, 0.9732, 0.9689, 0.9667, 0.9651, 0.9620/27, 0.9536/41, 0.9500, 0.9462, 0.9386, 0.9330, 0.9220, 0.9077, 0.9000, 0.8870, 0.8858, 0.8632, 0.8550 and 0.8066/81.

200-day MA: 1.0381 and rising slightly.

14-day RSI: 59.8 and rising.

audusd forex chart

USD/CAD:

Weekly Forecast: Lower

Resistance: 1.0132, 1.0233, 1.0271, 1.0337, 1.0417, 1.0481/90, 1.0500, 1.0506, 1.0646/56, 1.0669, 1.0742, 1.0756, 1.0785, 1.0853, 1.0868, 1.1000, and 1.1101/23.

Support: 0.9939/1.0030, 0.9828/77, 0.9763/96, 0.9734/39, 0.9724, 0.9686, 0.9645, 0.9567, 0.9526, 0.9496, 0.9448/56, 0.9422, 0.9405/09, 0.9056 and 0.9000.

200-day MA: 0.9800 and rising mildly.

14-day RSI: 44.9 and falling.

usdcad forex chart

NZD/USD:

Weekly Forecast: Higher

Resistance: 0.8000/93, 0.8109/19, 0.8126/40, 0.8150/90, 0.8269/78, 0.8327/39, 0.8365/86, 0.8423, 0.8469/72, 0.8500, 0.8534/75, 0.8676, 0.8764, 0.8793 and 0.8841.

Support: 0.7955/94, 0.7888, 0.7855, 0.7795, 0.7741, 0.7605/72, 0.7549, 0.7523, 0.7504, 0.7500, 0.7453/67, 0.7426, 0.7404, 0.7342, 0.7321, 0.7189, 0.7115, 0.7000 and 0.6945/62.

200-day MA: 0.7964 and rising mildly.

14-day RSI: 54.2 and rising.

nzdusd forex chart


Why You Wouldn’t Be a Millionaire if Investing Was Easy

By MoneyMorning.com.au

“If investing was easy we’d all be millionaires.”

Have you heard that one before? It’s a nice throwaway line… everyone knows what it means… and we all nod wisely when we hear it.

Trouble is if you think about it, it’s actually not true.

If investing were easy, everyone would be poor, not rich. We’ll explain what we mean in a moment. First…

Remember to register for the Gold Symposium 2011. It’s taking place in Sydney on 14 and 15 November at Luna Park.

Keynote speakers include fund managers Eric Sprott (more from Sprott later), Egon von Greyerz and Ben Davies… plus Australian Wealth Gameplan editor, Dan Denning. Your editor will chair day two of the event, including a one-hour panel discussion at the end of the day.

You can register by clicking here.

Anyway, back to our point on the ease – or not – of investing…

Why Some Shares are Better than Others

There’s a reason shares have different prices and values. On any given day different investors have different views on where they think a share price should be and what it will do.

That’s a long way of saying no-one knows for certain what will happen next.

So you get different valuations… some shares are priced at a discount compared to other shares. While some are priced at a premium… and others are priced at a fair value.

That’s a long way of saying some companies are liked by investors more than others.

That’s why investing is hard…

It’s impossible to tell the true value of a company just based on its price. Simply because the price is driven by the amount buyers are prepared to pay and the amount sellers are prepared to receive. All you can do is use your experience, analysis and investing skills to make as educated a decision as possible.

But because investors have different views on what makes a company good value, share prices rise and fall.

And here’s the thing. If investing was easy all investors would know exactly what will happen to a share price. In that case a share would always trade at its “correct” value. In short, share prices would hardly ever move.

And so, with little opportunity for anyone to profit, few people would bother taking risks – such as starting a business or investing in a business. Bottom line: without risks there’s no progress (more on that in a moment).

So even though it may seem like easy-investing would be great, it would be terrible. The reason investing is attractive to investors is that it isn’t easy. It’s hard.

And the fact it’s hard is what makes the returns from investing worthwhile…

It Only Takes One Big Idea to Make it

The point we’re making is that because investing is difficult it makes big returns possible. And some of the biggest returns you can get are with small-cap stocks. In fact, we liken investing in small-caps to the decision entrepreneurs make.

An entrepreneur has a choice. They could take the easy route of getting a regular 9-to-5 job… cashing a paycheque each week and – depending on the job – things would be pretty easy for them. Or…

They could pour other people’s capital (investors) into a high-risk business venture that only has a 20% chance of making it to year five (according to the National Business Incubator Association).

And that’s the success rate for ideas that get as far as going into business. Take into account the ideas that don’t make it that far and you’re probably looking at a success rate below 2%.

Yet that doesn’t stop entrepreneurs trying. And it doesn’t stop us looking for small-cap stocks. Like the entrepreneur, we could take the easy route and tip big blue-chip stocks. But we don’t. Because we know we want big returns.

Entrepreneurs and small-cap investors know it only takes one idea to hit the big time and the payoff could be huge.

Everyone wants to invest in the next Apple, Microsoft or Fortescue Metals. But finding them takes patience and analysis… and a lot of bottle to invest in a stock no-one has ever heard of.

But get it right and it’s worth it. Because that’s when you get the reward for taking the risk.

If investing was easy one thing is for certain: you wouldn’t lose much. But we can guarantee, you wouldn’t make much either… and you most certainly wouldn’t be a millionaire.

Cheers.
Kris.

[Publisher’s Note: Looking for entrepreneurial businesses is Kris’s bread and butter. He does it each month in Australian Small-Cap Investigator. To find out which entrepreneurial stocks Kris is backing for big triple-digit percentage gains, click here for a no obligation 30-day trial.]


Why You Wouldn’t Be a Millionaire if Investing Was Easy

Neighbourhood Cat Reveals “What’s Next” for Silver

By MoneyMorning.com.au

The silver price has always been volatile.

It hit an end-of-trade high in Aussie dollars of $44.31 in April. Today it’s trading around 30% below that level.

1 Year Silver Price in AUD

But it was never the price that drew me to silver…

By Sprott Asset Management’s calculations, there are just over one billion ounces of silver above ground. And just over two billion ounces of gold.

We used to have far more silver in storage. But while it was cheap, we discovered hundreds of industrial uses for it in: electronics; solar panels; ID tags; medical uses; wood preservatives.

Today, the world’s whole silver stash is worth just $47 billion. That’s a lot less than the $3,400 billion worth of the gold bullion in the world.

After industry takes its share, investors get just 340 million new ounces of silver each year. Compare that to 125 million new ounces of gold. Until production levels change, newly supplied gold will be 2.7 times rarer than silver. In other words, the gold-to-silver ratio in the medium term should trend towards 2.7:1. So at a gold price of $1350, for example, silver should trend towards $500.

But is that possible?

Well, you have to remember why investors were piling into silver in April – and will continue to. Silver is HARD MONEY. It protects your wealth from inflation and currency devaluation.

The common man in China is getting nervous about the steady rise in inflation. China recently swung from supplying 10% of the silver market to importing 10% of the world’s silver.

Inflation is also up in India. And silver imports to India DOUBLED in 2010 to 97 million ounces, taking another 10% of annual production. The Bombay Bullion Association expects demand to rise.

The US Mint, Royal Mint and Perth Mint have set record sales in 2011. The US Mint even suspended sales of some of its lines. In my own experience, I’ve found that Australian bullion dealers are rationing sales.

Everything is pointing very clearly in one direction.

Up.

Just don’t expect it to follow a straight line!

Commentators in the media will keep saying that each pullback on silver’s way up is the end – we’re hearing it right now.

Don’t forget that most of them know less about silver than your neighbour’s cat. And ask yourself how many of them were calling silver to go up before the rally?

Alex Cowie
Editor, Diggers & Drillers

Related Articles

Why Chinese Monetary Planning Means More Volatility for You

Australia: The World’s Investing Casino

Why China’s Hidden Debt is Bad News for Aussie Stocks

The Great Indian Coal Rush

The Other Side of Short Selling

From the Archives…

Can You Beat Goldman Sachs?
2011-10-14 – Kris Sayce

Three Stocks to Sell Before China Slumps
2011-10-13 – Kris Sayce

Why Allocation Beats Diversification
2011-10-12 – Kris Sayce

Huge Rally – Is the Low In?
2011-10-11 – Murray Dawes

Queensland Housing’s 100-Year Slump
2011-10-10 – Kris Sayce

For editorial enquiries and feedback, email [email protected]


Neighbourhood Cat Reveals “What’s Next” for Silver

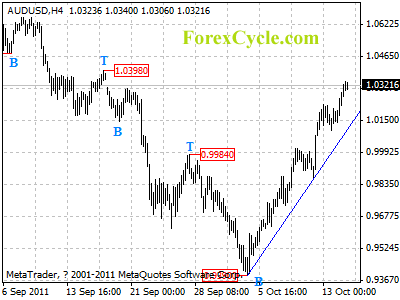
AUDUSD stays above a uptrend line

AUDUSD stays above a uptrend line on 4-hour chart, and remains in uptrend from 0.9390, and the rise has extended to as high as 1.0344. As long as the trend line support holds, uptrend could be expected to continue, and further rise to 1.0500 is possible after a minor consolidation. On the downside, a clear break below the trend line could indicate that a cycle top has been formed on 4-hour chart, and the rise from 0.9390 has completed, then pullback to 0.9900 could be seen.

audusd

Forex: Currency Speculators remained Dollar Bullish last week. Trimmed Euro, GBP shorts

By CountingPips.com

The latest Commitments of Traders (COT) report, released on Friday by the Commodity Futures Trading Commission (CFTC), showed that large futures speculators trimmed  their euro and British pound sterling short positions but remained overall bullish in favor of the US dollar for a fifth straight week. Non-commercial futures traders, usually hedge funds and large speculators, slightly increased their total US dollar long positions to $14.24 billion on October 11th from a total long position of $13.77 billion on October 4th, according to the CFTC COT data and calculations by Reuters which calculates the dollar positions against the euro, British pound, Japanese yen, Australian dollar, Canadian dollar and the Swiss franc.

EuroFX: Currency speculators reduced the short bets for the euro against the U.S. dollar after increasing short positions for seven consecutive weeks. Euro positions rose as of October 11th to a total of 73,795 net short contracts from the previous week’s total of 82,697 net short contracts reported on October 4th. Euro positions were at their lowest point on October 4th since June 8, 2010 when net contracts were on the short side at -111,945.

The COT report is published every Friday by the Commodity Futures Trading Commission (CFTC) and shows futures positions as of the previous Tuesday. It can be a useful tool for traders to gauge investor sentiment and to look for potential changes in the direction of a currency or commodity. Each currency contract is a quote for that currency directly against the U.S. dollar, where as a net short amount of contracts means that more speculators are betting that currency to fall against the dollar and net long position expect that currency to rise versus the dollar. The graphs overlay the forex spot closing price of each Tuesday when COT trader positions are reported for each corresponding spot currency pair.

GBP: British pound sterling positions reversed their six-week decline and increased slightly as of October 11th. Pound positions increased to a total of 61,972 short positions on October 11th following a total of 68,724 short positions as of October 4th.

JPY: The Japanese yen net long speculative contracts declined lower, according to data on October 11th. Yen positions fell to a total of 35,119 net long contracts reported on October 11th following a total of 43,462 net long contracts that were reported on October 4th.


CHF: Swiss franc long positions edged higher and reversed its decline over to the short side against the US dollar for the first time since July of 2010. Speculators rose bets for the Swiss currency futures to a total of 13 net long contracts to what amounts to essentially a neutral position against the dollar following a total of 1,109 net short contracts as of October 4th. The Swiss currency, usually a popular safe haven currency, has seen very little movement since the Swiss National Bank enacted a policy to fight the strength of the franc and maintain a peg against the euro at the 1.20 level.


CAD: Canadian dollar positions dropped lower from the previous week to the lowest bearish level of the year. CAD net contracts fell to a total of 24,913 short contracts as of October 11th following an increase to a total of 15,682 short contracts reported on October 4th.


AUD: The Australian dollar long positions slightly declined as of October 11th after a rebound the previous week. AUD futures positions dipped to a total net amount of 10,753 long contracts following a total of 12,911 net long contracts reported as of October 4th. The September 27th level had marked the lowest level for Aussie positions since July of 2010.


NZD: New Zealand dollar futures positions slightly rebounded after falling for three consecutive weeks to the lowest level since the middle of April. NZD contracts advanced higher to a total of 6,838 net long contracts as of October 11th following a total of 5,566 net long contracts registered on October 4th.


MXN: Mexican peso contracts edged very slightly higher as of October 11th and reversing a continuous decline for nine consecutive weeks. Peso positions edged up to a total of 24,870 net short speculative positions as of October 11th following a total of 25,431 short contracts that were reported as of October 4th.

COT Currency Data Summary as of October 11, 2011
Large Speculators Net Positions vs. the US Dollar

EUR -73795
GBP -61972
JPY 35119
CHF +13
CAD -24913
AUD +10753
NZD +6838
MXN -24878


How Gold & Stocks are About to Repeat the 2010 Bottom

By Chris Vermeulen – thegoldandoilguy.com

In May of 2010, immediately following the flash crash many investors started to become bearish (nervous) regarding their position in gold and equities. Once the general public became aware that the stock market could fall 10% in a matter of minutes, investors became very cautious. Suddenly protecting their capital and current positions was at the forefront of their investment process.

A couple days later the market recovered most of its value, but it became clear that investors were going to sell their long positions if the market showed signs of weakness. It was this fear which pulled the market back down to the May lows and beyond over the next couple months which caused investors to panic and sell the majority of their positions. It is this strong wave of panic selling that triggers gold and stock prices to form intermediate bottoms. Emotional retail traders always seem to buy near the top and sell at the bottom which leads to further pain.

Now, fast forward to today…

This past August we saw another selloff similar to the “Flash Crash” in May of 2010. (I warned followers that gold was on the edge of topping and that stocks would take some time for form a base and bottom – Click Here To Read) Over the past couple months gold, silver, and stocks have been trying to bottom but have yet to do so.

Just a couple weeks ago we saw gold, silver, and equities make new multi-month lows. This has created a very negative outlook among investors which I highlighted in red on the chart below. Since the panic selling low was formed just recently we have seen money pile back into gold and stocks (more so stocks).

This strong bounce or rally which ever you would like to call it may be the beginning stages of a major bull leg higher which could last several months. Before that could happen, I am anticipating a market pullback which is highlighted with red arrows on the chart below.

Chart of SP500, Gold and Dollar Index Looking Back 18 Months

Gold Spot Newsletter


Reasons for gold and stocks to pullback:

  • Stocks are overbought and generally retracements of 50% or 61% are common following large rallies.
  • The dollar index looks ready to bounce which typically means lower gold and stock prices.
  • Gold continues to hold a bearish chart pattern pointing to lower prices still.

Weekly Trend Trading Ideas

A few weeks ago I warned my followers that stocks and gold are forming a bottom and that we should be on the lookout for further confirmation signs. I also mentioned that I was not trying to pick a bottom, rather that I was looking to go long once the odds were more in my favor.

This is a potentially very large opportunity unfolding and there will be several different ways to play this. However, right now I continue to wait for more confirming indicators and for more time to pass before getting subscribers and my own money involved.

From August until now (October 17) the SP500 is down -6.3% and gold is down -8.1%. Subscribers of my newsletter have pocketed over 35% in total gains using my simple low risk ETF trading alerts.

I can email you my bi-weekly reports and videos by joining my free newsletter here: www.GoldAndOilGuy.com

By Chris Vermeulen – thegoldandoilguy.com