VIDEO: Euro Zone Set For Drawn-out Battle Over Banking Rules

Euro zone finance ministers face difficult talks over their plans for a banking union on Tuesday, including how to pay for the winding up of troubled banks, a deeply divisive issue on which Germany has dug in its heels. German finance minister, Wolfgang Schäuble:The aim is for ministers to reach agreement in the next 36 hours, so that European Union leaders can sign off on it at a summit on Thursday and Friday.

VIDEO: Chinese IPOs In US To Start 2014 Fast, Then Sputter

US-listed Chinese stocks neared the end of 2013 with a wild ride last week, providing a glimpse of the bumpy road that lies ahead in the New Year. That performance points to a strong start for new IPOs at the start of 2014, even though momentum could quickly flag due to the highly volatile and unpredictable nature of these stocks.

AUDUSD consolidating below 0.9000 after last week’s decline

2013.12.17 | AUDUSD Market Analysis

AUDUSD Trends & Major Market Levels

The AUDUSD currency pair has been declining in forex market trading today with the AUDUSD registering a high of 0.89572 and reaching to a low of 0.89173 on the day. Trends data shows the pair is continuing lower today in the short-term downtrend with prices trading under the 21-period linear moving average. Over the longer term trend, the pair is essentially trading in a neutral trend as seen on the daily chart by the 90-day Linear Regression Channels below. The AUDUSD has stemmed the sharp decline from last week that brought the pair below the  0.9000 level and has been consolidating for the past few days. Look for local support at the 0.8900 level while the 0.9050 and the 0.9000 major level above presents resistance.

Forex Trends Trading AUDUSD 2013.12.17


AUDUSD Trends Data: Linear Regression Indicator

10-day current trend is BEARISH / Trend strength of -205.8 pips
30-day current trend is BEARISH / Trend strength of -558.8 pips
60-day current trend is BEARISH / Trend strength of -516.3 pips
90-day current trend is BULLISH / Trend strength of 51.0 pips
180-day current trend is BEARISH / Trend strength of -876.7 pips

Fibonacci Retracement Levels: Past 100 Days

— 0.000 – 0.88468
— 0.236 – 0.90616
— 0.382 – 0.91944
— 0.500 – 0.93018
— 0.618 – 0.94092
— 0.764 – 0.95420
— 1.000 – 0.97568


By CountingPips.comForex Trading Apps & Currency Trade Tools

Disclaimer: Foreign Currency trading and trading on margin carries a high level of risk and volatility and can result in loss of part or all of your investment. All information and opinions contained do not constitute investment advice and accuracy of prices, charts, calculations cannot be guaranteed.


USDCAD continues downward action, 1.0500 level test coming?

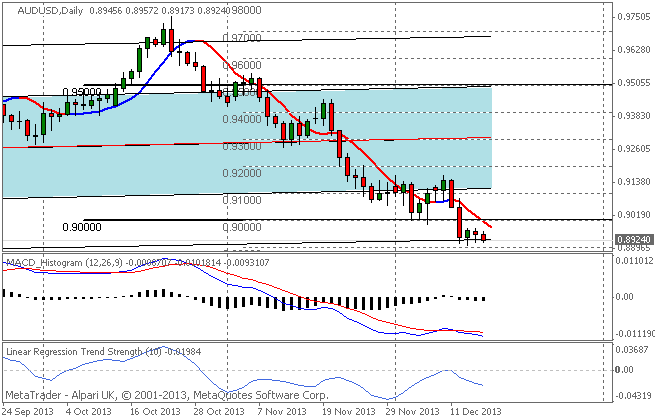
2013.12.17 | USDCAD Market Analysis

USDCAD Trends & Major Market Levels

The USDCAD currency pair has been falling in forex market trading today with the USDCAD registering a high of 1.05953 and reaching to a low of 1.05748 on the day. Trends data shows the pair is currently in a short-term downtrend with prices trading under the 21-period linear moving average. Over the longer term trend, the pair continues to be in an uptrend as seen on the daily chart by the 90-day Linear Regression Channels below.

Forex Trends Trading USDCAD 2013.12.17

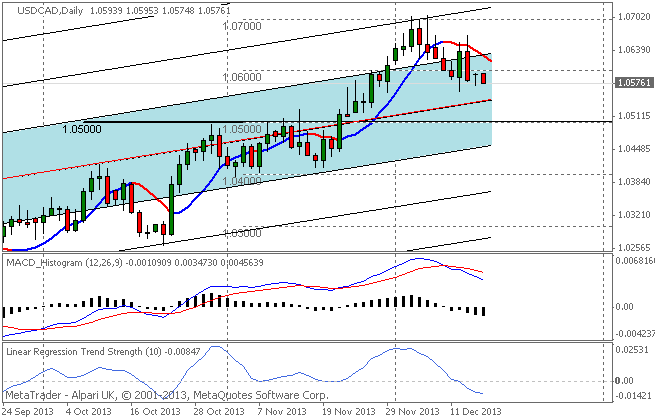
The USDCAD has been on the decline after reaching the 1.0700 level a few times last week. The 1.0550 and then the major 1.0500 levels are looming as the next major targets for prices to the downside while the closest upside obstacle is the 1.0600 round number.


USDCAD Trends Data: Linear Regression Indicator

10-day current trend is BEARISH / Trend strength of -93.7 pips
30-day current trend is BULLISH / Trend strength of 228.6 pips
60-day current trend is BULLISH / Trend strength of 370.0 pips
90-day current trend is BULLISH / Trend strength of 225.1 pips
180-day current trend is BULLISH / Trend strength of 342.8 pips

Fibonacci Retracement Levels: Past 100 Days

— 0.000 – 1.07067
— 0.236 – 1.05826
— 0.382 – 1.05058
— 0.500 – 1.04438
— 0.618 – 1.03817
— 0.764 – 1.03049
— 1.000 – 1.01808


By CountingPips.comForex Trading Apps & Currency Trade Tools


Disclaimer: Foreign Currency trading and trading on margin carries a high level of risk and volatility and can result in loss of part or all of your investment. All information and opinions contained do not constitute investment advice and accuracy of prices, charts, calculations cannot be guaranteed.


GBPUSD Forex Trading Pivot Point Levels for 2013.12.17

2013.12.17 13:30 6:30AM ET | GBPUSD Currency Pair

Here are the Pivot Points Levels with Support (S) and Resistance (R) for the GBPUSD currency pair today. Price action is currently trading under the daily pivot point at the 1.62979 price level, according to data at 6:30 AM ET. The GBPUSD high for the day has been 1.63349 while the low of day reached to 1.62840. The pair earlier today opened the Asian trading session below the daily pivot, found support and rose higher to the R1 resistance level before coming back down to trading under the main pivot.

SC GBPUSD 2013.12.17

Daily Pivot Point: 1.63094
— S1 – 1.62710
— S2 – 1.62458
— S3 – 1.62074
— R1 – 1.63346
— R2 – 1.63730
— R3 – 1.63982


Weekly Pivot Points: GBPUSD

Prices are currently trading below the weekly pivot point at time of writing. The GBPUSD has been on a virtual sideways trend this week after opening the trading week below the weekly pivot.

SC GBPUSD 2013.12.17

Weekly Pivot Point: 1.63403
— S1 – 1.62161
— S2 – 1.61373
— S3 – 1.60131
— R1 – 1.64191
— R2 – 1.65433
— R3 – 1.66221


By CountingPips.com – Forex Trading Apps & Currency Trade Tools


Disclaimer: Foreign Currency trading and trading on margin carries a high level of risk and volatility and can result in loss of part or all of your investment. All information and opinions contained do not constitute investment advice and accuracy of prices, charts, calculations cannot be guaranteed.


USDCHF Forex Trading Pivot Point Levels for 2013.12.17

2013.12.17 13:30 6:30AM ET | USDCHF Currency Pair

Here are the Pivot Points Levels with Support (S) and Resistance (R) for the USDCHF currency pair today. Price action is currently trading under the daily pivot point at the 0.88709 price level, according to data at 6:30 AM ET. The USDCHF high for the day has been 0.88781 while the low of day reached to 0.88557. The pair earlier today opened the Asian trading session slightly below the daily pivot and has trended sideways overall as the day has gone on.

SC USDCHF 2013.12.17

Daily Pivot Point: 0.88736
— S1 – 0.88429
— S2 – 0.88147
— S3 – 0.87840
— R1 – 0.89018
— R2 – 0.89325
— R3 – 0.89607


Weekly Pivot Points: USDCHF

Prices are currently trading under the weekly pivot point at time of writing. The USDCHF has been on an overall slightly bearish trend this week after opening the trading week above the weekly pivot.

SC USDCHF 2013.12.17

Weekly Pivot Point: 0.88885
— S1 – 0.88435
— S2 – 0.87938
— S3 – 0.87488
— R1 – 0.89382
— R2 – 0.89832
— R3 – 0.90329


By CountingPips.com – Forex Trading Apps & Currency Trade Tools


Disclaimer: Foreign Currency trading and trading on margin carries a high level of risk and volatility and can result in loss of part or all of your investment. All information and opinions contained do not constitute investment advice and accuracy of prices, charts, calculations cannot be guaranteed.


USDJPY Forex Trading Pivot Point Levels for 2013.12.17

2013.12.17 13:30 6:30AM ET | USDJPY Currency Pair

Here are the Pivot Points Levels with Support (S) and Resistance (R) for the USDJPY currency pair today. Price action is currently trading just below the daily pivot point at the 102.937 price level, according to data at 6:30 AM ET. The USDJPY high for the day has been 103.100 while the low of day reached to 102.851. The pair earlier today opened the Asian trading session above the daily pivot and has trended slightly lower as the day has progressed.

SC USDJPY 2013.12.17

Daily Pivot Point: 102.974
— S1 – 102.665
— S2 – 102.326
— S3 – 102.017
— R1 – 103.313
— R2 – 103.622
— R3 – 103.961


Weekly Pivot Points: USDJPY

Prices are currently trading under the weekly pivot point at time of writing. The USDJPY has been on an overall sideways trend this week after opening the trading week above the weekly pivot.

SC USDJPY 2013.12.17

Weekly Pivot Point: 103.077
— S1 – 102.241
— S2 – 101.306
— S3 – 100.470
— R1 – 104.012
— R2 – 104.848
— R3 – 105.783


By CountingPips.comForex Trading Apps & Currency Trade Tools

Disclaimer: Foreign Currency trading and trading on margin carries a high level of risk and volatility and can result in loss of part or all of your investment. All information and opinions contained do not constitute investment advice and accuracy of prices, charts, calculations cannot be guaranteed.


EURUSD Forex Trading Pivot Point Levels for 2013.12.17

2013.12.17 13:30 6:30AM ET | EURUSD Currency Pair

Here are the Pivot Points Levels with Support (S) and Resistance (R) for the EURUSD currency pair today. Price action is currently trading virtually on top of the daily pivot point at the 1.37631 price level, according to data at 6:30 AM ET. The EURUSD high for the day has been 1.37816 while the low of day reached to 1.37514. The pair earlier today opened the Asian trading session slightly below the daily pivot and has trended higher over the course of the day.

SC EURUSD 2013.12.17

Daily Pivot Point: 1.37617
— S1 – 1.37256
— S2 – 1.36916
— S3 – 1.36555
— R1 – 1.37957
— R2 – 1.38318
— R3 – 1.38658


Weekly Pivot Points: EURUSD

Prices are currently trading over the weekly pivot point at time of writing. The EURUSD has been on an overall bullish trend this week after opening the trading week below the weekly pivot.

SC EURUSD 2013.12.17

Weekly Pivot Point: 1.37473
— S1 – 1.36846
— S2 – 1.36310
— S3 – 1.35683
— R1 – 1.38009
— R2 – 1.38636
— R3 – 1.39172


By CountingPips.com – Forex Trading Apps & Currency Trade Tools


Disclaimer: Foreign Currency trading and trading on margin carries a high level of risk and volatility and can result in loss of part or all of your investment. All information and opinions contained do not constitute investment advice and accuracy of prices, charts, calculations cannot be guaranteed.