The Secret to Long-Term Investing


Long-Term Investing

If you’re investing in the hopes to get rich quick, it’s time to reconsider.

The truth is, 9.9 times out of 10, real wealth – the kind that allows generations of families to live like kings and queens – is built slowly over time.

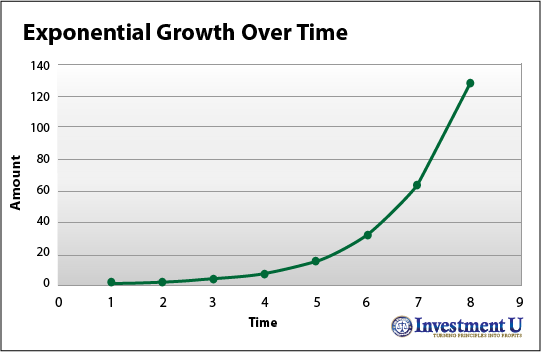
One chart can easily show how it pays to invest for the long term. It’s called an exponential growth chart, or “hockey stick” chart:

Exponential growth of investments over time

And understanding this chart should completely change the way you think about investing for the future.

Investing for the Long Haul

According to Dr. Chris Martenson, a former Fortune 300 executive, “Anything that steadily increases in size as a proportion of its current size” will give you “a chart that looks like… a hockey stick.”

In other words, as long as you can average more growth than not in your investment portfolio, you will experience exponential growth over time.

For investors, it’s easy to see why this kind of growth is a great thing.

Turning $10,000 into $1 Million

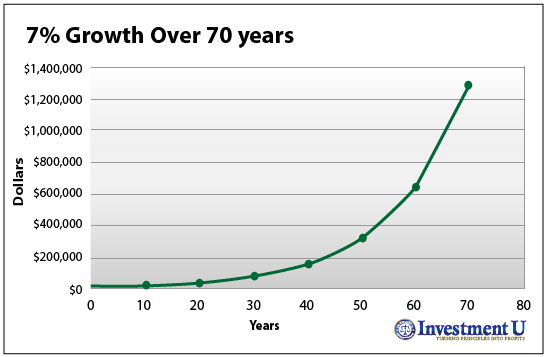
Let’s say you’re 25 years old and you only have $10,000 to invest with. You average just around 7% growth annually in your investment portfolio.

Thanks to compounding growth, at 7% growth, you’d double your portfolio every 10 years.

That means, after 10 years, your portfolio would total $20,000. After 30 years, it would be $40,000. After 40 years, it would be $80,000. And so on.

Over the course of your investment career, here’s what your portfolio would look like simply averaging 7% growth per year:

The long-term investor's secret weapon

It’s important to realize what happens after 40 years of growing $10,000 at 7% per year. Although it takes 40 years to grow your portfolio to just $180,000, it takes just little more than 25 years to earn the remaining $820,000.

This compounding effect is why it’s so important to invest for the long haul. And it should help you make better investment decisions for the rest of your life.

Good Investing,

Mike Kapsch

Article by Investment U

Japan Sees QE


By TraderVox.com

Looks like Valentine’s Day wasn’t only for lovers as the bank of Japan presented the Japanese economy with a present yesterday. Though the Bank of Japan left its interest rates near zero percent yesterday, the central bank shocked the markets by announcing not only an increase in its asset purchases, but also a new inflation outlook.

The Bank of Japan (BOJ)'s first surprise was its decision to adopt a 1.0% target for its CPI. Apparently, the central bank is hoping that adopting the Fed's move of an inflation target would increase confidence amid the country's unclear economic outlook.

Market participants have been worrying about the Japanese economy, especially since the BOJ recently downgraded its economic forecasts from a 0.3% growth to a 0.4% contraction come 2012. Unsurprisingly, the euro zone debt issue and the yen's increased strength ranked high among the central bank's issues.

Until the inflation target is reached though, the BOJ plans will continue to follow through on economic growth through a relatively easing monetary policy. In fact, the BOJ also said yesterday that it would bring in an additional 10 trillion yen into its asset purchasing program, which would boost the size of the program to a total of 65 trillion yen.

From the way the yen pairs reacted, it seems that investors are taking the BOJ seriously. The yen weakened across the board following the announcement, with USD/JPY jumping 34 pips in the first 30 minutes and closed 86 pips above opening price.

 QE, even though it is aimed to stimulate the economic growth, is usually considered bad

Why is this?

Quantitative easing is a method for the currency by which a central bank increases cash supply in the economy by printing new money. The newly-printed money is then used to flood the market with capital in an effort to stoke lending and increase the amount of money in circulation. Unfortunately, by virtue of basic supply and demand, a rise in money supply usually erodes the value of each unit of currency, which might lead inflation.

That being said, I believe that the expansion of the BOJ's asset purchase program, together with their currency intervention policy, will continue to put downside pressure on the yen. Technical analysis also supports this, as the USD/JPY daily chart is showing some signs of reversal.

Article provided TraderVox.com
Tradervox.com is a Forex News Portal that provides real-time news and analysis relating to the Currency Markets.
News and analysis are produced throughout the day by our in-house staff.
Follow us on twitter: www.twitter.com/tradervox

Madison Square Garden Shares Climb as Lin’s Success Helps Drive Knicks Sales

Sales of Knicks merchandise are higher than any other team in the NBA since February 4, with Jeremy Lin’s jersey being the league’s top online seller in that time, as the surprising ascent of the point guard has helped the team’s record and the share price of team parent Madison Square Garden (NASDAQ:MSG), Bloomberg reported earlier.In late morning trade, shares of MSG are up about 3.5% to $32.23.

All Eyes on Euro-Zone Meeting Today

Source: ForexYard

Yesterday was fairly hectic for euro traders after the credit downgrade of several EU countries sent the common currency tumbling. The EUR saw a brief upward correction during mid-day trading after the release of a better than expected German ZEW Economic Sentiment figure. Today, investors will be eagerly awaiting any news out of a meeting of euro-zone finance ministers. Traders can expect heavy volatility, as the meeting is expected to determine whether Greece will receive the bailout package it needs to avoid defaulting on its debt.

Economic News

USD – USD Capitalizes on Euro-Zone, Japanese News

The US dollar was largely bullish throughout yesterday’s trading session, as news out of both Europe and Japan sent investors to the safe-haven currency. Following the credit downgrade of several EU countries, the euro tumbled against the greenback, dropping as low as 1.3126 before staging a mild upward correction. Against the yen, the dollar was boosted after the Bank of Japan announced that it was increasing its asset-buying program in an attempt to strengthen Japan’s economy.

Turning to tomorrow, traders will want to pay close attention to the meeting of euro-zone finance ministers. The meeting will finally determine whether Greece receives its bailout package or not. If the news out of the meeting is positive, investors are likely to move their funds back to the euro which could cause the dollar to stage a reversal.

Additionally, the US TIC Long-Term Purchases figure, scheduled to be released at 14:00 GMT, has the potential to generate some market activity. Should the figure come in above the forecasted level of 62.3B, the greenback may be able to extend today’s gains. At the same time, if the indicator comes in below expectations, the dollar may see a downward correction.

EUR – Euro-Zone Meeting May Lead to Heavy Trading Day

The euro tumbled against virtually all of its main currency rivals yesterday, following the credit downgrade of several EU countries. While the move by Moody’s Investors Service was not unexpected, investors still responded to the news by reverting back to safe-haven assets. The EUR/USD dropped as low as 1.3126, while against the Japanese yen, the common currency fell to 101.81.

The euro saw some relief later in the day, after the German ZEW Economic Sentiment came in well above the expected level. While the indicator led to moderate gains for the euro, the currency was not able to sustain its bullish momentum and eventually dropped again.

Turning to today, the main news event is likely to be a meeting of euro-zone finance ministers. The meeting will determine whether Greece will finally receive an EU bailout package it needs to avoid defaulting on its debt. While most analysts are convinced that the bailout will be approved, Greece still has to show how it plans to make additional budget cuts before any decision is made. Additionally, not all analysts are convinced that even with the bailout Greece will be able to avoid default. Regardless, tomorrow’s trading is likely to be heavily influenced by the meeting. Positive news may lead to a boost for the euro.

JPY – BOJ Actions Cause Yen to Drop

The Bank of Japan (BOJ) surprised many investors yesterday, after it announced that it was increasing its asset-buying program by 10 trillion yen. The move caused the yen to tumble throughout the day. The BOJ has often moved in to weaken the value of the yen in order to boost Japan’s export driven economy. As a result of the move, the USD/JPY shot up close to 100 pips throughout the European session. Meanwhile, the EUR/JPY, despite falling the previous night, was able to rebound and cross the 103.00 level.

Turning to today, traders will want to monitor any euro-zone developments for signs of investor risk appetite. Should positive Greek news be released, the yen could see some losses as riskier currencies are likely to move up. At the same time, even if Greece receives a bailout package, it is still not entirely certain that the money will be enough for the debt-strapped country. If investors continue to think that Greece could still default on its debt, safe-haven currencies like the yen may see a boost.

Crude Oil – Middle East Tensions Lead to Increase in Price of Oil

The price of crude oil spiked during yesterday’s trading session, reaching as high as $101.81 a barrel, before staging a slight downward reversal. Escalating tensions in the Middle East were largely to blame for oil’s bullish trend. Supply side fears are growing as threats from the West to boycott Iranian oil are being matched by Iranian threats to limit exports.

Turning to today, traders will want to continue monitoring the situation in the Middle East. Any increase in rhetoric from Iran is likely to cause the price of oil to go up once again. In addition, should a bailout agreement for Greece finally be reached, riskier assets like crude oil may move up as a result.

Technical News

EUR/USD

The weekly chart’s Stochastic Slow is currently forming a bearish cross, indicating that downward movement could occur for this pair in the near future. This theory is supported by the daily chart’s Williams Percent Range, which is hovering close to the overbought zone. Traders may want to go short in their positions.

GBP/USD

A bearish cross on the weekly chart’s Stochastic Slow indicates that downward movement may occur in the coming days. That being said, most other long-term technical indicators show that this pair is range trading at the moment. Traders may want to take a wait-and-see approach, as a clearer picture may present itself later in the week.

USD/JPY

Most technical indicators on the daily chart show that this pair is overbought and could see a downward correction in the near future. These include the Relative Strength Index, which has cross above 70, and the Williams Percent Range, which is at -10. Going short may be the preferred strategy for this pair.

USD/CHF

The daily chart’s MACD/OsMA has formed a bullish cross, which typically means that upward movement could occur in the near future. This theory is supported by the Stochastic Slow on the weekly chart. Traders may want to go long in their positions for this pair.

The Wild Card

GBP/CAD

Technical indicators are showing that this pair has crossed into oversold territory, and could see a bullish correction in the near future. The Stochastic Slow on the 8-hour chart is currently forming a bullish cross, while the Williams Percent Range on the daily chart is currently at -90. Forex traders may want to go long in their positions today.

Forex Market Analysis provided by ForexYard.

© 2006 by FxYard Ltd

Disclaimer: Trading Foreign Exchange carries a high level of risk and may not be suitable for all investors. There is a possibility that you could sustain a loss of all of your investment and therefore you should not invest money that you cannot afford to lose. You should be aware of all the risks associated with Foreign Exchange trading.



France Experiences Unexpected Growth

Source: ForexYard

printprofile

As fourth quarter GDP numbers came in from around the EU, France presented a pleasant surprise with unexpected growth. As it stands, France is Europe’s second largest economy after Germany. The fourth quarter revealed growth of 0.2% and presented a stark contrast to the struggles of other European economies. Moody’s downgrade of several euro zone countries yesterday, including Spain, Portugal, and Italy, certainly hurt investor confidence and did nothing to turn around the economic downturn in Spain. France’s growth could help stave off an overall recession in the euro zone after the fourth quarter saw French companies investing and consumers spending.

Forex Market Analysis provided by ForexYard.

© 2006 by FxYard Ltd

Disclaimer: Trading Foreign Exchange carries a high level of risk and may not be suitable for all investors. There is a possibility that you could sustain a loss of all of your investment and therefore you should not invest money that you cannot afford to lose. You should be aware of all the risks associated with Foreign Exchange trading.
German GDP Numbers Released

Source: ForexYard

printprofile

Germany released its GDP numbers this morning and revealed that fourth quarter shrinkage was not as severe as some forecasts predicted. German GDP was down 0.2% after growing by 0.6% in the third quarter of last year. While the news is certainly nothing to celebrate, many analysts are confident in the overall health of the German economy. Unemployment levels remain at their lowest point in two decades and the country is still the main player on the European stage.

There still remains the looming Greek debt crisis that threatens to hamper several economies in the euro zone, as we have seen with Spain and Belgium being dragged down into economic downturns. However, German ministers expressed their confidence that their economy would have the durability to withstand such risks.

Forex Market Analysis provided by ForexYard.

© 2006 by FxYard Ltd

Disclaimer: Trading Foreign Exchange carries a high level of risk and may not be suitable for all investors. There is a possibility that you could sustain a loss of all of your investment and therefore you should not invest money that you cannot afford to lose. You should be aware of all the risks associated with Foreign Exchange trading.

Global Monetary Policy Rate Index – Developed Markets


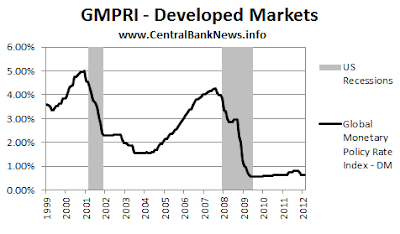
Following on from the initial launch of the GMPRI [Global Monetary Policy Index] this research note focuses on the Developed Markets sub-index. The first point to note is that we have developed history for the index back to January 1999 (data file is available at the bottom of this article). While the method of GDP weighting is also discussed, we have overlain a couple of key data series with the index to demonstrate the value of the index in strategy and forecasting.


The first chart shows the index history back to January 1999, unsurprisingly the index drops during recessions due to the generally pro-cyclical nature of monetary policy (rates rise during boom times, and drop during recessions). It is also worth noting that we modeled four alternative GDP weighting methods (static weight from 2010, a static long term average, monthly phasing of annual data, and a moving average of the monthly phased annual data); while there were no considerable differences between the series, the fourth method makes most intuitive sense as it allows the expression of structural changes but without being too abrupt (which may cause noise).

On the topic of GDP (Gross Domestic Product), the chart above shows the annual rate of economic growth of the countries in the GMPRI-DM index (using the same GDP weighting method). Again the index shows aspects of pro-cyclicality, however there is a weak link between high interest rates and low growth in the following period, and for low rates leading to higher growth in the following period.

Finally, applying the index to a financial market perspective, the above chart shows the annual percent change of the S&P500 along side the index. Two conclusions can be drawn: 1. the stock market appears to anticipate interest rate cuts; and 2. periods of low interest rates are generally supportive of positive equity market returns.

No doubt there are further uses for the index, and other interesting correlations to examine; particularly through transforming the index data e.g. annual percentage change, periods of rising vs falling rates, etc. The data is available for you to use (please cite us as the source), please do let us know if you find any interesting links with the index.

Also stay tuned for more releases; we are presently working on building out history for the emerging market index, and have plans to expand the history for the developed market even further back (which may help provide more robust findings for use in forecasting and strategy).

Access the index data here: GMPRI-DM Data

www.CentralBankNews.info

Central Banks Release Poor Forex Market Data


By TraderVox.com

Last week, major central banks gave their semiannual reports on foreign exchange turnover. It revealed that though trading improved in the United States, it dipped severely elsewhere. The Chart shows some vital data released.

The report also noted that most of the forex dips were caused by fall in forex swaps. Spot trading however remained strong and even rose by about 2%.

So what caused most nations to record a drop in forex turnover?

Well the Swiss National Bank and the Bank of Japan can carry most of the blame.

It is widely thought that the intervention into the market of these two central banks had an adverse effect on overall market activity. Also note that the Yen and Swiss franc are two of the majors and most widely traded currencies in the market. And with them being closely guarded by their respective central banks, there was a resulting friction in speculation and activity in the markets.

The US as mentioned earlier showed a completely different pattern. As result of increased risk appetite, equity trading in the US went up and this consequently led to an increase in currency exchange activity in the region.

Analysts think we would definitely see a decrease in forex activity come the next report. The bank of Japan and Swiss national bank still have a close eye on their currencies and as a result, we think this will further hamper forex activity. There is little knowledge of when another intervention may occur from either bank but we know possibility of an intervention remains high.

Also with the summer fast approaching and many traders set to go on holidays market activity is set to reduce.

On the other hand, with many fundamental activities going on such as the Greek debt deal nearing a close, trading activity may increase.

The good news is that the general uptrend in the forex market still remains and this recent drop in the forex market can be considered a correction. The next semiannual report will say a lot whether the trend remains intact or has been broken for a down trend.

Article provided TraderVox.com
Tradervox.com is a Forex News Portal that provides real-time news and analysis relating to the Currency Markets.
News and analysis are produced throughout the day by our in-house staff.
Follow us on twitter: www.twitter.com/tradervox

U.S. Stocks Rise on Greek Austerity Vote

U.S. stocks rose, after the first weekly loss for the S&P 500 in 2012, as Greece approved austerity plans to secure rescue funds.Financial shares had the biggest advance in the S&P with Bank of America and Citigroup adding at least 1.5 percent. Apple rose 1.2 percent after briefly trading above $500 for the first time. Chesapeake Energy Corp. added 2.1 percent after the natural-gas driller said it’s targeting as much as $12 billion in asset sales and joint ventures this year.