AUD/USD Analysis-June 06,2011

Forex AUD / USD Intraday Analysis – June 6, 2011: Testing Level 1.0888 

Yesterday: Open 1.0672 High 1.0775 Low 1.0596 Close 1.0723 

Yesterday before the initial session the U.S., since the line break through the 1.0680 level, the movement of the Aussie range in the range of 180 pips from 1.0613 support level to nearly the level of the first resistance at 1.0777. 

When the movement of the Aussie looks still bullish. When the main line still remains below the stochastic, then the probability for a small bullish. 

The focus of economic data today for the Aussie currency is:

1. AUD MI Inflation Gauge m / m 
2. AUD ANZ Job Advertisements m / m

20110606_aud

If the price increases that continued the open opportunities to the 1.0888 resistance level. 

We recommend that if a decline continues then the price can reach the support level of 1.0664. 

Prices shown on the graph H1 line MA05 and MA10 in bullish conditions. 

While the Stochastic indicator indicates still more likely bullish when moving in the area above the trend line diagonal.


See more at ForexTradingEVO.com

Forex: Large Currency Speculators raise Dollar shorts. Japanese Yen positions go short

By CountingPips.com

The latest Commitments of Traders (COT) report, released on Friday by the Commodity Futures Trading Commission (CFTC), showed that large futures speculators increased their short positions against the US dollar while raising bets for the euro for the first time in four weeks. Non-commercial futures positions, those taken by hedge funds and large speculators, were overall net short the US dollar by $15.73 billion against other major currencies as of May 31st. The data is a rise from the total short position of $13.02 billion on May 24th, according to the CFTC data and calculations by Reuters which calculates the dollar positions against the euro, British pound, Japanese yen, Australian dollar, Canadian dollar and the Swiss franc.

This week’s notable changes were Canadian dollar positions increasing for the first time in six weeks while Japanese yen positions fell back over to the short side for the first time in close to a month.

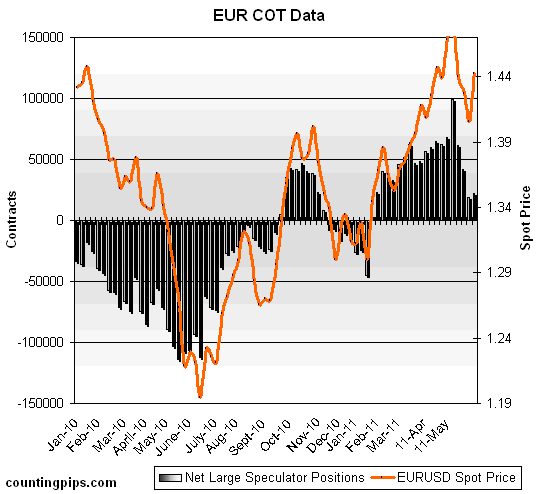
EuroFx: Currency speculators increased their net long positions for the euro against the U.S. dollar after three consecutive weeks of decline. Euro futures positions rose to a total of 21,970 long contracts following a total of 19,129 long positions on May 24th.

euro forex

The COT report is published every Friday by the Commodity Futures Trading Commission (CFTC) and shows futures positions as of the previous Tuesday. It can be a useful tool for traders to gauge investor sentiment and to look for potential changes in the direction of a currency or commodity. Each currency contract is a quote for that currency directly against the U.S. dollar, where as a net short amount of contracts means that more speculators are betting that currency to fall against the dollar and net long position expect that currency to rise versus the dollar. The graphs overlay the forex spot closing price of each Tuesday when COT trader positions are reported for each corresponding spot currency pair.

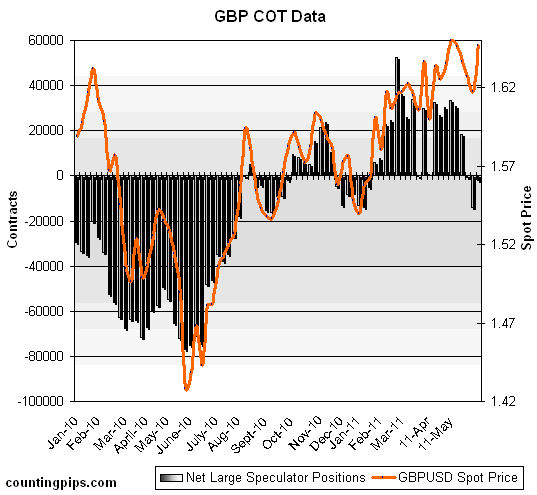
GBP: British pound sterling positions were higher following four straight weeks of decreases. Pound contracts edged up to a total of 1,829 net short positions as of May 31st following a decline the week before to a total of 14,143 short contracts on May 24th. The May 24th data marked the British pound’s lowest speculative positions since September 2010 when short positions numbered 16,060.

british pound sterling forex

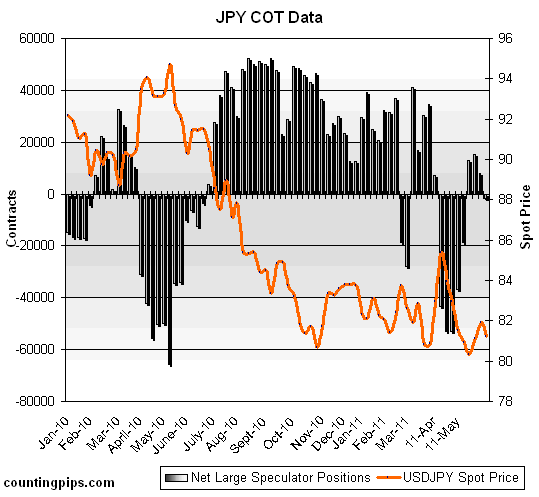
JPY: The Japanese yen net contracts dipped lower for the second straight week and over to the short side after increasing for four consecutive weeks through May 17th. Yen positions decreased to a total of 1,648 net short contracts reported on May 31st following a total of 8,006 net long contracts on May 24th.

japanese yen forex

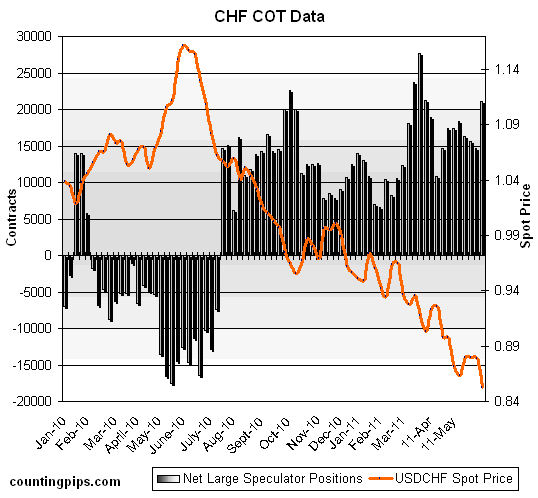
CHF: Swiss franc long positions increased higher after three consecutive weeks of decreases. Franc positions rose to a total of 21,119 net long contracts following a net of 14,725 long contracts on May 24th.

swiss franc forex

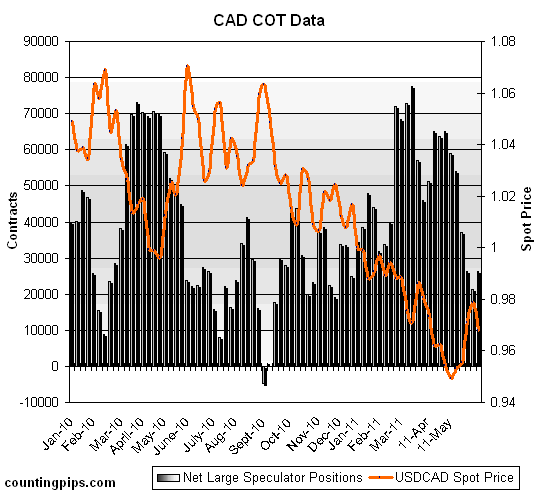
CAD: The Canadian dollar positions rose for the first time in six weeks to a total of 26,402 contracts as of May 31st. CAD net contracts had fallen to a total of 21,277 net long contracts on May 24th.

canadian dollar forex

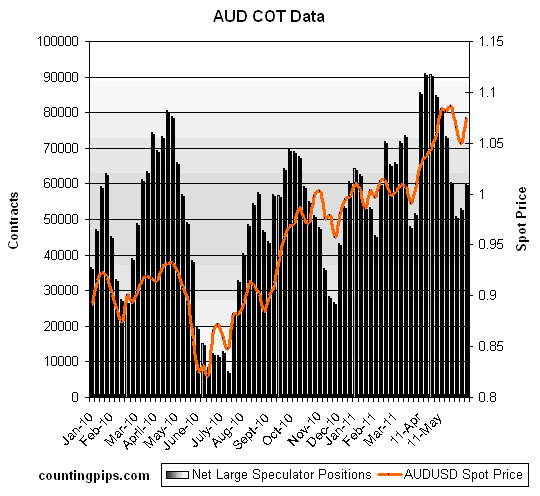
AUD: The Australian dollar long positions edged higher for a second consecutive week. AUD contracts increased to a total net amount of 60,015 long contracts as of May 31st. AUD positions had totaled 53,043 net long contracts on May 24th.


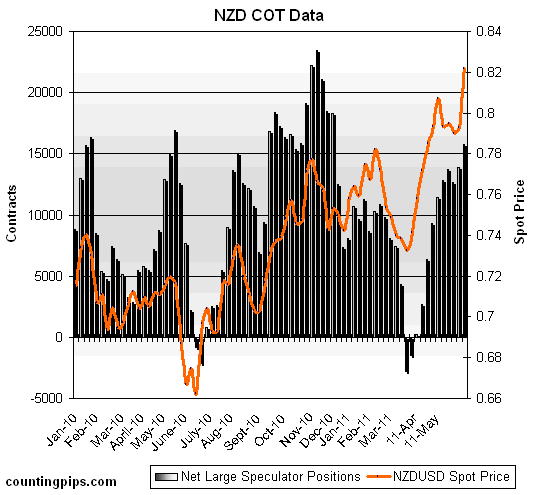
NZD: New Zealand dollar futures positions rose to the highest level since early December and increased for a second straight week. NZD contracts advanced to a total of 15,724 long positions as of May 31st from a total of 13,876 long contracts on May 24th.

new zealand dollar forex

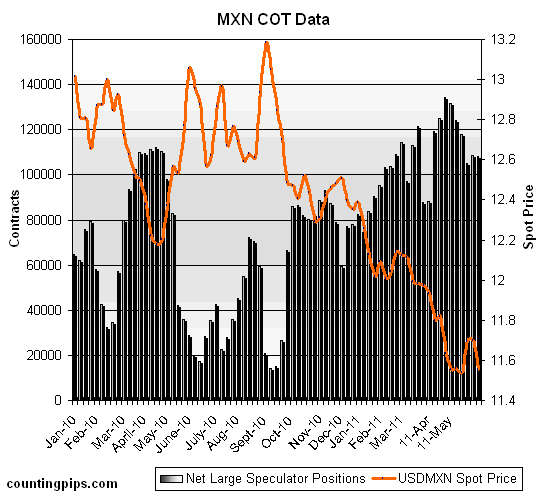
MXN: Mexican peso long contracts were virtually unchanged as of the May 31st data release. MXN contracts dipped just slightly to 108,268 net long contracts as of May 31st from a total of 108,681 long contracts as of May 24th.

mexican peso forex

COT Data Summary as of May 31, 2011
Large Speculators Net Positions vs. the US Dollar

EUR: +21,970
GBP: -1,829
JPY: -1,648
CHF: +21,119
CAD: +26,402
AUD: +60,015
NZD: +15,724
MXN: +108,268

AUD/USD At 3 Week Range Highs

AUD/USD At 3 Week Range Highs

The news that only 54,000 U.S. jobs were gained in May was around a third of the forecast level.  This should encourage AUD/USD bulls to push the pair towards the 1.1000 resistance highs over the coming weeks – unless their is a significant deviation from forecast news over the coming weeks – which is always possible.

The AUD/USD currency pair has been consolidating between the key 1.0500 support  and 1.1000 resistance levels.
Next week brings important Australian data including unemployment data on Thursday which is predicted by analysts to stay at 4.9%.  The employment change figure is also expected to rise after falling last month.The RBA rate decision will be revealed on Tuesday with the benchmark rate forecast to stay at 4.75%.

Please see Forex-FX-4X for further analysis:

Forex Analysis

Trading Psychology


EURUSD’s rise from 1.3969 extended to 1.4642

EURUSD’s rise from 1.3969 extended to as high as 1.4642. As long as 1.4939 key resistance holds, the rise is treated as correction of downtrend from 1.4939, and another fall towards 1.3500 is still possible. However, a break above 1.4939 will indicate that the long term uptrend from 1.2874 (Jan 10 low) has resumed, then next target would be at 1.5500 area.

For long term analysis, EURUSD had formed a cycle top at 1.4939 on weekly chart. Further fall towards 1.1500 is possible in next several months.

eurusd

Weekly Forex Analysis

Your Most Important Investing Decision of the Next 10 Years

By Carla Pasternak, DividendOpportunities.com

Think of where you’d be right now if you’d made this move ten years ago. The S&P 500 is up only 28% during that time. You could have seen returns of 328%, 305%, or 626%.

And that’s with some of the most boring companies you can think of — housing REITs, pipeline operators, and cigarette makers. But they all have one thing in common.

They pay dividends.

As the Chief Investment Strategist behind High-Yield Investing, I’m biased. But I think dividends are the most powerful tool in investing. You don’t have to take my word for it. Other investors agree:


“I have made more money in retirement than I did when I was working. Income from dividend-paying stocks (which I collect every month) is even better than my greatest expectations. 

High-Yield Investing subscriber, William B.

Even John D. Rockefeller once quipped that the only thing that gave him pleasure was to see his dividend coming in.

The simple fact is that how you treat the dividend — often the forgotten step-child among investors — is the most important investing decision you’ll make today… in the next year… even the next decade.

Let me show you what I mean.

Take two portfolios, each worth $100,000. The first one earns 8% in capital gains each year. The second one earns half that amount in capital gains — only 4% each year — but earns a 6% dividend that’s reinvested.

I chose these numbers as they illustrate a choice investors are usually faced with — invest in a faster-growing stock that doesn’t pay a cent in dividends, or earn a nice yield and see slower growth. Here’s the best news — you’ll end up earning more with the dividend, and typically have fewer ups and downs as you would with a riskier growth stock.

In fact, in 10 years your portfolio would be worth $265,089 if you went with the dividend-paying holdings, versus $215,892 with the growth-only portfolio.

Over even longer, the difference is more dramatic.

Wait 20 years and your dividend portfolio would be worth over $702,723 compared to $466,096 — a difference of more than $200,000.

And here’s the best part. The misconception is that dividend payers are boring, stodgy securities. They might pay a few percent, but they won’t return enough to really make a difference.

That couldn’t be further from the truth…


Shares of EV Energy Partners (Nasdaq: EVEP) yield 5.5%, but that hasn’t stopped them from returning 459% since the March 6, 2009 low. 

During the same time, the Reaves Utility Income Fund (AMEX: UTG) has returned 284%, while paying monthly dividends that now equal a 5.8% yield.

And Medical Properties Trust (NYSE: MPW) has returned 398% in addition to its 6.5% yield.

But that’s during a strong market rally, and coming off of multi-year lows. What about in different conditions?

Eagle Rock Energy (Nasdaq: EROC) is paying 5.2% and has a total of return of 128% in the past year.

Since just September 2010 Universal Healthcare Trust (NYSE: UHT) has returned 38%, thanks in part to a 5%-plus yield.

That’s not to say every dividend payer will be a big winner. It won’t be, and I wouldn’t listen to anyone who says they can guarantee a stock’s gains.

But in the sizzle of the mainstream financial media, it’s the fast-moving names like Apple and Google that get most of the headlines. As you can see, it may just be the dividends that are most important to your success.


Good Investing!


Carla Pasternak’s Dividend Opportunities

P.S. — Don’t miss a single issue! Add our address, [email protected], to your Address Book or Safe List. For instructions, go here.

Disclosure: StreetAuthority owns shares of UTG as part of The Daily Paycheck’s $200,000 “real money” portfolio. In accordance with company policies, StreetAuthority always provides readers with at least 48 hours advance notice before buying or selling any securities in any “real money” model portfolio.

The Next Market Bubble Is Forming and No One Sees It

The mass media is obsessed with bubbles. They see market bubbles everywhere, like in crude oil, soft commodities or China… Granted, there are some serious issues with all three, especially with China and its consumption of the other two.

According to a report from a colleague of mine, there could be something happening with regard to China and its crude oil that could have a larger impact than what mainstream media has us concerned about. Follow this link to read more about China’s secret oil “colony.”

But the mainstream hasn’t seen the market bubble I want to talk about today.

Remember the Dot-Com Era?

I know I do. Specifically I remember the summer of 2000, which was the beginning of the end for many dot-com companies. One experience punctuated the end of the decade for me (and it wasn’t the Y2K scare).

At the time I was an options market maker. It was our job to create liquidity for the options markets. When the public was selling options, we were buying them and vice versa. A friend of mine was going on vacation for the month of June and asked me to trade a couple positions he had in Broadcom (BRCM:NASDAQ). Back then BRCM was a high-flying (and fast dropping) IPO. I was excited and scared at the same time.

I remember he said one thing to me before he left: “make sure no matter what happens that you are long gamma!”

That was a bold statement to make. It meant that this stock was going to be very volatile and you better be on your toes.

That summer, BRCM rallied over 140%, to a high of about $185 — By February of 2001, it had fallen to $18 a share.

I remind you of this stock because we must remember how it was hyped up, misunderstood and subsequently pumped to price levels that were unsustainable, all due to something called the Internet. Amateurs and professionals alike were lured into worthless companies like the children of Hamelin were led to death by the Pied Piper.

There was no way to quantify the potential earnings of many of these companies, because we simply did not know what the Internet would become, how people would use it or how companies would profit from it. People simply bought blindly and ignored logic. Many saw their fortunes crumble.

Social Media = Dot-Com 2.0

In my eyes, social media is in many ways the dot-com of today. It carries the same ambiguity and mystique, which makes it both sexy and scary at the same time. And social media companies are attracting many of the same types of personalities that were lured by the likes of webvan.com, pets.com and other Internet flops.

Social media companies are supposed to be changing, tracking and profiting from the ways we communicate, entertain and market to one another. The Internet is an instantaneous gateway to information no matter where it is. But social media is the structure, sorting and disseminating that information.

Unlike industry media, social media is consumer generated. It’s a way for us to share information with our friends in the most effective way. There are companies trying to profit from the new ways we interact, but not every company will get its time in the sun.

The big problem is that social media is still evolving. The way we learn and share information is constantly changing. And there is a ton of it including blogs, videos, tweets and reviews.

Right now we don’t know what social media companies will be successful because much of it is still an experiment of sorts.

I’m not trying to be Debby Downer, but I remember the bad days of dot-com vividly. I know dozens who lost everything betting on tech companies. It seems to be happening all over again.

Do your homework before investing in any of these companies and do your best to ensure that their revenue streams are scalable and sustainable!

(Sign up for Smart Investing Daily and let me and fellow editor Sara Nunnally simplify the market for you with our easy-to-understand articles.)

The IPO March

To be fair, several of the companies coming to market do have more extensive track records and are even seeing strong revenue growth. The key will be profitability and growth in the long term.

LinkedIn (LNKD:NASDAQ) — This hot issue came to market last week and after hitting a high of $120, the shares have since tumbled to $78. What makes LNKD dangerous at this price is the fact that it made less than $10 million last year (though, the company is growing) and yet the market valued it over $8 billion.

What’s worse is that Facebook could easily expand its employment history section and do everything that LinkedIn does, but better. It also has a much broader client base. LinkedIn is looking more like an employment site like Monster.com and CareerBuilder.com. Both have seen their shares tumble over the past year.

Options markets are also pricing in a huge drop in LinkedIn shares. The skew is massive, meaning that the out-of-the-money (OTM) puts are 41% more expensive than the OTM calls in some cases.

(Editor’s Note: For put options, out of the money means the price at which you can exchange your options for stock is lower than the current price of the stock. For more information on options and options education, check out Jared’s service, WaveStrength Options Weekly.)

I see the shares much lower in the coming months.

Groupon — Last night Groupon announced its intentions to be listed under the symbol “GRPN.” The company is looking to raise $750 million to expand and improve its business. In the first quarter of the year, it realized $644.7 million in revenue, but reported a $113.9 million loss (due to expansion).

Groupon is a great service and unique business model, but there is serious competition building. The other thing is business owners usually have to offer goods and services at or below cost. These companies could be disappointed when Groupon users don’t become regular paying customers.

I would like to see another year of sales growth before I put any money in Groupon.

Pandora (music) — The music streaming service is set to begin trading under the ticker symbol “P.” Shares are expected to be priced around $7-$9.

While Pandora is cool, it has a plethora of competition, which makes sustainability and growth hard to justify.

Facebook — Facebook is the beast in the space; I equate it to Google in terms of reach and sustainability. Like Google, it sorts data from millions of users and sells that data to advertisers. Facebook has weaved its way into just about every smartphone, home PC and website out there.

And it is making money. According to notes from Seeking Alpha, Facebook made an approximate $2 billion in revenue in 2010. They also noted that Facebook should earn $5 billion by 2012. Using Google’s margins as a guideline, Facebook is on track to make $1.5 billion in profits by 2012. This is an IPO I would truly look into buying (depending on where it is priced, of course).

If you remember my story about Broadcom earlier, many of my colleagues are saying the same thing now that was said to me then and that scares me.

Many of these companies have positive aspects. I highlighted the negative aspects not to scare you but to insure that you consider all scenarios before jumping into a “hot” social media stock.

Editor’s Note: Make big profits in the coming “technology metals” crisis… The U.S. wants to use “green technology” to decrease our dependence on oil. But China has a 97% monopoly on a natural resource that is vital to green technology… and we’re about to experience a serious shortage! Learn which companies could solve this crisis and hand you staggering gains in this URGENT FREE REPORT.

Article brought to you by Taipan Publishing Group. Additional valuable content can be syndicated via our News RSS feed. Republish without charge. Required: Author attribution, links back to original content or www.taipanpublishinggroup.com.

10 Darkest Days in Wall Street History

In recent months, some doomsayers have predicted there will be another market crash in 2011, and that Wall Street’s “con game” will be once again exposed. As the years have passed, it has become more apparent that we’re incapable of learning from our mistakes, as evidenced by the subprime credit meltdown that was foretold well-before it occurred. Economics, like sociology, is a fascinating study with complex twists and turns, many of which have been repeated throughout history. The following gloomy days in Wall Street history are stark reminders of its instability — and even our gullibility.

  1. March 14, 1907: Real estate speculation and attempted company takeovers after the San Francisco earthquake of 1906 contributed to the crash 1907, in which the Dow suffered a loss of more than eight percent, closing at 76.23. Because many people were borrowing for speculation and a large portion of the real estate in the quake-ravaged region was insured by companies in the U.K., interest rates increased dramatically. Those rates, along with uncharacteristically high real estate prices, slowed investments on capital goods. The resulting instability fed the Panic of 1907.
  2. October 24, 1929: An event that will forever live in infamy, the Stock Market Crash of 1929 dealt a crushing blow to the U.S. economy. Most notably, it signified the beginning of the Great Depression, which lasted all the way until World War II. The onset of the ordeal occurred on Black Thursday, when share prices on the New York Stock Exchange plummeted. In a mass panic, $5 billion vanished as almost 13 million shares were traded, more than three times the normal volume. A brief rally at the end of the day, led by Richard Whitney, head of the New York Stock Exchange, boosted confidence slightly, but ultimately failed to halt a full-blown meltdown.
  3. October 28, 1929: Following a better Friday, investors returned on Monday to experience another rapid deterioration. They attempted to flee the market while they could, but for many it was too late. By the end of the day, trading volumes almost reached 9.25 million and the Dow fell 13 percent (38 points), a record loss. The confidence that was established at the end of the previous week was gone, and the stage was set for the most unforgettable day of 1929.
  4. October 29, 1929: Black Tuesday is when the crisis reached its apex. In just a matter of a few hours, the financial gains of the previous year were eliminated, and consumer confidence tumbled. Everyone was selling and nobody was buying, causing the ticker to lag behind by almost two hours. An astonishing 16 million shares were traded on the day, a record that stood for 40 years, and the Dow closed with a 12 percent loss (30 points). The hoards of people who had previously borrowed to participate in the bull market were forced to sell their belongings in an effort to pay back their debts. Banks and businesses closes, and many American citizens would be left destitute without their jobs or any financial assistance.
  5. July 8, 1932: Almost three years after the dark days of October 1929, the Dow’s long and steady decline hit its lowest point, closing at 42.22, an 89 percent decrease from its peak. Although it wasn’t a one day catastrophe like the aforementioned events, it serves as a benchmark in history. Not only did it squelch any remnants of consumer confidence, but it also helped Franklin Roosevelt win the upcoming presidential election, enabling him to implement his New Deal initiatives, which some credit with eventually ending the Depression.
  6. October 19, 1987: One widely agreed upon conclusion hasn’t been reached regarding the events that led to Black Monday, when the Dow dropped by its largest margin in history at the time, more than 22 percent (508 points). The worldwide crash included drops of 45.5 percent in Hong Kong, 41.8 percent in Australia, 31 percent in Spain and 26.5 in the U.K., a sequence of events that spread westward. In addition to turmoil in international markets, economists have attributed it to the faltering dollar, market psychology and program trading, the latter of which was predicted by Congressman Edward J. Markey before the crash. Fortunately, the market swiftly stabilized afterward, improving by 15 percent above the closing number on Black Monday at the end of the month.
  7. September 17, 2001: The September 11th attacks impacted different aspects of our lives — security, defense, freedom and, of course, the economy. When the market reopened after a four-day closure following the attacks, stocks plunged to three-year lows, decreasing more than seven percent. Boeing and United Technologies, an aviation parts supplier, suffered the biggest losses. At that point, it was the biggest one-day and one-week point losses in the history of the Dow, which had previously been unaffected by the ongoing recession.
  8. February 27, 2007: Overshadowed by the events of the following year, the 2007 crash was quickly forgotten by those who weren’t directly affected by it. Even still, it stands as one of the largest drops point-wise in the history of the Dow. Investors sold en masse amid worries of economic growth in the U.S. and worldwide, plummeting Chinese stocks and an apparent assignation attempt on Vice President Cheney by the Taliban in Afghanistan. Fears of a major selloff had been looming for months after the Dow had reached record highs during an eight-month rally.
  9. September 15, 2008: With more than $600 billion in assets, the demise of Lehman Brothers, the fourth largest investment bank in the U.S., had major repercussions on the economic health of the nation. The largest bankruptcy in the history of the country, along with the sale of Merrill Lynch to Bank of America to avoid financial crisis, resulted in a 504-point drop in the Dow, and helped set forth the panic of the following weeks. The struggling AIG, formerly the 18th-largest public company in the world, was spared thanks to assistance from the government, which, among other things, immediately provided an $85 billion credit facility.
  10. September 29, 2008: It was a catastrophe that defined a generation on Wall Street. After the House of Representatives failed to pass Bush’s $700 million bailout plan for the ailing financial institutions, more than $1.2 trillion was gone from the U.S. stock market, the biggest decrease in the history of the Dow Jones. The biggest drop, 400 points, came in just 10 minutes, not long after it became evident the bill was going to fail.

Article courtesy of http://www.onlinecertificateprograms.org/


The Next Market Bubble Is Forming and No One Sees It

social mediaThe mass media is obsessed with bubbles. They see market bubbles everywhere, like in crude oil, soft commodities or China… Granted, there are some serious issues with all three, especially with China and its consumption of the other two.

According to a report from a colleague of mine, there could be something happening with regard to China and its crude oil that could have a larger impact than what mainstream media has us concerned about. Follow this link to read more about China’s secret oil “colony.”

But the mainstream hasn’t seen the market bubble I want to talk about today.

Remember the Dot-Com Era?

I know I do. Specifically I remember the summer of 2000, which was the beginning of the end for many dot-com companies. One experience punctuated the end of the decade for me (and it wasn’t the Y2K scare).

At the time I was an options market maker. It was our job to create liquidity for the options markets. When the public was selling options, we were buying them and vice versa. A friend of mine was going on vacation for the month of June and asked me to trade a couple positions he had in Broadcom (BRCM:NASDAQ). Back then BRCM was a high-flying (and fast dropping) IPO. I was excited and scared at the same time.

I remember he said one thing to me before he left: “make sure no matter what happens that you are long gamma!”

That was a bold statement to make. It meant that this stock was going to be very volatile and you better be on your toes.

That summer, BRCM rallied over 140%, to a high of about $185 — By February of 2001, it had fallen to $18 a share.

I remind you of this stock because we must remember how it was hyped up, misunderstood and subsequently pumped to price levels that were unsustainable, all due to something called the Internet. Amateurs and professionals alike were lured into worthless companies like the children of Hamelin were led to death by the Pied Piper.

There was no way to quantify the potential earnings of many of these companies, because we simply did not know what the Internet would become, how people would use it or how companies would profit from it. People simply bought blindly and ignored logic. Many saw their fortunes crumble.

Social Media = Dot-Com 2.0

In my eyes, social media is in many ways the dot-com of today. It carries the same ambiguity and mystique, which makes it both sexy and scary at the same time. And social media companies are attracting many of the same types of personalities that were lured by the likes of webvan.com, pets.com and other Internet flops.

Social media companies are supposed to be changing, tracking and profiting from the ways we communicate, entertain and market to one another. The Internet is an instantaneous gateway to information no matter where it is. But social media is the structure, sorting and disseminating that information.

Unlike industry media, social media is consumer generated. It’s a way for us to share information with our friends in the most effective way. There are companies trying to profit from the new ways we interact, but not every company will get its time in the sun.

The big problem is that social media is still evolving. The way we learn and share information is constantly changing. And there is a ton of it including blogs, videos, tweets and reviews.

Right now we don’t know what social media companies will be successful because much of it is still an experiment of sorts.

I’m not trying to be Debby Downer, but I remember the bad days of dot-com vividly. I know dozens who lost everything betting on tech companies. It seems to be happening all over again.

Do your homework before investing in any of these companies and do your best to ensure that their revenue streams are scalable and sustainable!

(Sign up for Smart Investing Daily and let me and fellow editor Sara Nunnally simplify the market for you with our easy-to-understand articles.)

The IPO March

To be fair, several of the companies coming to market do have more extensive track records and are even seeing strong revenue growth. The key will be profitability and growth in the long term.

LinkedIn (LNKD:NASDAQ) — This hot issue came to market last week and after hitting a high of $120, the shares have since tumbled to $78. What makes LNKD dangerous at this price is the fact that it made less than $10 million last year (though, the company is growing) and yet the market valued it over $8 billion.

What’s worse is that Facebook could easily expand its employment history section and do everything that LinkedIn does, but better. It also has a much broader client base. LinkedIn is looking more like an employment site like Monster.com and CareerBuilder.com. Both have seen their shares tumble over the past year.

Options markets are also pricing in a huge drop in LinkedIn shares. The skew is massive, meaning that the out-of-the-money (OTM) puts are 41% more expensive than the OTM calls in some cases.

(Editor’s Note: For put options, out of the money means the price at which you can exchange your options for stock is lower than the current price of the stock. For more information on options and options education, check out Jared’s service, WaveStrength Options Weekly.)

I see the shares much lower in the coming months.

Groupon — Last night Groupon announced its intentions to be listed under the symbol “GRPN.” The company is looking to raise $750 million to expand and improve its business. In the first quarter of the year, it realized $644.7 million in revenue, but reported a $113.9 million loss (due to expansion).

Groupon is a great service and unique business model, but there is serious competition building. The other thing is business owners usually have to offer goods and services at or below cost. These companies could be disappointed when Groupon users don’t become regular paying customers.

I would like to see another year of sales growth before I put any money in Groupon.

Pandora (music) — The music streaming service is set to begin trading under the ticker symbol “P.” Shares are expected to be priced around $7-$9.

While Pandora is cool, it has a plethora of competition, which makes sustainability and growth hard to justify.

Facebook — Facebook is the beast in the space; I equate it to Google in terms of reach and sustainability. Like Google, it sorts data from millions of users and sells that data to advertisers. Facebook has weaved its way into just about every smartphone, home PC and website out there.

And it is making money. According to notes from Seeking Alpha, Facebook made an approximate $2 billion in revenue in 2010. They also noted that Facebook should earn $5 billion by 2012. Using Google’s margins as a guideline, Facebook is on track to make $1.5 billion in profits by 2012. This is an IPO I would truly look into buying (depending on where it is priced, of course).

If you remember my story about Broadcom earlier, many of my colleagues are saying the same thing now that was said to me then and that scares me.

Many of these companies have positive aspects. I highlighted the negative aspects not to scare you but to insure that you consider all scenarios before jumping into a “hot” social media stock.

Editor’s Note: Make big profits in the coming “technology metals” crisis… The U.S. wants to use “green technology” to decrease our dependence on oil. But China has a 97% monopoly on a natural resource that is vital to green technology… and we’re about to experience a serious shortage! Learn which companies could solve this crisis and hand you staggering gains in this URGENT FREE REPORT.

Article brought to you by Taipan Publishing Group. Additional valuable content can be syndicated via our News RSS feed. Republish without charge. Required: Author attribution, links back to original content or www.taipanpublishinggroup.com.
{jtagstpg} {authorstpg}

Other Related Sources:

  • LinkedIn Not Ready to Support Current Price
  • Riots, Social Media and Price Controls
  • LinkedIn IPO: What Does This Mean For Facebook?
  • US Non-Farm Payrolls Data on Tap Today

    Source: ForexYard

    With today’s Non-Farm Payroll (NFP) figure on the way, traders appear to have lost tremendous optimism about the stability of their portfolios and have temporarily shifted to safety. The US economy has so far benefited from this shift as a stronger dollar should give Americans more buying power in the days ahead.

    Economic News

    USD – US Dollar Mildly Bullish ahead of NFP Report

    The US dollar (USD) experienced mildly bullish results yesterday as traders began to shift away from the euro (EUR) following the downgrade of Greece by Moody’s Investor Services. The move was followed by a downturn in risk appetite which has so far fueled growth in safe havens like the USD, Swiss franc (CHF) and Japanese yen (JPY).

    With today’s Non-Farm Payroll (NFP) figure on the way, traders appear to have lost tremendous optimism about the stability of their portfolios and have temporarily shifted to safety. The US economy has so far benefited from this shift as a stronger dollar should give Americans more buying power in the days ahead.

    The issue of interest rate differentials has driven market participants bonkers over the past two weeks. Indeed, the shift in value of safe-havens and the EUR has made forecasting a much more difficult profession. Today’s NFP release from the US economy, however, should give us some much needed perspective. If the figure comes out below expectations, which seems typical these past few months, then we should see a further shift into the safety of the USD, JPY and CHF as traders flee risk.

    EUR – EUR in Decline as Region Observes Ascension Day

    The euro appears to have lost substantially against its primary currency rivals yesterday following the downgrade of Greece by Moody’s Investor Services. The data releases published over the last several days have pushed many traders away from riskier assets, but the EUR had fought through the pain until the bond rating downgrade. With Europe absent from the calendar yesterday in observance of Ascension Day across most of the region, thin market environments favored the rise of safe-haven currencies.

    Many analysts have also the rise in poor fundamental data out of the United States and other large economies. Such detrimental growth figures have weighed on investor sentiment and the ratings downgrade was the straw that broke the camel’s back. The EUR/USD was down from its three-week high of 1.4450 to a current price near 1.4300.

    As for today, the euro is largely absent from the calendar. The major news today is the US publication of Non-Farm Payrolls (NFP), but Great Britain’s publication of services PMI data could show further stagnation in the region’s economy. Any additional blight in fundamental data is likely to push more investors into the safety of the Swiss franc and Japanese yen, with the US dollar gaining some of the overflow.

    JPY – Japanese Yen Mixed as US Dollar Surges

    The JPY has been trading with largely positive results since yesterday as investors turn their focus elsewhere. After a week of ups and downs, the Japanese yen appears set to make gains today as investors largely flee riskier assets. The low interest rates of the Japanese economy have helped pull many investors into the safety of the yen following yesterday’s rate announcement by the ECB.

    With Japan’s economy coming back online from a week of holiday celebrations, the market should receive a modicum of additional liquidity from the return of this island giant. The impact may be felt in today’s early hours, but the news from the US economy regarding Non-Farm Payrolls (NFP) will be today’s biggest market mover. Traders should tune in to that report as it is likely to drive today’s more important portfolio shifts and adjustments.

    Oil – Crude Oil Prices Plummet Sharply as USD Soars

    The price of Crude Oil ended Thursday much lower as traders largely began to pull out from their investments in physical assets while the US dollar made a rapid jump. The result has been a sharp drop in oil prices, pushing well below yesterday’s expected $102 a barrel and landing close to $99 by day’s end.

    Recent events have made speculating about oil prices more difficult. The plummeting value of the US dollar over the last few days should have helped lift oil prices, but the commodity remained in free fall for the second consecutive day. Rising stockpiles in the United States, reported Thursday, may have helped fuel the shift away from oil as rising inventory tends to suppress price hikes. As for the rest today, oil prices appear heavily leaning towards the downside, with targets below $99 a barrel in sight.

    Technical News

    EUR/USD

    After rising above 1.4450, a level that coincides with the 50% retracement of the May move lower, resistance is now found at 1.4570 from the 61.8% retracement target followed by 1.4750 from the late April and early May lows. A breach here would target the May high at 1.4940. 1.4350 should serve as the initial support level followed by 1.4160 from the rising support line off of the May low and the 100-day moving average at 1.4070.

    GBP/USD

    After a failure to close above the 1.6515 resistance level the pair declined sharply and found support near the 50-day moving average at 1.6325. A break below 1.6300 would perhaps then test the rising trend line off of the May 2010 low at 1.6140. Below the trend line the March low at 1.5935 comes into play.

    USD/JPY

    The yen’s rally failed to breach the 82.25 resistance as well as the 100-day moving average before the pair turned sharply lower while making a significant close below the rising trend line from the May low. Falling daily stochastics point to further declines in the pair. Therefore traders may look to be short on the USD/JPY with initial support at 80.70 and 80.35, followed by the May low at 79.50. A breach here would expose the pre-intervention low at 76.10. A move to the upside and the pair may encounter initial resistance at the previous trend line which comes in at 81.95, followed by 82.25, and retracement targets from the April to May move at 82.50 and 83.25.

    USD/CHF

    The pair continues to make new all-time lows and as such traders may want to find better levels at which to enter the trend. Initial support is found at 0.8550 followed by the falling trend line off of the February high which comes in today at 0.8780.

    The Wild Card

    Silver

    Silver prices have come off their recent high near $50 and have retraced roughly 38% of the April/May declines before heading lower again. The commodity is currently testing a short term trend line off of the May lows which comes in today at $35.75. Forex traders should note a break here could trigger additional losses back to the May low at $32.30

    Forex Market Analysis provided by ForexYard.

    © 2006 by FxYard Ltd

    Disclaimer: Trading Foreign Exchange carries a high level of risk and may not be suitable for all investors. There is a possibility that you could sustain a loss of all of your investment and therefore you should not invest money that you cannot afford to lose. You should be aware of all the risks associated with Foreign Exchange trading.