Jan. 24 (Bloomberg) — Paulson & Co., the $35.9 billion hedge fund run by John Paulson, told clients that it made more than $1 billion on its Citigroup Inc. investment in the last 18 months. Citigroup was the fund’s most profitable bank holding last year, Paulson said in a letter to clients this month. Bloomberg’s Julie Hyman reports. (Source: Bloomberg)
First Philippine Holdings (FPH) Undecided Of Its Trend
Hello guys, the Philippine Stock Market hasn’t been performing lately. Many blue chips have broken down from its immediate uptrend like the stocks of Filinvest Land Inc (FLI) among others. I had a post on this before it broke down (kindly see here). We’ve seen breakdowns from bearish reversal patterns as well like in Megaworld Corporation (MEG) which I mentioned more than a week ago (here) and EEI Corporation (EEI) which I posted over the weekend (here).
On today’s canvass, though, is the daily chart of First Philippine Holdings Corporation (FPH) which is owned by the Lopez family along with ABS-CBN Corporation (ABS), Lopez Holdings Corporation (LPZ) and First Gen Corporation (FGEN). At present, the company is working on their solar plant at Tanauan, Batangas in its pursuit for an alternative energy source for the country. It’s really great to hear that more companies are opting for greener energy solutions nowadays.
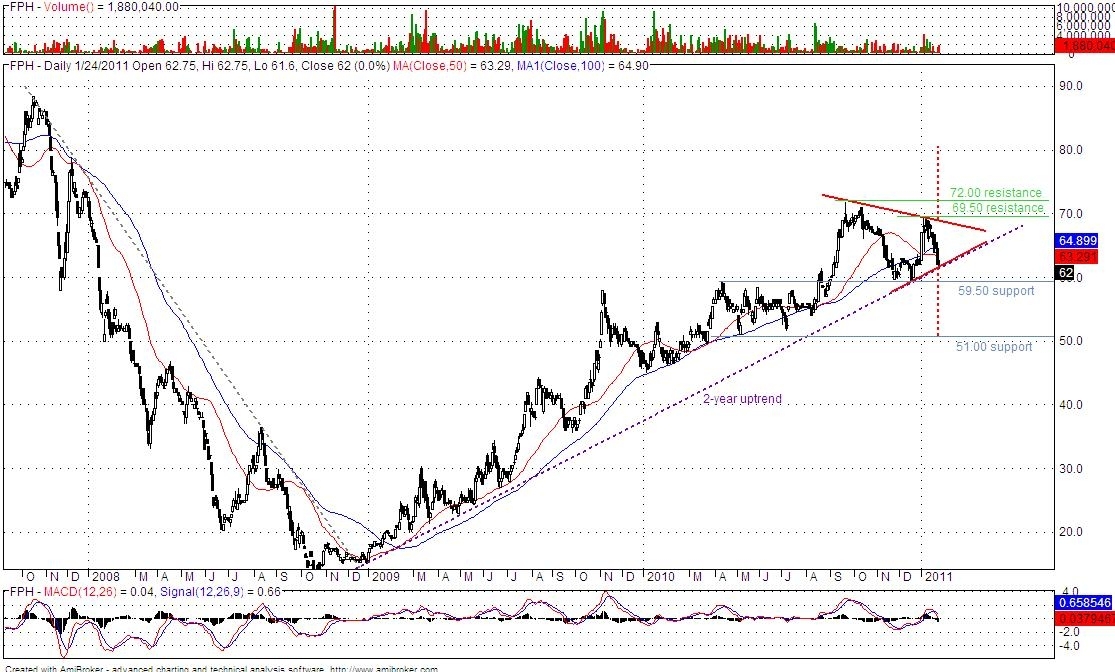
Technically, the shares of FPH remain on a longer term uptrend despite their recent fall. Today, FPH closed right above its 2-year uptrend. And if you look closely, FPH could be forming symmetrical triangle pattern which has been four months in the making. Now, a successful rebound from the major uptrend could propel the stocks higher and increase its chance of breaking out from the said pattern. The chances of this happening is actually greater since the symmetrical triangle is coming off an uptrend. So in case it breaks out to the upside, it could reach the PHP 80.00 target price. I got this by getting the size of the triangle’s base and added it to the possible breakout point. However, it first needs to clear out the PHP 69.50 and PHP 72.00 resistances. On the bearish note, if the 2-year trend and the symmetrical triangle’s support get breached, the stocks could fall towards a downside target price of PHP 51.00. Before it reaches that, though, it first needs to break the immediate support at PHP 59.15. In the near term, bias on FPH could be bullish since the MACD is still above the positive territory. But with the stocks currently moving below the 50 and 100-period moving averages, showing a sign of weakness, an unfortunate event of a breakdown could happen as mentioned. Better stay on your toes then!
More on LaidTrades.com…
FOREX: Large Currency Speculators turned long on the Euro, Pound against the US Dollar
By CountingPips.com
The latest Commitments of Traders (COT) report, released on Friday by the Commodity Futures Trading Commission (CFTC), showed that futures speculators added to their short positions of the US dollar against the other major currencies while turning to long positions for the euro and the British pound sterling. Non-commercial futures positions, those taken by hedge funds and large speculators, were overall net short the US dollar by $15.06 billion against other major currencies as of January 11th. This is a rise from the total short position of $7.38 billion on January 11th, according to the CFTC data and calculations by Reuters which calculates the dollar positions against the euro, British pound, Japanese yen, Australian dollar, Canadian dollar and the Swiss franc.
EuroFx: Currency speculators had a net long position in the euro against the U.S. dollar for the first time since November 23rd with a total of 4,109 long positions on January 18th. This is a sharp turnaround for euro positions that were short by 45,182 contracts on January 11th and coincided with last week’s rise in the spot forex market for the euro.

The COT report is published every Friday by the Commodity Futures Trading Commission (CFTC) and shows futures positions as of the previous Tuesday. It can be a useful tool for traders to gauge investor sentiment and to look for potential changes in the direction of a currency or commodity. Each currency contract is a quote for that currency directly against the U.S. dollar, where as a net short amount of contracts means that more speculators are betting that currency to fall against the dollar and net long position expect that currency to rise versus the dollar.
GBP: Speculators had net long British pound sterling positions on January 18th for the first time since November 30th. Pound sterling contracts rose to a total of 5,794 long positions after totaling 5,090 short positions as of January 11th.

JPY: The Japanese yen net long contracts decreased for second straight week as of January 18th to a total of 20,529 long contracts. Yen positions had totaled 24,736 net long contracts reported on January 11th.

CHF: Swiss franc long positions edged lower for a second straight week to a total of 6,992 long contracts as of January 18th after totaling a net of 10,818 long contracts on January 11th. This marks the lowest level in Swiss franc long positions since July 27th, 2010.

CAD: The Canadian dollar positions edged lower after three consecutive weeks of rises. CAD long positions registered 44,055 contracts after totaling 47,757 net longs on January 11th. Last week marked the highest level for Canadian dollar contracts since May 11th 2010.

AUD: The Australian dollar long positions were virtually unchanged from the previous week. AUD contracts totaled a net amount of 53,508 long contracts as of January 18th from 53,497 long contracts on January 11th.

NZD: New Zealand dollar futures positions edged higher to a total of 11,247 long positions as of January 18th. NZD large speculator long positions had dipped the previous week to a total of 9,620 long contracts on January 11th.

MXN: Mexican peso long contracts rose higher as of January 18th to 90,202 net long positions after totaling 83,572 longs the week prior on January 11th.

COT Data Summary as of January 18th, 2011
Large Speculators Net Positions vs. the US Dollar
Euro: +4,109
British pound sterling: +5,794
Japanese yen: +20,529
Swiss franc: +6,992
Canadian dollar: +44,055
Australian dollar: +53,508
New Zealand dollar: +11,247
Mexican peso: +90,202
Go to the Commitment of Traders CME raw futures data
Further COT Resources from around the web:
Hawkish Comments by Trichet Support Euro Strength
Source: ForexYard
An interview over the weekend with European Central Bank President (ECB) Jean-Claude-Trichet highlights what many traders already suspect; the ECB will not hesitate to fight euro zone inflation.
Economic News
USD – Dollar Begins Week on its Back Foot
At the end of the trading week the greenback was trading lower against the majors. Broad based selling of the dollar was seen with the greenback down following differentiating interest rate expectations between the US and the rest of Europe. Rising inflationary pressures in both the EU and in Britain may force those respective central banks to raise their benchmark interest rates to fight off rising inflation.
US inflationary pressures are considerably less as the Federal Reserve continues with the loosening of monetary policy. The Fed has given no signal of its intention to abandon its quantitative easing program and looks to complete the purchase of $600 billion worth of treasury bonds.
The dollar could continue to decline this week if momentum carries short dollar positions further. The key events for the dollar will be Tuesday’s release of consumer confidence numbers, Wednesday’s Federal Reserve Open Market Committee meeting, and Friday’s Advanced GDP data for the 4Q 2010.
EUR – Hawkish Comments by Trichet Support Euro Strength
In a Wall Street Journal interview, European Central Bank President Jean-Claude Trichet talked up the ECB’s intention to fight inflation despite disparities in growth rates between central Europe and the peripheral states.
Trichet was adamant in his hawkish view on inflation and vowed to battle inflationary pressures. Last month the rate of inflation in the EU rose a surprising 2.2%. This was the first time in two years that the rate of inflation was greater than the ECB target inflation rate of 2.0%.
The ECB President stressed the ECB is determined to fight inflation attributed to rising commodity and food prices. Trichet also supported budgetary constraints and fiscal discipline in the EU nations, suggesting oversight for EU nations in keeping with enacted austerity measures. He does not see risks of an economic downturn due to sovereign budget cuts.
The euro received strong bids this past week, both against the dollar and versus the Swiss franc as interest rate expectations increased between Europe and the rest of the world. Further hawkish comments from the ECB should be supportive of the euro into the new week of trading.
While the event occurred over two years ago, traders should not forget the interest rate hike by the ECB in July of 2008, only a few months prior to the demise of Lehman Brothers. This should underpin Trichet’s commitment to eliminating inflation in the EU. As such, traders should take note when the ECB President addresses the markets.
JPY – Downtrend Resumes for USD/JPY
Recent price action in the pair hints at a continuation of the long term downtrend. Following a new year’s rally with the price of the USD/JPY climbing to 83.70, the pair has begun a new decent with last week’s low coming in at 81.80.
Renewed strength in the yen could spark another round of market intervention by the Japanese Ministry of Finance (MOF). In mid-September the MOF intervened in the FX market in order to weaken the Japanese yen.
As the JPY continues to strengthen, traders should consider the MOF may intervene again should the yen push to new highs. A mark for traders to watch could be sustained selling of the USD/JPY below the 82 level.
Tuesday’s meeting by the Bank of Japan and the accompanying monetary policy statement may offer harsh rhetoric for those FX traders that are intent on testing the will of Japanese policy makers to once again intervene in the foreign exchange market.
Crude Oil – Crude Prices Recover from Thursday’s Decline
Last week the price of spot crude oil reached a 2.5 year high but finished the week lower. An improving global economy along with positive economic sentiment is driving commodity prices higher.
However, higher reported GDP numbers from China increases expectations of future monetary policy moves by China in order to stem the flow of inflation. Any tightening of Chinese monetary policy may limit growth rates as well as demand for commodities.
Crude oil prices stabilized on Friday following a sharp decline of 2.75% on Thursday. This may present a buying opportunity in crude oil as the price approaches the $87.20 support level as well as the rising trend line from the August low that comes in today at the same price.
Technical News
EUR/USD
Friday’s candlestick ended with a shaved head, indicating that momentum is to the upside. As such, traders should expect further gains in the pair with a target near the 61.8% Fibonacci retracement level from the November to January move. This level coincides with the resistance level from October at 1.3740.
GBP/USD
Since New Years the pair has booked impressive gains, climbing from a low of 1.5340 to last week’s high at 1.6060. The pair appears to be taking support from the 10-day exponential moving average which comes in today at 1.5885. This may be an appropriate level to place an entry limit buy order.
USD/JPY
On Thursday the pair found resistance at the 55-day moving average, an indicator that has shown in the past its ability to act as a support or resistance level. This level comes in today at 83.10. Support for the pair is found at last week’s low at 81.80.
USD/CHF
The downtrend in the pair continues with the price retracing a full 61.8% of the December move, and then abruptly turning lower. Traders should be short on the pair with a first support level at 0.9520. Resistance comes in at 0.9685 and 0.9780.
The Wild Card
Gold
After completing a head and shoulders pattern last week with a breach below the rising neck line that runs under the October – January lows, the commodity appears to be reverting back towards the neck line. This may give forex traders another opportunity to enter short if the price reaches the neckline today at $1,360.
Forex Market Analysis provided by ForexYard.
© 2006 by FxYard Ltd
Disclaimer: Trading Foreign Exchange carries a high level of risk and may not be suitable for all investors. There is a possibility that you could sustain a loss of all of your investment and therefore you should not invest money that you cannot afford to lose. You should be aware of all the risks associated with Foreign Exchange trading.
EUR/CAD Set for Downward Correction
By Dan Eduard
The EUR/CAD pair has seen substantial bullish momentum as of late, moving up over 400 pips in the last week alone. Technical indicators are now showing that a downward correction is likely to occur in the near future, proving forex traders with an excellent opportunity to open up short positions for potentially significant profits.
We will be looking at the 8-hour EUR/CAD chart provided by ForexYard. The technical indicators being analyzed are the Moving Average, Williams Percent Range, Stochastic Slow and Relative Strength Index.
1. The pair is currently hovering right below its Moving Average. Any further movement below the Moving Average line would signal an impending bearish move.
2. The Williams Percent Range is currently at the -10 level, which is generally considered to be well into the overbought area.
3. A bearish cross has formed on the Slow Stochastic, indicating a downward reversal is likely to occur in the very near future.
4. Finally, the Relative Strength Index is currently at 80, well above what is considered to be overbought. Traders are advised to open short positions before the downward breach occurs.

Forex Market Analysis provided by ForexYard.
© 2006 by FxYard Ltd
Disclaimer: Trading Foreign Exchange carries a high level of risk and may not be suitable for all investors. There is a possibility that you could sustain a loss of all of your investment and therefore you should not invest money that you cannot afford to lose. You should be aware of all the risks associated with Foreign Exchange trading.
The State of the Markets – My Trading Analysis & Predictions
By David Bansiter, ActiveTradingPartner.com
I’ve been forecasting a Mid January top in the SP 500 (Us Markets) for multiple weeks now well in advance. My work had looked for 1285 as a minimal upside rally from the 1173 4th wave lows. The range was 1285-1315, we have been to 1296 but that pretty much should have capped off the rally. Here are some further thoughts:
Copper, Gold, Silver- All topping and rolling over for now. A few weeks ago I began to go bearish on Gold (And with it of course Silver), and the Elliott Wave patterns became very muddy and unclear. This was a warning signal. Also, the inability of Gold to pierce through the 1425-30 highs for a 3rd attempt indicated a triple top failure which I eluded to in an Email bulletin a few weeks back. The Gold, Copper, Silver topping and rollover movements are warning signals to be more cautious. Gold should work down to 1270-1280 eventually, and Silver to 25-26.50 ranges likely.
Small Cap Index- The TZA ETF I suggested on TMTF recently had a huge 2 day reversal rally on Thursday and Friday of this trading week. TZA Closed just over 16 and I see it moving to 19-20. We are long also in my ATP advisory service for insurance and gains potential. The Russell 2000 is rolling over first, which makes sense because the sentiment and strong economic rebound from the summer lows has peaked out. Small Caps are likely to correct the hardest in this wave pattern down, and so we shorted them instead of shorting the large caps or SP 500. To wit, this week the small caps dropped 3.5% and the SP 500 only 0.8%.
IBD 100- The Investors Business Daily top 100 fell 5.4% this week collectively. A quick scan of the charts on those 100 reveals a lot of topping and weakness patterns to me. These would be considered leader small cap and mid cap growth stocks, and suggests further evidence of continuing correction in the markets.
Elliott Wave theory is scoffed at by many investors because they have been led to believe that Robert Prechter is apparently the only person on earth who has a license to use them. I’ll reserve my comments on his abilities, but you can gather that I tend to often disagree with his views and leave it at that. EWT works extremely well in the right hands, and that is why I launched TMTF last year, to share my views and my methods. This has allowed me to confirm summer bottoms at 1040 this year based on the movement from 1120 to 1040 (Which we also forecast). This allowed me to call a top on November 5th at 1225 after going just over my 1220 predictions made weeks in advance. This allowed me to call a bottom 4th wave at 1173-75 and a resulting rally to 1285 in advance. Not to mention April 2010 and January 2010 tops within days. Still think EWT is bunk? Try ignoring those who are biased and trade their biases. I dont trade Gold, Silver, or the SP 500 futures or indexes… that allows me to remain 100% objective and not force wave counts into my personal opinions.
EWT is not perfect, but nor is any forecasting methodology or technical analysis strategy. They all have their flaws. However, I try to blend in a few elements to back up my EW forecasts, so as to eliminate too many mistakes. Sentiment readings for one, and Fibonacci sequences for another.
Bottom line: I continue to be cautious on the markets and believe the SP 500 will drop to 1170-1180 on the LOW END, with 1210-1229 possible as the shallower end of a correction. The Russell 2000 will take the hardest hit, and probably has another 8-9% downside left before a bottom pivot. We remain long TZA to short that index at 3x multiple over at my ATP service. I have not shorted the SP 500 or large Caps on purpose, because I think the best place to short is small caps. I continue to recommend high cash positions for now (Im about 40%) so that you have money to buy into an oversold wave 2 bottom in the markets when it occurs. Gold will continue to correct with a bounce at 1310-1320 areas likely. I see it getting to 1270-1280 though as most likely.
Large Caps are likely to outperform small caps in 2011, as the bulk of the economic trough and rebound have now occurred and been priced in. Gold may struggle for several months but has a shot at hitting $1500-$1515 by years end, but one month at a time. That said, selective stock picking will always have the ability to trounce the index averages, and that is what I do over at ATP (ActiveTradingPartners.com).
Stay tuned.
If you would like to benefit from learning more about my methods, which have been historically accurate, please check us out at www.activetradingpartner.com There is a coupon available if you’d like to subscribe and save $150 just email me at [email protected] or you can sign up for free occasional reports.
David Bansiter
Weekly Forecast: USD to Pare Losses this Week?
By Greg Holden
The US dollar’s mixed results last week, on a fundamental level, may be broken down to a shift in risk appetite and consumer confidence. From a technical standpoint, the movement looks like a consolidating retracement against most of its rivals in anticipation of this week’s news.
Here is a breakdown of this week’s events to give you an idea of how the US dollar will be affected in the days ahead.
Tuesday:
9:30 GMT: GBP – Prelim GDP; Public Sector Net Borrowing
– Both the US dollar (USD) and British pound (GBP) are expecting intense volatility this week, kicking off Tuesday with these two highly impacting reports from Great Britain. Gross Domestic Product (GDP) data tends to create a period of portfolio adjustment by large investors and banks while net borrowing figures represent debt and spending levels in the public sector. Traders should anticipate some intense volatility during this time.
15:00 GMT: USD – CB Consumer Confidence
– Traders experienced last week what a shift in confidence can do to safe havens and higher yielding assets. The EUR rebounded last week against the USD as higher optimism allowed for a move into riskier assets. If today’s consumer confidence shows growing optimism in the United States we could see last week’s trend reverse, but the give-and-take between these two will certainly create intense volatility in the minutes after this publication.
Wednesday:
19:15 GMT: USD – Federal Funds Rate and FOMC Statement
– The Federal Open Market Committee (FOMC) will be releasing a statement about the latest round of interest rate decisions by the Federal Reserve Board on Wednesday evening. Interest rates are expected to remain near 0% for the foreseeable future, but the statement released by the FOMC has the potential to hint at future decisions and speculators take that time to adjust their positions simultaneously, boosting liquidity and potentially shifting the trends of the USD against its currency rivals.
Thursday:
13:30 GMT: USD – Core Durable Goods Orders
– Durable goods orders represents the level of percent change in demand for manufactured goods in the United States. Any decline in manufacturing tends to push the US dollar downward as it signals fewer investors purchasing the greenback in order to buy American goods. If the figure comes in at 0.9% as expected, a decline from last month’s reading, traders may anticipate a bearish USD immediately after it’s publication.
13:30 GMT: USD – Unemployment Claims
– The weekly unemployment claims doesn’t usually have a significant impact on the USD unless the figure is remarkably different than expectations. This week’s report is forecast to remain more or less unchanged from last week’s, meaning the potential for a shocking release is greater than normal. Traders should expect high volatilty on Thursday.
Friday:
10:00 GMT: CHF – KOF Economic Barometer
– The Swiss Konjunkturbarometer (KOF) is a combined reading of twelve economic indicators related to banking confidence, production, new orders, consumer confidence and housing in Switzerland. It is perhaps the most significant report released by the Swiss regarding their economy and tends to have a great impact on the Swiss franc. This month’s reading is expected to have increased from last month’s, suggesting a continuation of the franc’s bullish behavior.
13:30 GMT: USD – Advance GDP
– As with the British Prelim GDP released earlier in the week, the American Advance GDP tends to greatly shift investor portfolios leading to significant swings in USD values. This reading of the American GDP is expected to reveal 3.5% growth in value for American goods, adjusted for inflation, in an annualized format. Meaning, if the data comes in line with expectations, dollar values may increase as it may greatly boost investor appetite for US goods and services.
What to expect:
Last week’s movement among USD pairs and crosses may end up being determined as the beginning of a short-term consolidation pattern since this week’s news is set to effect the greenback heavily. Most reports seem to suggest relative calm, and perhaps even growth, for the US economy. This suggests that, if last week’s movements were in fact a consolidation pattern, this week’s movements may actually see the greenback recovering its losses and shifting back into a bullish posture. Traders should be anticipating the tip of the consolidation trend and the impending reversal.
Forex Market Analysis provided by ForexYard.
© 2006 by FxYard Ltd
Disclaimer: Trading Foreign Exchange carries a high level of risk and may not be suitable for all investors. There is a possibility that you could sustain a loss of all of your investment and therefore you should not invest money that you cannot afford to lose. You should be aware of all the risks associated with Foreign Exchange trading.
UK Household Finances Hit Lowest Since 2009
In Brief
British households are more pessimistic about their finances now than at any time since April 2009, according to Markit.
More UK businesses face financial woes than at any time in two years, according to Begbies Traynor.
The Spanish Government’s moves to speed up restructuring its banking sector have been received well on the markets.
In Depth
GB
According to research group Markit, British households are more pessimistic about their finances now than any time since April 2009. The group’s Household Finance Index for January came in at 36.1 – compared to 39.9 last month. The chief reasons include inflation and the recent VAT rise.
Furthermore, more businesses are in financial trouble than any number since 2009, according to insolvency specialist Begbies Traynor. 147, 836 businesses face financial woes this quarter – a 4% increase on the same period two years ago – according to a newly released report. This could slow GDP growth for Q4 2010 to as little as 0.2%.
Finally, Deputy Prime Minister Nick Clegg is talking about breaking up the banks into savings and investment firms this morning. His intention is to protect the public from bailing out the banks should another recession occur. However, his actions could be taken as meddling by bank executives, and sour feeling in the finance sector to the UK.
EU
The euro has been faring well since 2011 began – certainly compared to last year. Last week for instance, EU leaders moved closer to increasing the size the EFSF bailout fund, while the week before Spain and Portugal held successful bond auctions. These indicate that foreign investors have confidence these indebted nations can repair their finances.
This streak of good news continues this Monday morning. For instance, the Spanish Government has signalled that it is speeding up restructuring its regional banks. These banks – unlike Spain’s national banks – lent too freely before the recession, and so took the brunt of the collapse. Hence the Government’s move has been received well on the markets.
In addition, this morning new German and European PMI (Purchasing Manager’s Index) figures have been released. These report business conditions in the manufacturing and services sectors. The latest report shows that conditions in the German and European manufacturing sectors slowed slightly in January, but increased in the services sectors.
Coming Up
The Bank of England MPC (monetary policy committee) releases minutes of their latest meeting on Wednesday. Interest rates stayed the same, but any change in the rhetoric of committee members could impact on sterling sentiment.
By Peter Lavelle with best currency broker Pure FX.
What Is The Best Time Of The Day To Trade Forex?
By James Woolley
The forex markets are open 24 hours a day between Monday and Friday which means that anyone in the world can conveniently trade at some point during the day. However, some times are more volatile and profitable than others.
The most volatile period of the day is between 1.30 and 4.30pm UK time which is around the time that US traders start trading the markets. More significant is the fact that a lot of economic data releases are announced during this period, which can cause dramatic swings and increased volatility in the currency markets, particularly the dollar-related pairs.
However although volatility is good to an extent, it’s not necessarily the best time to trade because these announcements can cause wild and unpredictable swings which generally does not equate to profits. The resulting move in the more significant of the data releases will often counteract conventional technical analysis as well making it extremely difficult to make any profits.
The only people to benefit from trading during this period are the tiny minority of news traders who are capable of benefiting from such swings.
For most of us the ideal time to trade is when you get large market moves and trends that are more predictable, conform well to technical analysis, and is during a time when there are no major economic news announcements scheduled.
Luckily such a period does exist and it is basically the start of the European trading session between 8.00 and 12.00 (or you could even say 6.00-12.00 because you often get strong moves from 6.00 onwards).
This is an excellent time to trade because it’s the most heavily traded session, so you get decent sized moves, and it’s generally free of any market-moving announcements so you can concentrate fully on technical analysis.
Unfortunately not everyone around the world can trade during this time due to time differences and the inconvenience of trading at an awkward time of the day, so for those people the next best time to trade is during the Asian session. The Yen related pairs in particular are the best pairs to trade during the Asian session, as you would imagine, as the other major pairs are extremely quiet during this time of the day.
So in conclusion, the best time of the day to trade the forex markets in my experience is the start of the European trading session where you get large swings and few market-moving announcements to contend with. If you’re trading the major currency pairs, you will find that the other times of the day are either too quiet or too volatile, unless you’re trading Yen pairs which move strongly during the Asian trading session.
About the Author
James Woolley runs a blog offering tips and strategies related to forex currency trading and a review of Forex Trading Machine
Investing Magazine Subscriptions – Are They Value For Money?
By James Woolley
You will often see investing magazines on the shelves in your local newsagent, and they do seem to be quite popular with stock market traders and investors. I used to buy them myself in the past, but nowadays I don’t bother with them at all. So are they really that useful?
Well let me discuss some of the positives first of all. One of the major selling points is that they will often have some really good informative and educational articles. Every month they will often choose a topic and write a feature article on this subject, which may be two to five pages long, for instance.
So they may write feature articles about options trading, or they may discuss the 10 most undervalued stocks in the FTSE 100, for example. One thing you can guarantee is that these feature articles will nearly always be a very good read.
Another thing I like about share trading magazines is that they will often discuss individual stocks that you may not otherwise have come across. They will often pick out a few small-cap stocks that are worth keeping an eye on, and these can turn out to be great investments. Of course you shouldn’t buy stocks on the back of a recommendation. You should always do your own research as well.
These magazines also tend to have good coverage of the latest company results. This can be useful because you can scan through them and find out which companies are performing very well, and are therefore worth adding to your shortlist of possible investments.
Those are the positives, but there are also several things I don’t like about investing magazines. Firstly you always have to bear in mind that the people writing the articles about various different stocks are journalists first and foremost, so you have to be very wary about listening to any recommendations. If they were highly skilled investors, then they would probably be working in the city for a major investment bank, or trading their own money.
Another thing to bear in mind is that they will often brag about the share predictions that they got right. This encourages inexperienced investors to start blindly following future tips, which will often lead to disappointment, because they will rarely mention the numerous recommendations that turned out badly.
So as you can see, investment magazines have their good points and their bad points. Ultimately it is up to you whether or not you buy them every month. They are very often quite a good read, but you should always be careful about following any of their recommendations.
About the Author
Click here to read a review of Zecco, the online stock broker that offers free trades, and to read a full TradeKing review.