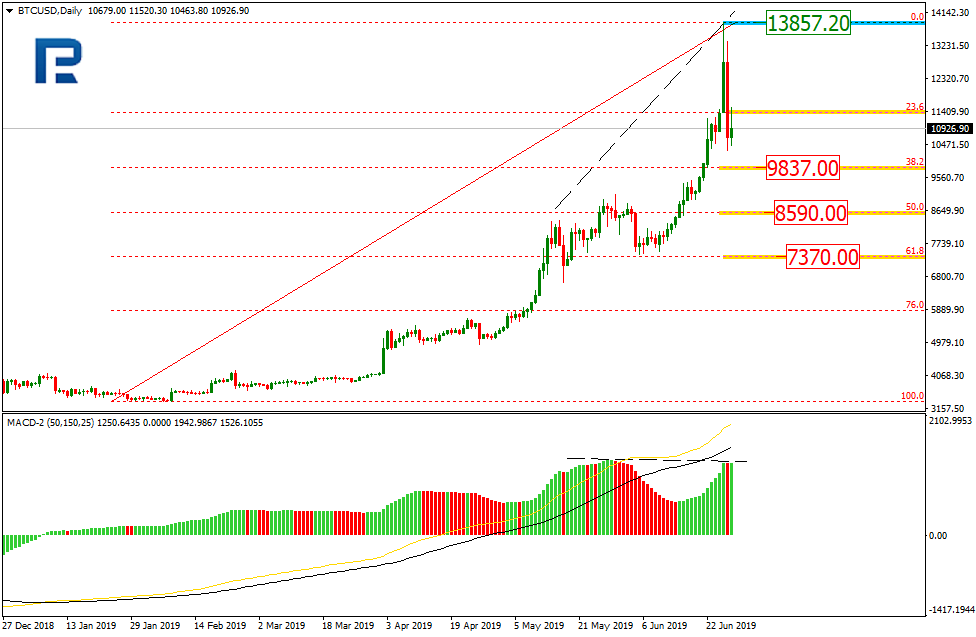
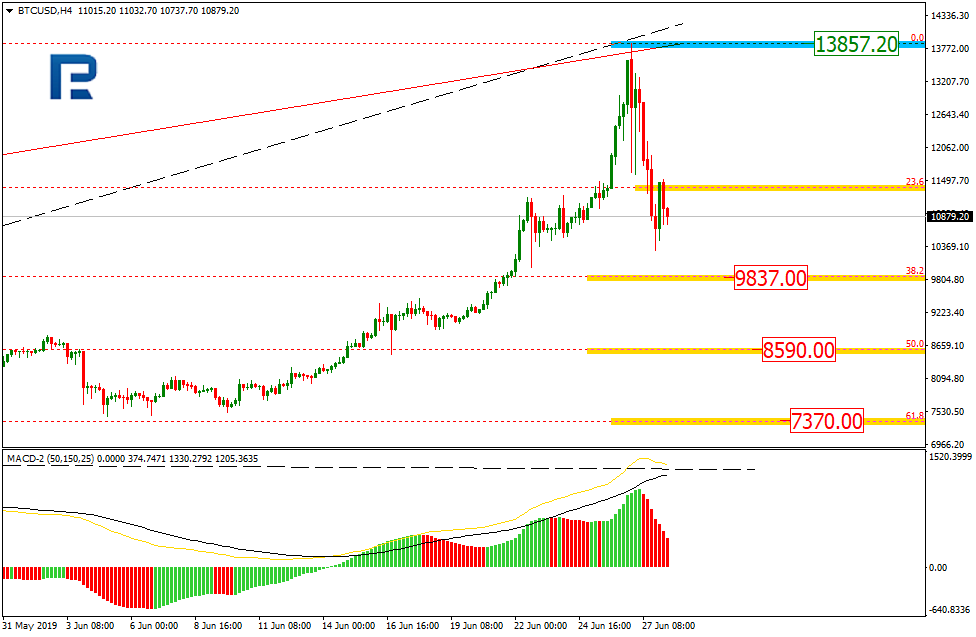
As we can see in the daily chart, there was a divergence on MACD, which made BTCUSD reverse at 13857.20 and start a new decline. This decline may be considered as a correction, which may be followed by a new rising wave. The current descending impulse has already broken 23.6% fibo and may continue falling towards 38.2%, 50.0%, and 61.8% fibo at 9837.00, 8590.00, and 7370.00 respectively. The resistance is the high at 13857.20.
The H4 chart shows more detailed structure of the current movement.
ETHUSD, “Ethereum vs. US Dollar”
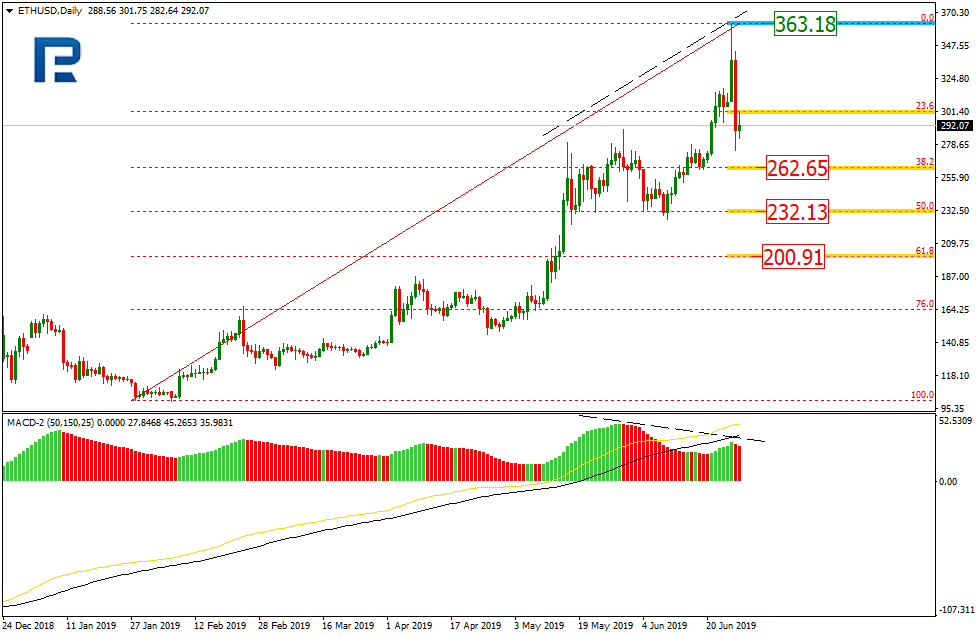
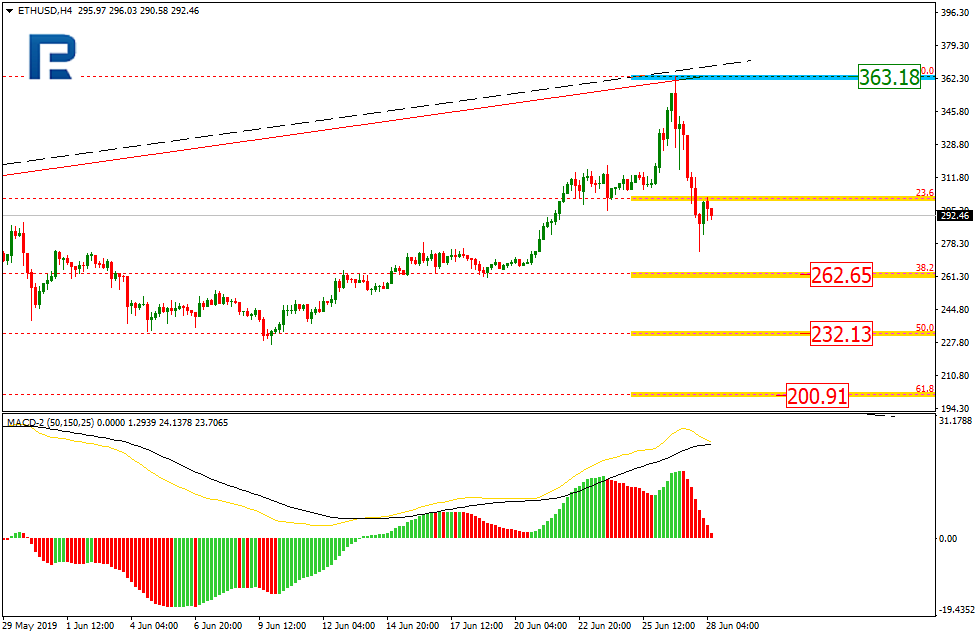
As we can see in the daily chart, there was a divergence on MACD, which made ETHUSD start moving downwards. The resistance is the high at 363.18. The current decline is heading towards 38.2%, 50.0%, and 61.8% fibo at 262.65, 232.13, and 200.91 respectively.
In the H4 chart, the pair is getting back to 23.6% fibo 262.65.
Attention! Forecasts presented in this section only reflect the author’s private opinion and should not be considered as guidance for trading. RoboForex LP bears no responsibility for trading results based on trading recommendations described in these analytical reviews.
It’s been a frustrating week for gold traders. After price broke out to the highest levels since 2013, moving above the 1432.21 multi-year high, the market has since reversed and traded back below the level.
The driver behind the upside move earlier in the week was the fresh escalation in tensions between the US and Iran. Following the downing of a US spy plane by Iran last week, the US imposed fresh sanctions on Iran on Monday.
These sanctions took the place of an aborted airstrike. President Trump mainly aimed them at Iran’s supreme leader, as well as a range of senior military figures. While the canceling of a US airstrike last week was met with short term relief, the sanctions have kept the threat of future military action alive.
On Tuesday, tensions flared further as Iranian president Rouhani verbally attacked Trump, suggesting the US President has a “mental disorder”, labeling his sanctions “ridiculous and outrageous”. For now, there have been no further acts of aggression by Iran, though the threat of a sudden outbreak of conflict is keeping gold safe-haven flows supported.
Weakness in US data over the week has also kept USD pressured with durable goods, trade balance and GDP all coming in below expectations. The data further endorses the view that the Fed is likely to ease over the coming months, which should keep gold prices supported in the medium term.
XAUUSD continues to trade within the large bullish channel and is currently challenging the 2013 1432.21 base which has been in play over the last six years. Momentum indicators are supporting the move currently with no signs of divergence. If price remains supported above 1366.09, further upside is likely. Only a break below the 1366.09 will change the near term bullish bias.
Silver
Silver prices have had a slightly tougher time than their golden counterpart this week. While gold has conceded some of the gains made earlier in the week, silver prices have reversed fully to end the week in the red. Despite the pullback this week, the prospect of a lower USD as Fed easing expectations grow, as well as higher gold prices, should keep silver supported over the medium term.
The recent rally in silver prices has stalled just ahead of testing the 15.6329 resistance level. Momentum has stalled this week with price printing an inside week, presenting the risk of a further reversal lower next week. Above the 15.6329 level, the next challenge will be the long-term bearish trend line, a break of which could signal the start of a much broader recovery higher. To the downside, 14.9161 remains the key support level to watch as a medium-term pivot. While above here, focus remains on further upside. Below here, and focus will shift to the 2018 lows around 14.3321.
The EUR/USD stabilized after a rather long rally. The trading instrument is consolidating. Local levels of support and resistance are 1.13400 and 1.13750. Concerns about an aggressive reduction in interest rates (by 50 basis points) dropped significantly after the comments of Fed Chairman Jerome Powell on Tuesday. At the same time, more than 75% of financial market participants believe that the regulator will reduce the range of key interest rate by 25 basis points to 2.00% -2.25% at a meeting in July. Investors took a wait-and-see stance before the G20 summit, at which the leaders of the United States and China should once again discuss trade disputes. Recall that the G20 summit will be held in Osaka from 28 to 29 June. Today we recommend to pay attention to economic releases from the USA. Positions must be opened from key levels.
The Economic News Feed for 27.06.2019:
– GDP report (US) – 15:30 (GMT+3:00);
– Unfinished Real Estate Sales Index (US) – 17:00 (GMT+3:00);
The indicators do not provide precise signals, the price has crossed 50 MA and 100 MA.
The MACD histogram is close to 0.
The Stochastic Oscillator is in the oversold zone, the %K line is crossing the %D line. There are no signals at the moment.
Trading recommendations
Support levels: 1.13400, 1.13100, 1.12700
Resistance levels: 1.13750, 1.14100, 1.14500
If the price fixes below 1.13400, expect further correction towards 1.13100-1.12800.
Alternatively, the quotes can grow towards 1.14100-1.14400.
The GBP/USD currency pair
Technical indicators of the currency pair:
Prev Open: 1.26861
Open: 1.26840
% chg. over the last day: -0.02
Day’s range: 1.26743 – 1.26973
52 wk range: 1.2438 – 1.3631
An ambiguous technical picture emerged on the GBP/USD currency pair. Streling is trading in a flat. GBP/USD quotes test local support and resistance levels: 1.26650 and 1.27150, respectively. Boris Johnson, the main contender for the post of Prime Minister of the United Kingdom, said that he was “serious” about withdrawing Britain from the EU by October 31 without concluding a deal if the block refuses to negotiate a new withdrawal agreement. We recommend to keep track of current information on the issue of Brexit. The trading instrument has the potential for further correction. Positions must be opened from key levels.
The Economic News Feed for 27.06.2019 is calm.
The indicators do not provide precise signals, 50 MA has crossed 100 MA.
The MACD histogram is close to 0.
The Stochastic Oscillator is in the neutral zone, the %K line is crossing the %D line. There are no signals.
Trading recommendations
Support levels: 1.26650, 1.26400, 1.26000
Resistance levels: 1.27150, 1.27600, 1.27850
If the price fixes below 1.26650, expect further correction towards 1.26300-1.26000.
Alternatively, the quotes can grow towards 1.27500-1.27700.
The USD/CAD currency pair
Technical indicators of the currency pair:
Prev Open: 1.31687
Open: 1.31258
% chg. over the last day: -0.37
Day’s range: 1.31173 – 1.31380
52 wk range: 1.2727 – 1.3664
The USD/CAD has once again moved to a decline. Yesterday, the drop in quotes exceeded 50 points, CAD updated the key lows. At the moment, the trading instrument is consolidating. The quotes found support at 1.31100. Mark 1.31600 is already a “mirror” resistance. The pair has the potential to decline further. Additional support for the Canadian dollar is caused by a positive trend in prices for oil. Open positions from key levels.
The Economic News Feed for 27.06.2019:
The price fixed below 50 MA and 100 MA which points to the power of the sellers.
The MACD histogram is in the negative zone but above the signal line which gives a weak signal to sell USD/CAD.
The Stochastic Oscillator is in the overbought zone, the %K line is crossing the %D line. There are no signals.
Trading recommendations
Support levels: 1.31100, 1.31000, 1.30600
Resistance levels: 1.31600, 1.32000, 1.32250
If the price fixed below 1.31100, expect further descend towards 1.30800-1.30600.
Alternatively, the quotes can correct towards 1.32000-1.32250.
The USD/JPY currency pair
Technical indicators of the currency pair:
Prev Open: 107.170
Open: 107.776
% chg. over the last day: +0.52
Day’s range: 107.647 – 108.132
52 wk range: 104.97 – 114.56
The USD / JPY currency pair shows a positive trend. The trading instrument has updated local maxima. At the moment, the quotes are testing the key resistance level of 108.100. 107.750 is already a “mirror” support. The USD/JPY currency pair has the potential for further recovery. We recommend to pay attention to economic releases from the United States. Positions must be opened from key levels.
The Economic News Feed for 27.06.2019 is calm.
The price fixed above 50 MA and 100 MA which points to the power of the buyers.
The MACD histogram is in the positive zone and abov the signal line which gives a strong signal to buy USD/JPY.
The Stochastic Oscillator is in the overbought zone, the %K line is crossing the %D line. There are no signals.
Trading recommendations
Support levels: 107.750, 107.500, 107.100
Resistance levels: 108.100, 108.450, 108.700
If the price fixes above 108.100, expect further growth towards 108.400-108.600.
Alternatively, the quotes can fall towards 107.500-107.300.
The US dollar shows mixed results against a basket of world currencies. Investors have taken a wait-and-see attitude before the G20 summit in Japan, which will start tomorrow. Financial market participants are counting on a breakthrough in the US-China trade relations. The US currency was supported by statements by US Treasury Secretary, Steven Mnuchin, that the US-China trade agreement was almost 100% done, and he believed that negotiations between Donald Trump and Xi Jinping in Japan would succeed. The US dollar index (#DX) closed yesterday in a positive zone (+0.08%).
Trump and Xi Jinping should meet on Saturday at the G20 summit. The result of this meeting will affect not only the world economy but also all financial markets that have been suspended for the last two years. According to the South China Morning Post, the United States and China intend to declare a truce in the trade war ahead of the G20 summit to resolve disputes during the meeting. The condition for holding a meeting between Xi Jinping and Donald Trump in Osaka was to delay the imposition of additional duties by the United States on Chinese goods.
The “black gold” prices have been declining after a significant increase the day before. At the moment, futures for the WTI crude oil are testing the mark of $59.00 per barrel.
Market Indicators
Yesterday, there was a variety of trends in the US stock market: #SPY (-0.10%), #DIA (-0.02%), #QQQ (+0.47%).
The 10-year US government bonds yield has been growing. Currently, the indicator is at the level of 2.06-2.07%.
The news feed on 2019.06.27:
– Data on US GDP at 15:30 (GMT+3:00); – Pending home sales in the US at 17:00 (GMT+3:00).
It has been a busy week as far as economic data from Canada is concerned. Over the past weeks, economic data from Canada included the monthly inflation figures for May.
Official data from Statistics Canada saw inflation rising more than expected in May. Headline inflation jumped 0.4% on the month, beating estimatesof a 0.1% increase. On a year over year basis, inflation rose 2.4%, up from 2.0% in April.
Canada GDP, March 2019 – 0.5% (M/m)
This week, the monthly gross domestic product will be coming out. The GDP data covers the month of April. Estimates point to a slower pace of increase of just 0.2% on the month. This follows the 0.5% gain seen in March.
In the first quarter, Canada’s GDP growth rate was rose by 1.3% compared to the same period a year ago. It was a slower pace of growth for the second consecutive quarter. This week’s data for the month of April will show how the economy fared during the first period of the second quarter.
The Bank of Canada had already signaled a soft growth patch in the first quarter but sounded optimistic that growth would pick up during the second quarter.
Canada April GDP – Soft Growth Expected?
Going by the estimates, economists forecast a soft growth period during April. This comes as various economic reports for the month indicate a mixed picture.
Retail sales grew at a pace of 0.1%, rising to $5.1 billion during the month. This marked a third consecutive monthly gain. But excluding sales at gasoline stations and motor vehicle parts and dealers, retail sales were down 0.1%.
Sales increased in 7 out of 11 sub-sectors while retail sales in volume terms were down 0.2%. The biggest contributor to the headline retail sales report was sales as gasoline stores.
Sales increased 1.2% at gasoline stores but in terms of volume, gasoline sales were down 0.2%. There were also strong gains with sales at store retailers which jumped 2.8%, marking a second month of increase.
The soft patch of growth in April follows a strong 1.8% increase in core retail sales and 1.3% increase in headline retail sales during the previous month.
Manufacturing Sales Fall in April
While retail sales saw a modest increase, it was a different story with manufacturing sales. Data showed that manufacturing sales fell 0.6% to a seasonally adjusted $57.8 billion in the month of April.
The biggest declines which contributed to the overall fall in manufacturing sales came from transportation equipment and primary metal industries. When excluding manufacturing sales for the above two sectors, there was an increase of 0.8%.
Transportation equipment sales fell 6.7% and continued the decline for the fifth consecutive month. Motor vehicle sales fell by 8.9%. The declines are mostly attributed to the temporary shutting down of manufacturing plants during the period.
Trade Balance Figures Rise on Exports
When looking at the trade balance numbers for April, however, data saw an increase in Canada’s international merchandise trade.
Exports jumped 1.3% in April with gold exports rising dramatically during the period. A decline in imports to the tune of 1.4% due to lower aircraft orders helped to prop up the trade balance figures.
The merchandise trade deficit fell from $2.3 billion to $966 million in April. This was the lowest trade deficit by Canada since October 2018. In terms of volume, exports grew by 2.0% while imports fell by 1.9%.
The trade balance figures alongside the modest pick up in retail sales put the GDP data for April to surprise to the upside. However, the surprise factor could be limited.
In such a case, the markets will be automatically looking to see the Bank of Canada turn hawkish. The next BoC meeting is due on July 10th. While the central bank is not expected to hike rates on the back of the inflation and hopefully higher GDP growth, it could tweak its forward guidance.
On Thursday the 27th of June, trading on the euro closed at the same level as on Wednesday (1.1369). Trading on the euro was stable against the dollar throughout the day. I think the reason for this is the upcoming G20 summit along with a lack of remarks from Trump directed at China. A Chinese representative said that China is ready to conclude a balanced trade agreement with the US, although the US isn’t interested in this.
US President Donald Trump said that there’s a possibility of reaching a trade agreement with China during the meeting. There are rumours that there’s already a preliminary agreement in the works that will see China avoid tariffs on 300bn USD of Chinese goods.
Day’s news (GMT+3):
11:30 UK: current account (Q1).
15:30 Canada: GDP (Apr).
15:30 US: personal income (May), personal spending (May)
16:45 US: Chicago PMI (Jun).
17:00 US: Michigan consumer sentiment index (Jun).
17:30 Canada: Bank of Canada outlook survey.
20:00 US: Baker Hughes US oil rig count.
Current situation:
At the time of writing, the euro is trading at 1.1375. The bulls have broken the resistance and have set their sights on 1.1395. I can’t see the pair rising any further than the 45th degree given that traders are being cautious ahead of the G20 summit this weekend. Investors expect the US and China to agree to a truce in their trade conflict. However, uncertainty remains due top Trump’s volatility. In today’s forecast, I’m expecting the bulls to trigger the stop levels above 1.1376, 1.1391, and 1.1391. As soon as they’re triggered, we should see a drop to 1.1370.
As we go into the weekly close, we want to have a look at a currently very interesting currency pair: USD/JPY. The excitement results mainly out of the upcoming G20 summit where market participants hope to get clear signs in regards to a potential between the US and China.
Unfortunately, this is not shocking news, and was announced in a very similar way in April. We all know that shortly after the negotiations between the USA and China collapsed shortly after with US president Trump announcing a new round of tariffs on Chinese goods and putting Huawei on a blacklist.
That said, the initial bullish reaction in USD/JPY back towards and slightly above 108.00 on Wednesday/Thursday may be short-lived with the currency pair finding a potential short-trigger around 107.80/108.00 and taking on bearish momentum again.
If, over the weekend and during the G20 summit in Osaka/Japan, it appears that still no deal between the USA and China is coming, the path down to the Flash Crash lows from January around 105.00 seems levelled.
Technically this bearish outlook stays true as long as we trade below 108.70/109.00 on a daily time frame:
Source: Admiral Markets MT5 with MT5-SE Add-on USD/JPY Daily chart (between March 29, 2018, to June 27, 2019). Accessed: June 27, 2019, at 10:00pm GMT – Please note: Past performance is not a reliable indicator of future results, or future performance.
In 2014, the value of USD/JPY increased by 13.7%, in 2015, it increased by 0.5%, in 2016, it fell by 2.8%, in 2017, it fell by 3.6%, in 2018, it fell by 2.7%, meaning that after five years, it was up by 4.1%.
Investing in Forex with Admiral Markets
Admiral Markets offers professional traders the ability to trade with a custom, upgraded version of MetaTrader 5, allowing you to experience trading at a significantly higher, more rewarding level. Experience benefits such as the addition of the Market Heat Map, so you can compare various currency pairs to see which ones might be lucrative investments, access real-time trading data, and so much more. Click the banner below to start your FREE download of MT5 Supreme Edition!
Disclaimer: The given data provides additional information regarding all analysis, estimates, prognosis, forecasts or other similar assessments or information (hereinafter “Analysis”) published on the website of Admiral Markets. Before making any investment decisions please pay close attention to the following:
This is a marketing communication. The analysis is published for informative purposes only and are in no way to be construed as investment advice or recommendation. It has not been prepared in accordance with legal requirements designed to promote the independence of investment research, and that it is not subject to any prohibition on dealing ahead of the dissemination of investment research.
Any investment decision is made by each client alone whereas Admiral Markets shall not be responsible for any loss or damage arising from any such decision, whether or not based on the Analysis.
Each of the Analysis is prepared by an independent analyst (Jens Klatt, Professional Trader and Analyst, hereinafter “Author”) based on the Author’s personal estimations.
To ensure that the interests of the clients would be protected and objectivity of the Analysis would not be damaged Admiral Markets has established relevant internal procedures for prevention and management of conflicts of interest.
Whilst every reasonable effort is taken to ensure that all sources of the Analysis are reliable and that all information is presented, as much as possible, in an understandable, timely, precise and complete manner, Admiral Markets does not guarantee the accuracy or completeness of any information contained within the Analysis. The presented figures refer that refer to any past performance is not a reliable indicator of future results.
The contents of the Analysis should not be construed as an express or implied promise, guarantee or implication by Admiral Markets that the client shall profit from the strategies therein or that losses in connection therewith may or shall be limited.
Any kind of previous or modeled performance of financial instruments indicated within the Publication should not be construed as an express or implied promise, guarantee or implication by Admiral Markets for any future performance. The value of the financial instrument may both increase and decrease and the preservation of the asset value is not guaranteed.
The projections included in the Analysis may be subject to additional fees, taxes or other charges, depending on the subject of the Publication. The price list applicable to the services provided by Admiral Markets is publicly available from the website of Admiral Markets.
Leveraged products (including contracts for difference) are speculative in nature and may result in losses or profit. Before you start trading, you should make sure that you understand all the risks.
The markets remained rather subdued on Thursday in the run-up to this weekend’s G20 summit. As Trump and Xi meet on the sidelines of the G20 summit, reports indicated that China is to submit its set of terms to be met before further progress could take place. The new developments raise questions on whether the trade talks will be amicably settled. One of the demands from China includes a rollback of all the recent tariff hikes levied by the US. The US dollar was seen trading flat on the day.
Germany’s Inflation Rises 1.3% YoY
The latest inflation report from Germany showed that consumer prices rose 1.3% on the year ending May 2019. This was well below the ECB’s 2% inflation target rate. On a monthly basis, Germany’s inflation was up just 0.3%. The weakness in inflation is starting to build up expectations that the ECB will follow through with policy easing in July.
EURUSD Trades Flat Within Range
The currency pair was seen trading flat within the 1.1400 and 1.1339 level on Thursday. The consolidation within this range indicates a potential breakout in the near term. The bias remains mixed. A breakout above 1.1400 will confirm further upside bias while a close below 1.1339 could trigger a deeper correction in the EURUSD. We expect the EURUSD to test the next lower support at 1.1250 in such an event.
Crude Oil Holds on to Gains
Crude oil prices were trading flat on Thursday. The OPEC meeting is due to take place from July 1st and 2ndin Vienna, Austria. So far, the markets are mixed on whether the OPEC members will cut production even further. Preliminary reports suggest that OPEC members will maintain the production cuts currently in place.
WTI Crude Oil Likely to Consolidate Near $60 Handle
WTI Crude oil managed to clear the resistance level of 57.50 and is now trading close to the $60 price point. We expect oil prices to consolidate near this level into next week. With the rally in oil price, it is likely that the markets are already discounting the existing production cuts. Failure to expect a further production cut that would be bullish for oil prices could signal a possible move back to the $57.50 level of support.
Gold Holds Steady at $1400
Gold prices managed to rebound after price fell close to the $1400 an ounce level. The rebound in gold prices comes as investors wait for further catalysts. On the economic front, the first quarter GDP from the US was unrevised at 3.1%. Meanwhile, pending home sales rose 1.1% matching estimates.
Will Gold Continue to Rise Higher?
The precious metal retreated off the highs to establish support at the $1404 level. Gold posted a lower high on the rebound off the support level. Failure to post further gains could see gold once again easing back to the 1404 level. A break down below this level could signal further declines. The next support level is at 1354.00
Asian stocks slipped as the G20 summit kicked off in Japan, bringing investors closer to the pivotal Trump-Xi meeting which should set the tone for US-China relations moving forward. The Dollar Index (DXY) remains steady, while the Japanese Yen and Gold are gaining at the time of writing, as markets continue playing it safe ahead of what could be a watershed event for global markets.
This weekend, markets will find out whether their hopes for a restoration in US-China trade talks will become reality, and whether the scope for further deterioration in bilateral relations would be significantly constrained. It remains to be seen whether the public displays of chest-thumping from both sides since May will eventually lead to handshakes and smiles on Saturday. Such a reconciliatory image out of the Trump-Xi meeting is expected to send relief signals coursing through the veins of the markets, potentially boosting global equities and emerging-market assets.
Still, the prudent investor would be well aware that the road ahead isn’t all plain sailing, given the tremendous gulf that still remains between both governments, with tit-for-tat tariffs still in place. As long as the prospects of more trade tariffs loom large over the horizon, risk aversion should continue having a major say on market sentiment.
Dollar remains doused with Fed dovishness
The Dollar Index (DXY) is struggling to lift itself off the psychological 96 support level, as the Greenback remains doused by the Fed’s dovish stance. The final-read on Q1 US GDP reported lower-than-expected consumer spending growth during the quarter, which suggests that US economic growth momentum is waning. Given the moderating economic indicators in Q2, a period when US-China tensions intensified, the data seems to justify the Federal Reserve’s openness to lowering US interest rates.
The prospects of looser US monetary policy are exerting downward pressure on the Greenback, and the subdued DXY performance is expected to continue as long as the Fed’s easing bias remains evident. The headlines out of the Trump-Xi meeting may prove to be a major catalyst for the Dollar’s next move, with DXY potentially going on a tear if the door to a US-China trade deal is slammed shut this weekend.
Pound pressured by prospects of no-deal Brexit
GBPUSD is trading below the 1.27 level at the time of writing, after UK Prime Minister candidate, Boris Johnson, refused to rule out a no-deal Brexit. As long as a no-deal Brexit remains a possibility, that should keep the Pound below the psychological 1.30 mark against the US Dollar. Even though the UK leadership transition is set to be completed within the next month, Sterling is expected to remain exposed to political risks leading up to the October 31 Brexit deadline, as the UK continues to pursue its exit from the European Union.
Disclaimer: The content in this article comprises personal opinions and should not be construed as containing personal and/or other investment advice and/or an offer of and/or solicitation for any transactions in financial instruments and/or a guarantee and/or prediction of future performance. ForexTime (FXTM), its affiliates, agents, directors, officers or employees do not guarantee the accuracy, validity, timeliness or completeness, of any information or data made available and assume no liability as to any loss arising from any investment based on the same.
Dollar strengthening accelerated on GDP final reading
US stock market edged higher on Thursday ahead of G20 summit despite National Economic Council director Larry Kudlow’s comment US may move forward with additional tariffs, and no preconditions were set ahead of Trump’s meeting with Xi. The S&P 500 gained 0.4% snapping four-day retreat. The Dow Jones industrial average however slipped less thane 0.1% to 26526.58. Nasdaq composite index rose 0.7% to 7967.76. The dollar strengthening accelerated as the final revision of first quarter GDP confirmed the US economy grew at a solid rate of 3.1% in the first quarter. The live dollar index data show the ICE US Dollar index, a measure of the dollar’s strength against a basket of six rival currencies, added 0.05% to 96.21 but is lower currently. Futures on US stock indices point to higher openings today.
DAX 30 gained while other European indexes slip
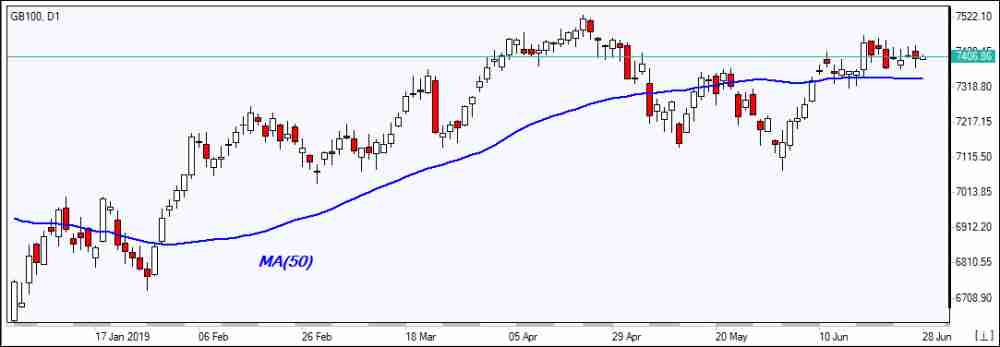
European stocks ended unchanged on Thursday. Both EUR/USD and GBP/USD turned lower with both pairs higher currently. The Stoxx Europe 600 index ended flat. Germany’s DAX 30 however rose 0.2% to 12271.03 lifted by 8.7% rally in Bayer. France’s CAC 40 slipped 0.1% and UK’s FTSE 100 slid 0.2% to 7402.33.
Australia’s All Ordinaries Index leads Asian indexes declines
Asian stock indices are mostly lower today while Trump met with the leaders of Japan, Germany and India on the sidelines of the G20 meeting in Osaka, Japan. Nikkei fell 0.3% to 21275.92 as yen reversed its earlier slide against the dollar. Chinese shares are retreating with no certainty about the outcome of Trump and Xi meeting tomorrow after the American president’s statement earlier he was preparing to target the $300 billion Chinese imports : the Shanghai Composite Index is down 0.6% while Hong Kong’s Hang Seng Index is 0.3% lower. Australia’s All Ordinaries Index turned 0.7% lower with Australian dollar’s climb against the greenback intact.
Note: This overview has an informative and tutorial character and is published for free. All the data, included in the overview, are received from public sources, recognized as more or less reliable. Moreover, there is no guarantee that the indicated information is full and precise. Overviews are not updated. The whole information in each overview, including opinion, indicators, charts and anything else, is provided only for familiarization purposes and is not financial advice or а recommendation. The whole text and its any part, as well as the charts cannot be considered as an offer to make a deal with any asset. IFC Markets and its employees under any circumstances are not liable for any action taken by someone else during or after reading the overview.