10-Year Note Speculators strongly pared their bearish bets this week

June 29th – By CountingPips.comReceive our weekly COT Reports by Email
10-Year Note Non-Commercial Speculator Positions:

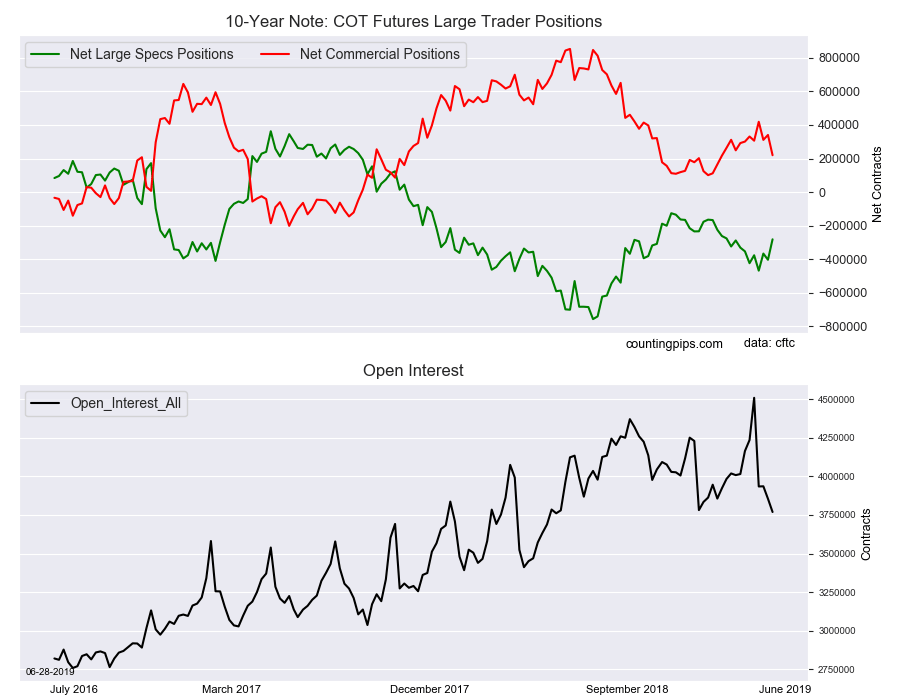
Large bond speculators sharply pulled back on their bearish net positions in the 10-Year Note futures markets this week, according to the latest Commitment of Traders (COT) data released by the Commodity Futures Trading Commission (CFTC) on Friday.

The non-commercial futures contracts of 10-Year Note futures, traded by large speculators and hedge funds, totaled a net position of -281,099 contracts in the data reported through Tuesday June 25th. This was a paring of the bearish position by 121,885 net contracts from the previous week which had a total of -402,984 net contracts.

The week’s net position was the result of the gross bullish position (longs) gaining by 51,131 contracts (to a weekly total of 672,136 contracts) that combined with the gross bearish position (shorts) that declined by -70,754 contracts for the week (to a total of 953,235 contracts).

Large Specs have been betting the wrong way

The 10-year note speculators sharply reduced their bearish position this week by over one hundred thousand contracts and by the largest one-week amount since November 13th of 2018. This works out to approximately a thirty percent cut in their bearish positions on the week.

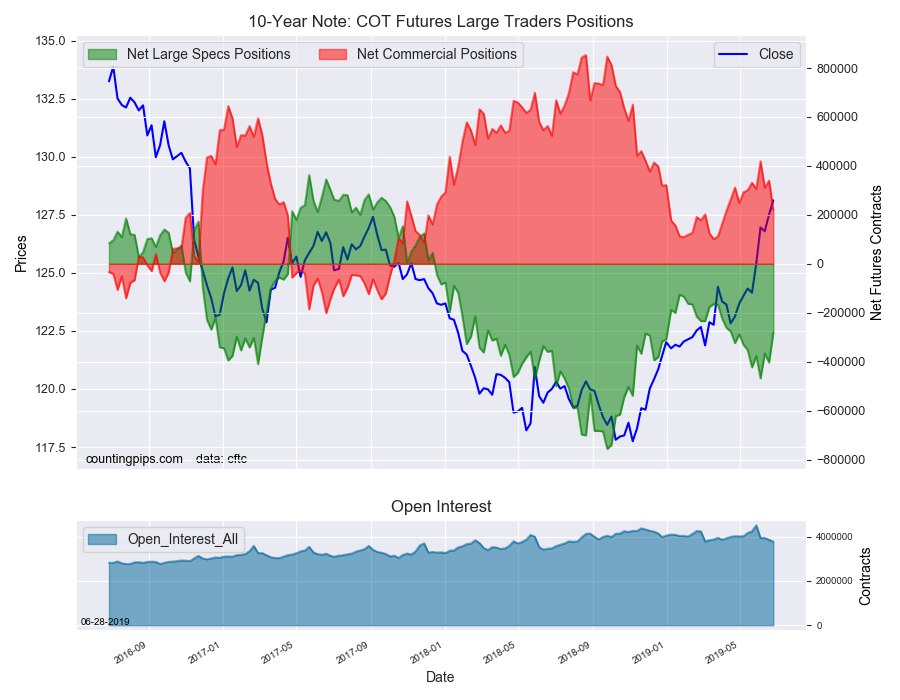
The 10-year speculators had been adding to their bearish bets in ten out of the previous thirteen weeks despite the strength of the US Treasury bonds. These usually reliable trend-followers have been caught on the wrong side of this market as 10-year bonds have rallied approximately 7.5% this year and yields have plummeted with the 10-year yield currently at 2.00%.

This week’s sharp pullback for speculators bring the current standing under the -300,000 net contract level for the first time in eight weeks and the lowest bearish standing since April 16th.

10-Year Note Commercial Positions:

The commercial traders position, hedgers or traders engaged in buying and selling for business purposes, totaled a net position of 219,912 contracts on the week. This was a weekly drop of -120,487 contracts from the total net of 340,399 contracts reported the previous week.
10-Year Note Futures:

Over the same weekly reporting time-frame, from Tuesday to Tuesday, the 10-Year Note Futures (Front Month) closed at approximately $128.12 which was a boost of $0.62 from the previous close of $127.50, according to unofficial market data.

*COT Report: The COT data, released weekly to the public each Friday, is updated through the most recent Tuesday (data is 3 days old) and shows a quick view of how large speculators or non-commercials (for-profit traders) as well as the commercial traders (hedgers & traders for business purposes) were positioned in the futures markets.

The CFTC categorizes trader positions according to commercial hedgers (traders who use futures contracts for hedging as part of the business), non-commercials (large traders who speculate to realize trading profits) and nonreportable traders (usually small traders/speculators).

Find CFTC criteria here: (http://www.cftc.gov/MarketReports/CommitmentsofTraders/ExplanatoryNotes/index.htm).

Article By CountingPips.comReceive our weekly COT Reports by Email
Gold Speculators continue raising their bullish bets sharply for 4th week

June 29th – By CountingPips.comReceive our weekly COT Reports by Email
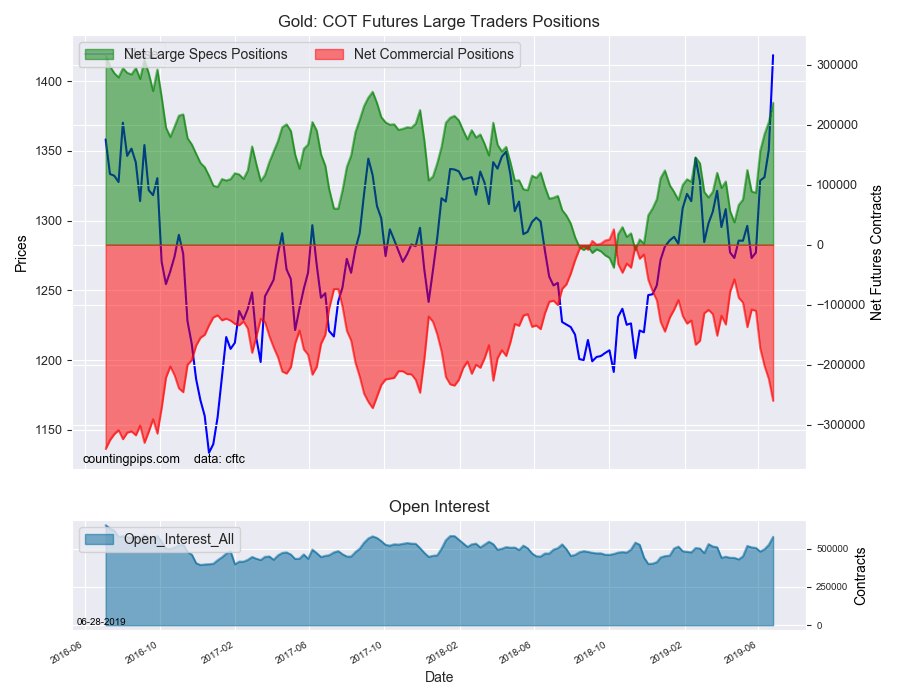
Gold Non-Commercial Speculator Positions:

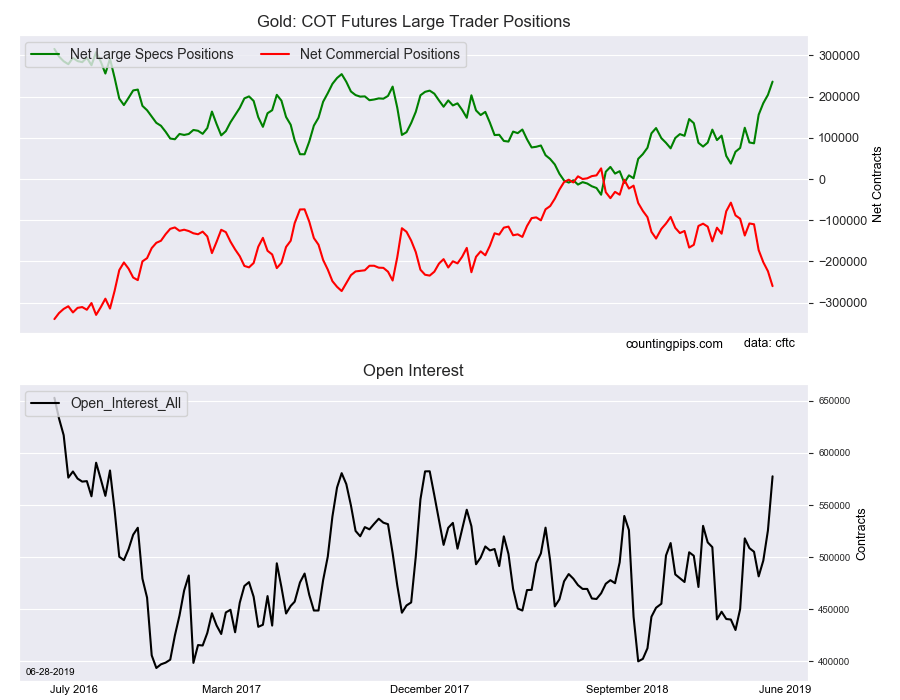
Large precious metals speculators raised their bullish net positions higher in the Gold futures markets this week, according to the latest Commitment of Traders (COT) data released by the Commodity Futures Trading Commission (CFTC) on Friday.

The non-commercial futures contracts of Gold futures, traded by large speculators and hedge funds, totaled a net position of 236,554 contracts in the data reported through Tuesday June 25th. This was a weekly boost of 32,231 net contracts from the previous week which had a total of 204,323 net contracts.

The week’s net position was the result of the gross bullish position (longs) gaining by 23,475 contracts (to a weekly total of 298,108 contracts) and combined with the gross bearish position (shorts) that fell by -8,756 contracts for the week (to a total of 61,554 contracts).

Spec Sentiment Strengthens

The gold large speculator position rose sharply for a fourth straight week and has risen by a total of just about +150,000 net contracts in these last four weeks. The gold speculator position had recently been as low as +37,395 contracts on April 23rd (just 10 weeks ago) before seeing a bullish surge in sentiment and shooting to higher levels over these past 10 weeks.

Gold bets are above the +200,000 contract level for a second straight week and are now at the highest level since September 9th of 2017.

Gold Commercial Positions:

The commercial traders position, hedgers or traders engaged in buying and selling for business purposes, totaled a net position of -260,150 contracts on the week. This was a weekly fall of -36,295 contracts from the total net of -223,855 contracts reported the previous week.

Gold Futures:

Over the same weekly reporting time-frame, from Tuesday to Tuesday, the Gold Futures (Front Month) closed at approximately $1418.70 which was an increase of $68.00 from the previous close of $1350.70, according to unofficial market data.

*COT Report: The COT data, released weekly to the public each Friday, is updated through the most recent Tuesday (data is 3 days old) and shows a quick view of how large speculators or non-commercials (for-profit traders) as well as the commercial traders (hedgers & traders for business purposes) were positioned in the futures markets.

The CFTC categorizes trader positions according to commercial hedgers (traders who use futures contracts for hedging as part of the business), non-commercials (large traders who speculate to realize trading profits) and nonreportable traders (usually small traders/speculators).

Find CFTC criteria here: (http://www.cftc.gov/MarketReports/CommitmentsofTraders/ExplanatoryNotes/index.htm).

Article By CountingPips.comReceive our weekly COT Reports by Email
VIX Speculators raised their bearish bets to 7-week high

June 29th – By CountingPips.comReceive our weekly COT Reports by Email
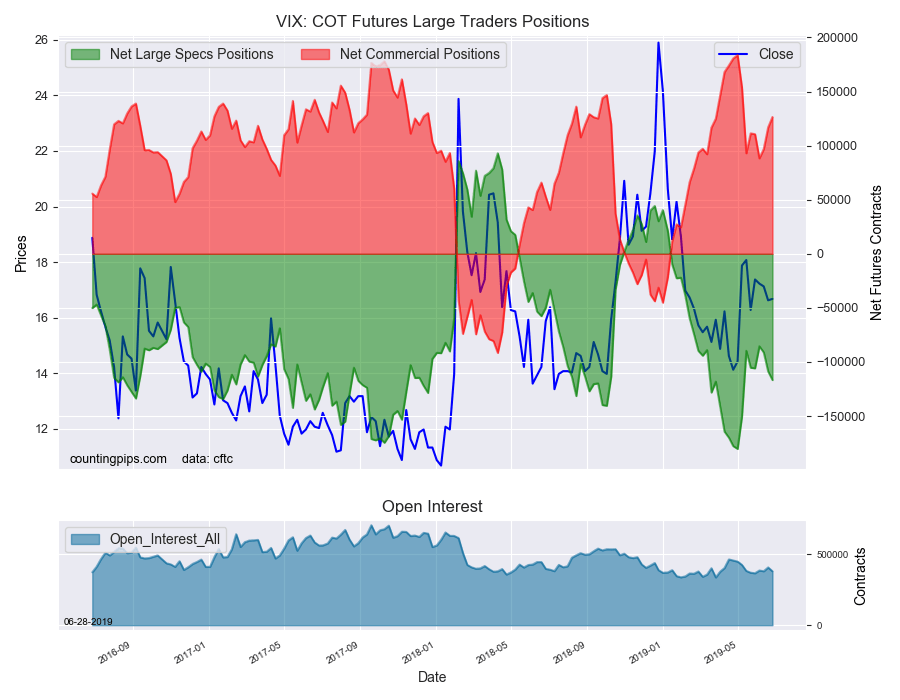
VIX Non-Commercial Speculator Positions:

Large volatility speculators once again added to their bearish net positions in the VIX futures markets and pushed their short position to a seven-week high, according to the latest Commitment of Traders (COT) data released by the Commodity Futures Trading Commission (CFTC) on Friday.

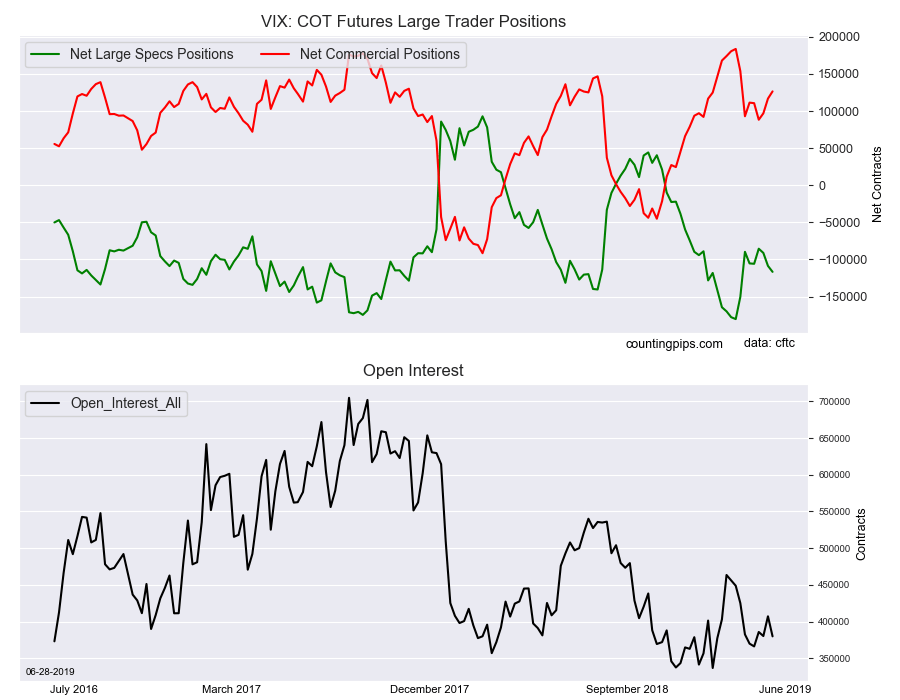
The non-commercial futures contracts of VIX futures, traded by large speculators and hedge funds, totaled a net position of -116,694 contracts in the data reported through Tuesday June 25th. This was a weekly change of -8,050 net contracts from the previous week which had a total of -108,644 net contracts.

The week’s net position was the result of the gross bullish position (longs) rising by 1,385 contracts (to a weekly total of 81,951 contracts) but being more than offset by the gross bearish position (shorts) which increased by 9,435 contracts for the week (to a total of 198,645 contracts).

The VIX speculative position has now gained for three weeks in a row and for five out of the past six weeks. The VIX standing hit an all-time bearish record of -180,359 contracts on April 30th but then speculators sharply reversed and retreated out of their positions (shedding approximately 90,000 contracts) in the next two weeks.

Recently, the bearish sentiment has picked up again and the overall bearish position is now above the -100,000 contract level for a second straight week and at the most bearish level since May 5th.

VIX Commercial Positions:

The commercial traders position, hedgers or traders engaged in buying and selling for business purposes, totaled a net position of 126,509 contracts on the week. This was a weekly rise of 9,740 contracts from the total net of 116,769 contracts reported the previous week.

VIX Futures:

Over the same weekly reporting time-frame, from Tuesday to Tuesday, the VIX Futures (Front Month) closed at approximately $16.67 which was an uptick of $0.05 from the previous close of $16.62, according to unofficial market data.

*COT Report: The COT data, released weekly to the public each Friday, is updated through the most recent Tuesday (data is 3 days old) and shows a quick view of how large speculators or non-commercials (for-profit traders) as well as the commercial traders (hedgers & traders for business purposes) were positioned in the futures markets.

The CFTC categorizes trader positions according to commercial hedgers (traders who use futures contracts for hedging as part of the business), non-commercials (large traders who speculate to realize trading profits) and nonreportable traders (usually small traders/speculators).

Find CFTC criteria here: (http://www.cftc.gov/MarketReports/CommitmentsofTraders/ExplanatoryNotes/index.htm).

Article By CountingPips.comReceive our weekly COT Reports by Email
 

Silver Speculators strongly boosted their bullish bets to 16-week high

June 29th – By CountingPips.comReceive our weekly COT Reports by Email
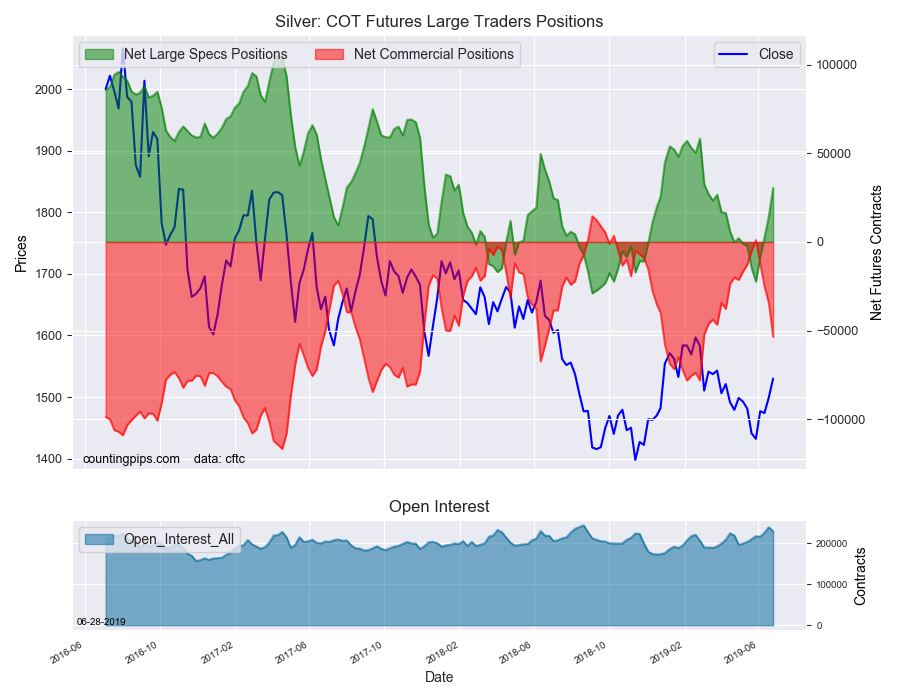
Silver Non-Commercial Speculator Positions:

Large precious metals speculators continued to bet in favor of Silver in the futures markets again this week, according to the latest Commitment of Traders (COT) data released by the Commodity Futures Trading Commission (CFTC) on Friday.

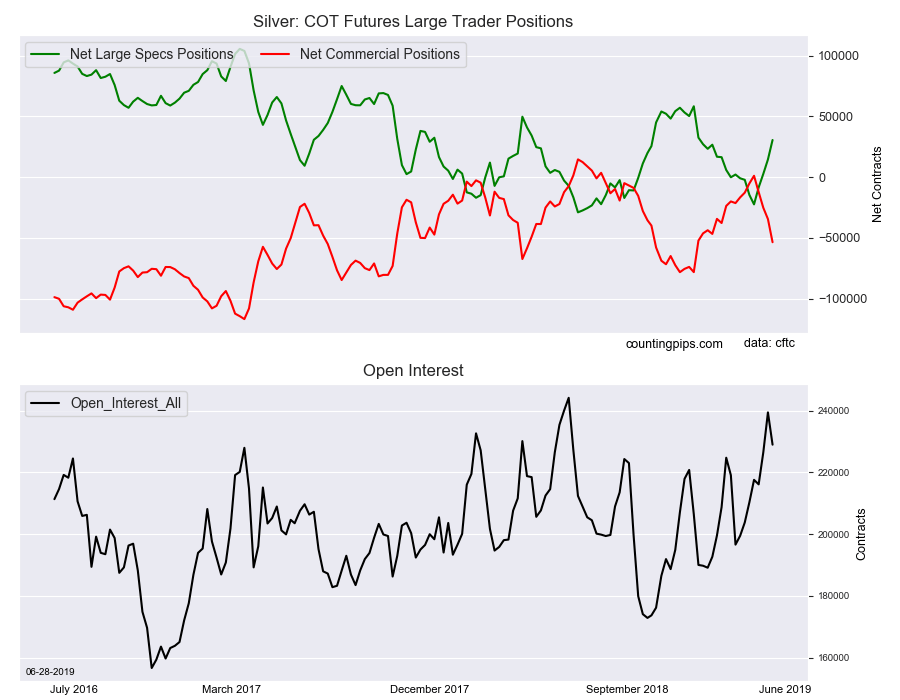
The non-commercial futures contracts of Silver futures, traded by large speculators and hedge funds, totaled a net position of 30,565 contracts in the data reported through Tuesday June 25th. This was a weekly gain of 16,049 net contracts from the previous week which had a total of 14,516 net contracts.

The week’s net position was the result of the gross bullish position (longs) rising by 4,298 contracts (to a weekly total of 97,573 contracts) that combined with the gross bearish position (shorts) that dropped by -11,751 contracts for the week (to a total of 67,008 contracts).

Silver had recently fallen into bearish territory in late April and through the month of May with positions marking a low of -22,409 contracts on May 28th. Since then sentiment has turned around sharply in the past month.

Silver large speculator positions continued to jump higher this week and the net position increased by over +10,000 contracts for a fourth consecutive week. This week’s rise by more than +16,000 contracts is the largest one-week gain since December 31st.

The rising speculator sentiment has pushed the current standing for the Silver bullish position to the highest level since March 5th when bets totaled +32,521 contracts.

Silver Commercial Positions:

The commercial traders position, hedgers or traders engaged in buying and selling for business purposes, totaled a net position of -53,552 contracts on the week. This was a weekly shortfall of -19,065 contracts from the total net of -34,487 contracts reported the previous week.

Silver Futures:

Over the same weekly reporting time-frame, from Tuesday to Tuesday, the Silver Futures (Front Month) closed at approximately $1530.00 which was a rise of $30.70 from the previous close of $1499.30, according to unofficial market data.

*COT Report: The COT data, released weekly to the public each Friday, is updated through the most recent Tuesday (data is 3 days old) and shows a quick view of how large speculators or non-commercials (for-profit traders) as well as the commercial traders (hedgers & traders for business purposes) were positioned in the futures markets.

The CFTC categorizes trader positions according to commercial hedgers (traders who use futures contracts for hedging as part of the business), non-commercials (large traders who speculate to realize trading profits) and nonreportable traders (usually small traders/speculators).

Find CFTC criteria here: (http://www.cftc.gov/MarketReports/CommitmentsofTraders/ExplanatoryNotes/index.htm).

Article By CountingPips.comReceive our weekly COT Reports by Email
Copper Speculators rebooted their bearish bets this week

June 29th – By CountingPips.comReceive our weekly COT Reports by Email
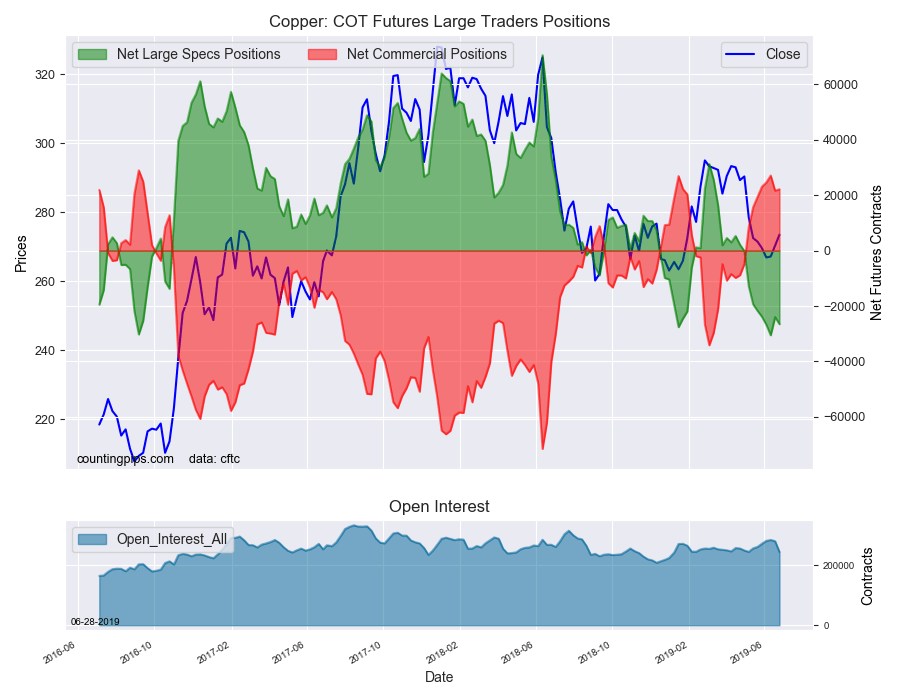
Copper Non-Commercial Speculator Positions:

Large precious metals speculators added to their bearish net positions in the Copper futures markets after a pause in bearish sentiment last week, according to the latest Commitment of Traders (COT) data released by the Commodity Futures Trading Commission (CFTC) on Friday.

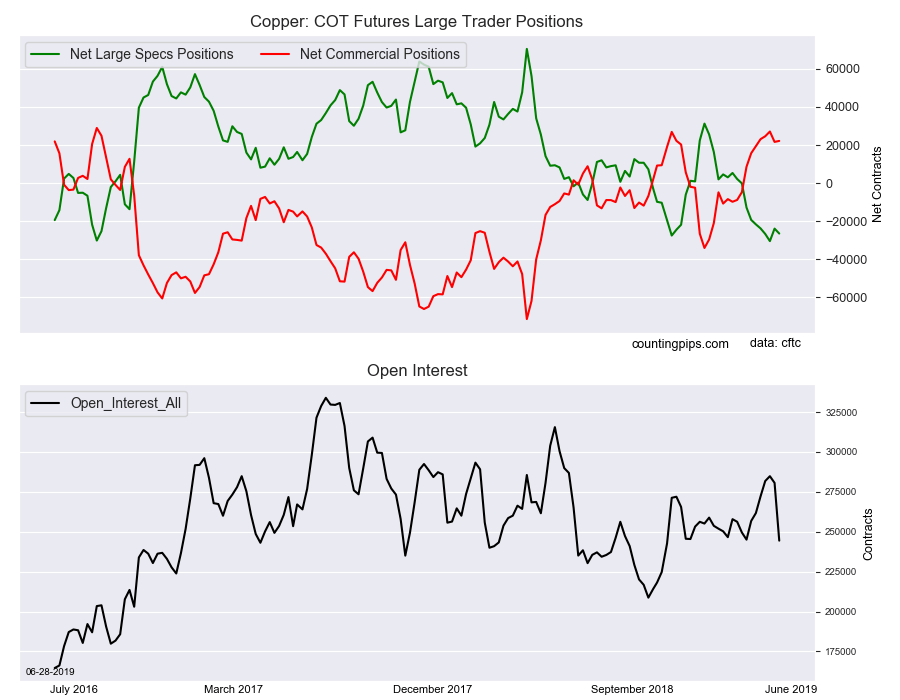
The non-commercial futures contracts of Copper futures, traded by large speculators and hedge funds, totaled a net position of -26,539 contracts in the data reported through Tuesday June 25th. This was a weekly change of -2,587 net contracts from the previous week which had a total of -23,952 net contracts.

The week’s net position was the result of the gross bullish position (longs) dropping by -8,958 contracts (to a weekly total of 73,297 contracts) while the gross bearish position (shorts) fell by a smaller amount of -6,371 contracts for the week (to a total of 99,836 contracts).

Copper bets had been on a steep downtrend before last week’s dip in bearish sentiment provided a pause in the recent streak. This week, however, now marks the ninth time out of the past ten weeks that bearish positions have increased and the position has changed by a total of -31,851 net contracts over that time-frame.

The overall bearish sentiment for speculators has now been more than -20,000 net contracts for six straight weeks which is the longest such streak since May and June of 2016 (which topped out at 7 weeks).

Copper Commercial Positions:

The commercial traders position, hedgers or traders engaged in buying and selling for business purposes, totaled a net position of 22,162 contracts on the week. This was a weekly increase of 521 contracts from the total net of 21,641 contracts reported the previous week.

Copper Futures:

Over the same weekly reporting time-frame, from Tuesday to Tuesday, the Copper Futures (Front Month) closed at approximately $273.50 which was an uptick of $3.20 from the previous close of $270.30, according to unofficial market data.

*COT Report: The COT data, released weekly to the public each Friday, is updated through the most recent Tuesday (data is 3 days old) and shows a quick view of how large speculators or non-commercials (for-profit traders) as well as the commercial traders (hedgers & traders for business purposes) were positioned in the futures markets.

The CFTC categorizes trader positions according to commercial hedgers (traders who use futures contracts for hedging as part of the business), non-commercials (large traders who speculate to realize trading profits) and nonreportable traders (usually small traders/speculators).

Find CFTC criteria here: (http://www.cftc.gov/MarketReports/CommitmentsofTraders/ExplanatoryNotes/index.htm).

Article By CountingPips.comReceive our weekly COT Reports by Email

The Week Ahead: Friday 28th June 2019 – Currency Point: USD trades

By Evan Lucas, FPMarkets.com

Currency Point: USD trades

Trade idea: Sell USD/JPY

Enter: above ¥108, Stop at ¥111.00, Target ¥1.04

Opening a trade in USD/JPY after a jump up in the pair over the past week or so that is creating an entry point. The outlook from the Federal Reserve around rates is putting real pressure on the USD with the market is pricing in 4 rate cuts from the Federal Reserve by June 2020 and a 65% chance the first cut will come this month.

The US outlook is also worrying from a currency perspective as corporate earnings are starting to disappoint, forward indicators such as the Empire State PMI, Jobs claims and Building Surveys are beginning to slide. Risk off flows look likely and flows to safety are growing.

Risk for the trade: Trade wars abate.

Trade Idea: Buy AUD/USD (Post RBA meeting)

Enter: below $0.70, Stop: $0.6840 (recent low), Target $0.7280

Market currently pricing a 25-basis point cut at Tuesday’s RBA meeting at 78%. The market has completely priced in a further 50 basis points out of the cash rate by December 2019.

However, the flow in the pair is heavily skewed to the USD side and the likely unwinding of USD longs over the coming month with the Federal Reserve in play puts upside into the pair. The RBA governor Philip Lowe highlighted this exact point last week stating that if all central banks are looking to stimulus simultaneously those smaller players (Australia) will not see the economic benefit of a lower currency.

Risk for the trade: Iron ore prices falling back below US$100 a tonne, trade wars intensify.

Trade Idea: Sell USD/CAD

Enter: above $1.32, Stop: $1.338, Target $1.291

Pair should trade lower over the coming months as Canadian economics remains robust even in the face of a slowing global market while the US is slowing. Governor Poloz should be happy core inflation came in above expectations at the recent release and that should see the Bank of Canada on hold for the coming period. Couple this with Canadian corporate earnings which are holding the line – CAD looks attractive.

We also expect the unwinding of USD long positions to drive this position lower.

Risk to the trade: negative outcomes from G20, collapse of oil below $50 a barrel.

By Evan Lucas, FPMarkets.com


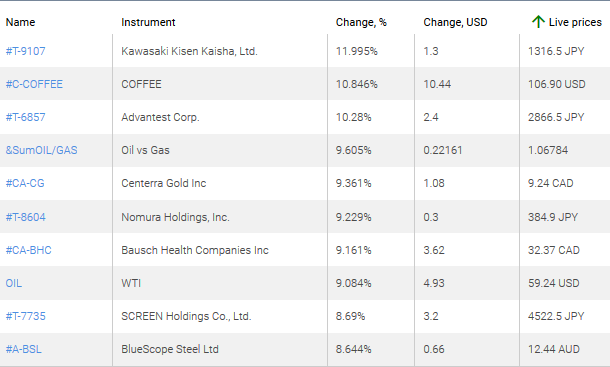
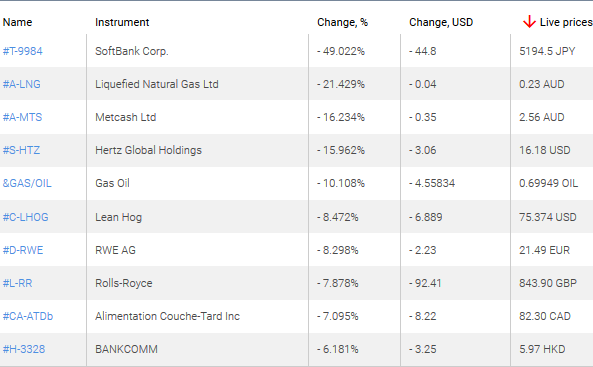
Kawasaki, Coffee Futures & Softbank lead the Weekly Top Gainers/Losers

By IFCMarkets

Top Gainers – The World Market

1. Kawasaki Kisen Kaisha, Ltd. – Japanese transport company.

2. CFDs on Coffee futures – contract on Coffee.

market sentiment ratio long short positions

 Top Losers – The World Market

1. SoftBank Corp – Japanese telecommunications and IT company.

2. Liquefied Natural Gas Limited – Australian terminal for the liquefaction and export of natural gas.

market sentiment ratio long short positions

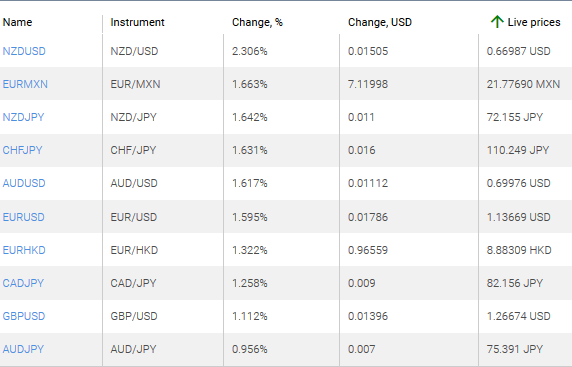
 Top Gainers – Foreign Exchange Market (Forex)

1. NZDUSD, NZDJPY – an increase in this chart indicates the strengthening of the New Zealand dollar against the US dollar and the Japanese yen.

2. EURMXN, EURUSD – an increase in this chart means the strengthening of the euro against the Mexican peso and the us dollar.

market sentiment ratio long short positions

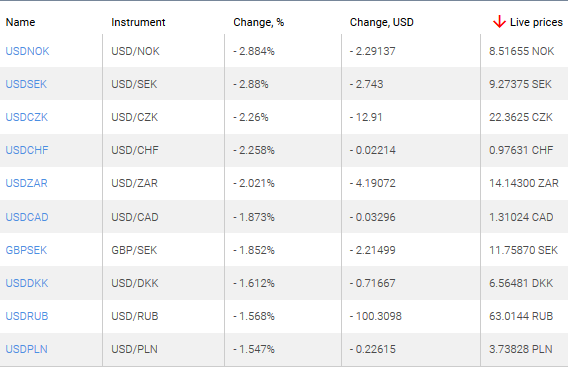
 Top Losers – Foreign Exchange Market (Forex)

1. USDNOK, USDSEK – the decrease in this charts indicates the weakening of the American dollar against the Norwegian and Swedish krona.

2. USDCZK, USDCHF – the decrease in this chart means a weakening of the American dollar against the Czech koruna and the Swiss franc.

market sentiment ratio long short positions

Market Analysis provided by IFCMarkets

Note:
This overview has an informative and tutorial character and is published for free. All the data, included in the overview, are received from public sources, recognized as more or less reliable. Moreover, there is no guarantee that the indicated information is full and precise. Overviews are not updated. The whole information in each overview, including opinion, indicators, charts and anything else, is provided only for familiarization purposes and is not financial advice or а recommendation. The whole text and its any part, as well as the charts cannot be considered as an offer to make a deal with any asset. IFC Markets and its employees under any circumstances are not liable for any action taken by someone else during or after reading the overview.

WHEAT Analysis: Lower Canadian crop estimate bullish for wheat

By IFCMarkets

Lower Canadian crop estimate bullish for wheat

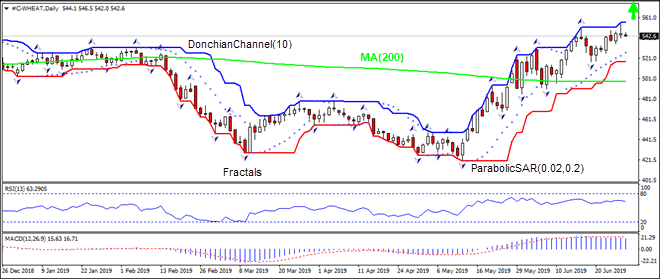
Wheat production estimate was lowered in Canada’s Principal field crop areas report. Will the wheat prices continue rising?

Statistics Canada reported wheat plantings at 24.595 million acres on June 26, down 0.6% from 2018. This area is below a prior estimate of 25-26 million acres. Canada is world’s seventh top wheat producer, and what is more important the second biggest wheat exporter: Canada exported $5.7 billion worth of wheat during 2018, accounting for 14.2% of global wheat exports in 2018. Lower Canadian wheat production estimate is bullish for wheat.

WHEAT is falling below MA(50) 04/11/2019 Technical Analysis IFC Markets chart

On the daily timeframe the WEHAT: D1 is above the 200-day moving average MA(200), this is bullish.

  • The Parabolic indicator gives a buy signal.
  • The Donchian channel indicates no trend yet: it is flat.
  • The MACD indicator gives a bearish signal: it is above the signal line and the gap is narrowing.
  • The RSI oscillator has levelled off and has not reached the oversold zone yet.

We believe the bullish momentum will continue after the price breaches above the upper boundary of Donchian channel at 556.1. This level can be used as an entry point for placing a pending order to buy. The stop loss can be placed below the last fractal low at 517.5. After placing the order, the stop loss is to be moved every day to the next fractal low, following Parabolic signals. Thus, we are changing the expected profit/loss ratio to the breakeven point. If the price meets the stop loss level (517.5) without reaching the order (556.1), we recommend cancelling the order: the market has undergone internal changes which were not taken into account.

Technical Analysis Summary

OrderBuy
Buy stopAbove 556.1
Stop lossBelow 517.5

Market Analysis provided by IFCMarkets

How To Improve Your Trading Decisions: Weighting

By Orbex

A common factor in the decisions traders make is paying attention to the right decisions that maximize profitability.

Not only is it important to make the right decisions, but it’s important to make the right decisions about the right things. Because there is so much information coming from the markets, no single person can process it all. So, we focus on certain areas of interest.

We do the same when it comes to decisions. As a trader, you constantly have to be evaluating the market and making choices about your trades. The thing is, psychologically, we are predisposed to put more emphasis on certain decisions than others. Some are more important, obviously, but do we always focus on those?

Maximizing Profitability over Number of Trades

The human brain is not a machine. It has emotions. It has instincts. And the subconscious is always there.

One of the most common elements of humans is to be adverse to risk. It’s a well-known fact that markets don’t like risk. And that’s because they are composed of humans!

Therefore, we tend to focus on decisions that are perceived to involve risk – that is, when we open a trade – and discount decisions that are not so evidently associated with risk (such as setting stop losses). This leads us to care more about how many trades we have instead of looking at the market in terms of profitability.

Finding the Right Balance

When we care more about certain decisions, we will put more effort into them. The problem is this can come at the cost of ignoring other decisions that are just as important. But, because they are perceived to be the opposite of risk – for example, closing out a trade – we often don’t make as good a decision simply because we subconsciously don’t feel it’s as important.

Often this inadequate prioritization of our decisions is because of hidden risks. For example, deciding to jump on a trade without checking the economic calendar.

You see a good opportunity, so you focus on what’s happening in the market. Checking the news, or the economic calendar is not an important decision because you don’t make or lose money by doing it. However, you might make a great technical analysis decision on a particular trade, but it ends up going sideways because there was an event on the economic calendar that caused the market to react differently.

It’s Always Personal

Finding the best balance for which decisions are most important depends on your trading style. But, if you are aware of the fact that you need to prioritize your decisions in a way that isn’t necessarily common sense, you can optimize your decision process to suit your trading.

One of the ways to get a handle on this is to make a decision flow chart.

When you have a moment that you’re not focusing on the markets and trying to make a decision with all the information jumping at you, work out every decision you make in the process of deciding to trade.

This will help you visualize your ‘decision tree.’ You will see which are actually the most important, and which aspects of your trading you are not putting enough focus on.

Divide and Conquer

You’ll be surprised to learn how many decisions you make even before you start to trade, ones you aren’t even aware of.

If you weren’t paying enough attention to remember, how focused were you on that aspect of your trading? There might even be decisions you should be making, but you just aren’t. Maybe you aren’t objectively deciding where the best stop loss is, because you’re too eager to jump on the next trade.

Record each decision you make in a given trade, and then see how much attention you pay to each step, and compare it to how much each one impacts your profitability.

Are your trades getting stopped out a lot? That might not be a problem of entering the wrong trades, but of setting the wrong stop lossWant to improve your profitability? How much thought are you giving your take profit levels?

Bottom line is to weigh each one of your trading decisions in accordance with how much they affect your profitability, as opposed to how hard they are.

By Orbex


Forex Technical Analysis & Forecast 28.06.2019 (EURUSD, GBPUSD, USDCHF, USDJPY, AUDUSD, USDRUB, GOLD, BRENT)

Article By RoboForex.com

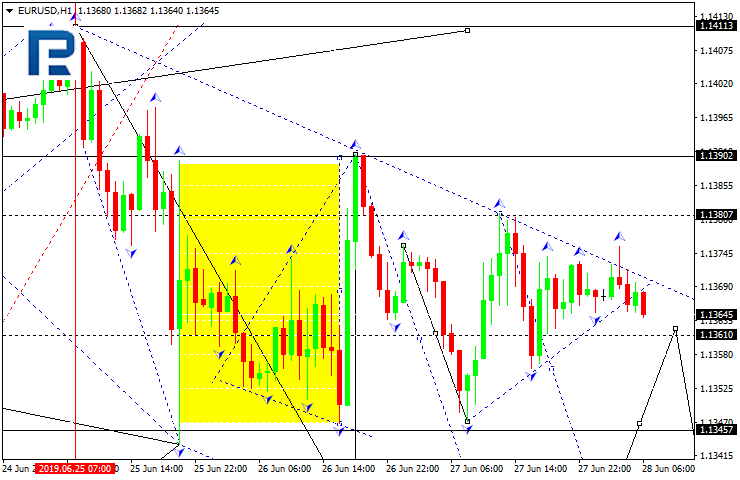
EURUSD, “Euro vs US Dollar”

EURUSD is still consolidating around 1.1360. Today, the pair may continue forming the descending wave with the target at 1.1331. After that, the instrument may form a new consolidation range. Later, the market may break it to the downside and then resume trading downwards with the target at 1.1272.

EURUSD_Технический анализ
Risk Warning: the result of previous trading operations do not guarantee the same results in the future

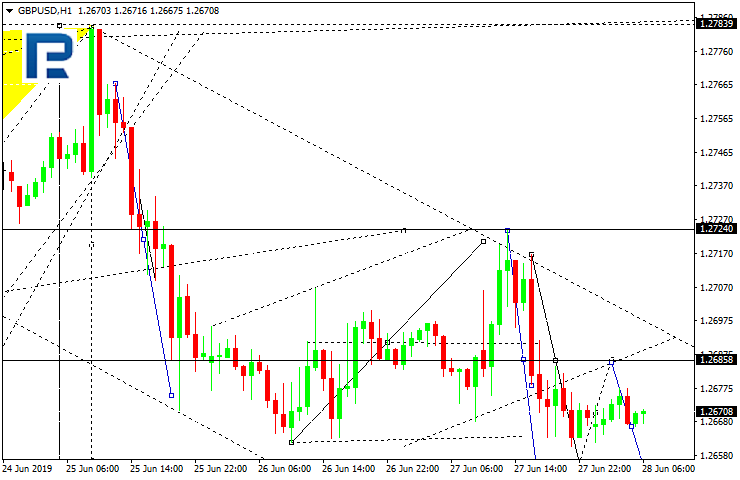
GBPUSD, “Great Britain Pound vs US Dollar”

GBPUSD continue trading downwards to reach 1.2647. Possibly, today the pair may reach this level and then start a new correction with the target at 1.2724.

GBPUSD_Технический анализ
Risk Warning: the result of previous trading operations do not guarantee the same results in the future

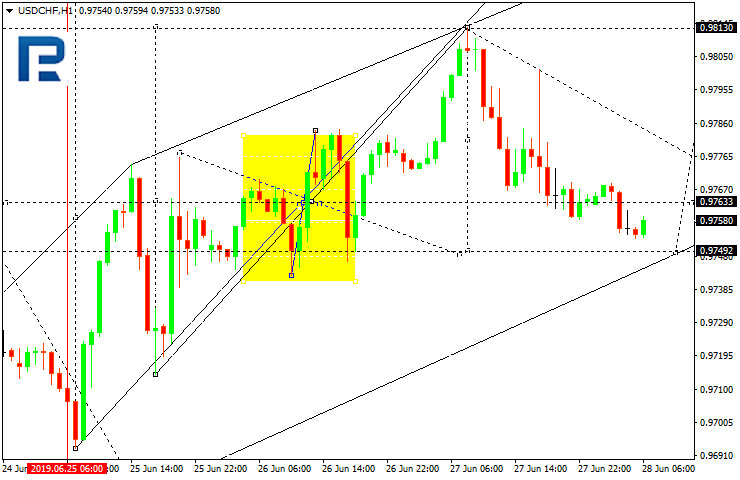
USDCHF, “US Dollar vs Swiss Franc”

USDCHF is being corrected towards 0.9750. After that, the instrument may form one more ascending structure with the first target at 0.9832 and start a new correction towards 0.9750.

USDCHF_Технический анализ
Risk Warning: the result of previous trading operations do not guarantee the same results in the future

USDJPY, “US Dollar vs Japanese Yen”

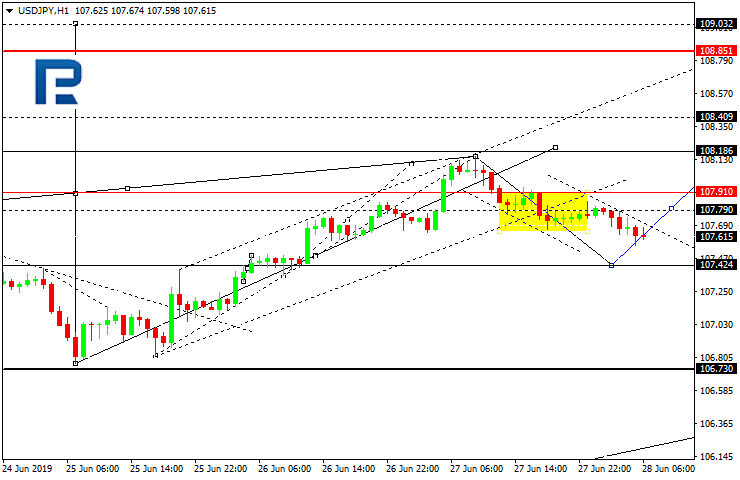
After forming the consolidation range around 107.80, USDJPY has broken it downwards. Possibly, the pair may continue trading downwards to reach 107.42. Later, the market may form one more ascending structure with the target at 108.18.

USDJPY_Технический анализ
Risk Warning: the result of previous trading operations do not guarantee the same results in the future

AUDUSD, “Australian Dollar vs US Dollar”

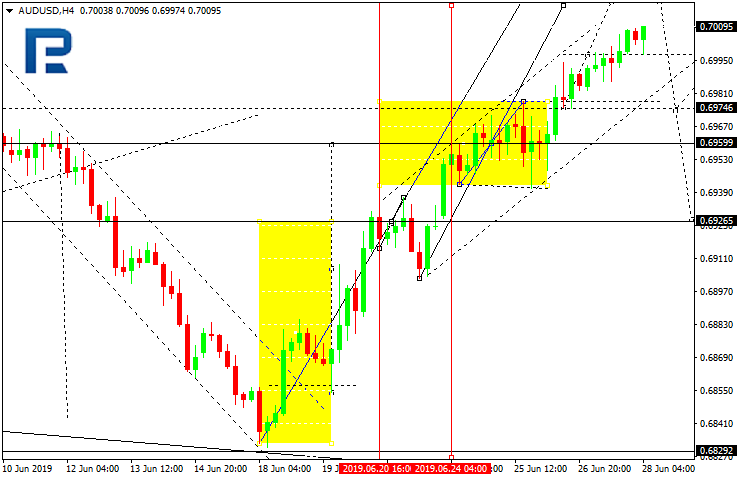
AUDUSD continues trading upwards. Possibly, today the pair may reach 0.7020 and then start another with the first target at 0.6926.

AUDUSD_Технический анализ
Risk Warning: the result of previous trading operations do not guarantee the same results in the future

USDRUB, “US Dollar vs Russian Ruble”

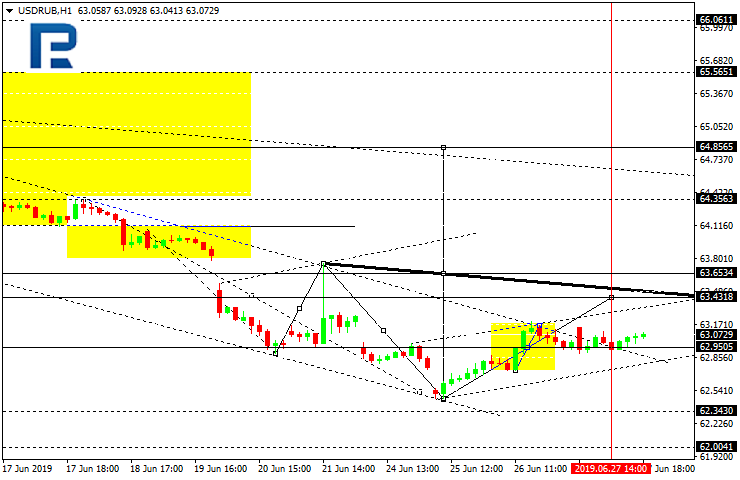
USDRUB is still consolidating around 62.95. If later the price breaks this range to the upside, the instrument may resume trading upwards with the first target at 63.43.

USDRUB_Технический анализ
Risk Warning: the result of previous trading operations do not guarantee the same results in the future

XAUUSD, “Gold vs US Dollar”

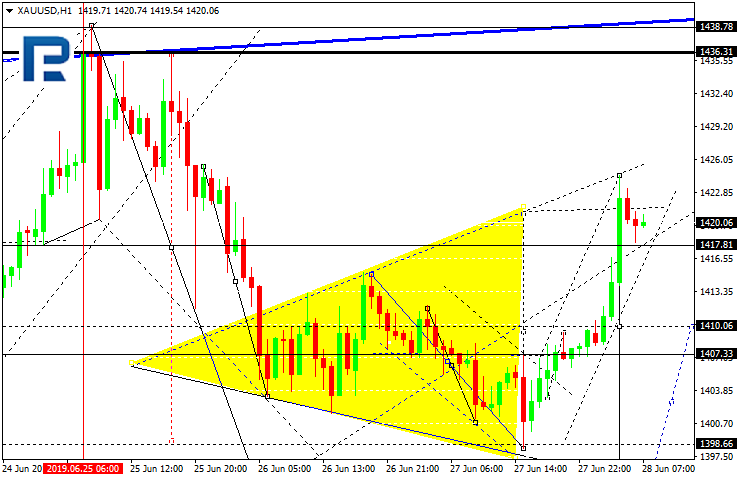
Gold is consolidating around 1407.33 and forming Divergent Triangle pattern; the price has reached its upside border. Today, the pair may form a new descending structure with the first target at 1395.78.

GOLD_Технический анализ
Risk Warning: the result of previous trading operations do not guarantee the same results in the future

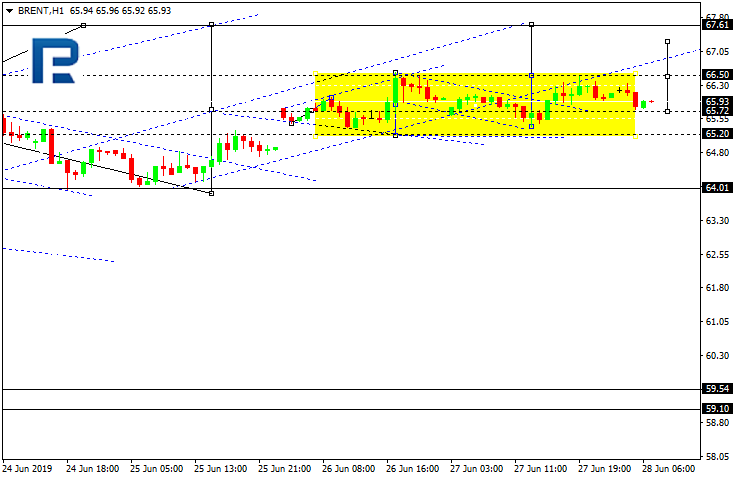
BRENT

Brent is still consolidating around 65.65 without any particular direction. If later the price breaks the range to the upside, the instrument may continue trading inside the uptrend to reach 67.67; if to the downside – start a new correction with the target at 64.00.

BRENT_Технический анализ

Article By RoboForex.com

Attention!
Forecasts presented in this section only reflect the author’s private opinion and should not be considered as guidance for trading. RoboForex LP bears no responsibility for trading results based on trading recommendations described in these analytical reviews.