The pharmaceutical stock enjoyed a large boost, thanks largely to FDA approval of its supplemental new drug application for DOPTELET for treatment of chronic immune thrombocytopenia.
Dova Pharmaceuticals Inc. (DOVA:NASDAQ) announced some good news in a press release on June 27, stating: “The U.S. Food and Drug Administration (FDA) approved a supplemental New Drug Application (sNDA) that expands the use of DOPTELET (avatrombopag) to include the treatment of thrombocytopenia in adults with chronic immune thrombocytopenia (ITP) who have had an insufficient response to a previous treatment.”
The market responded to the news by driving the stock price 35% higher, opening at $14.26 the day after a $10.59 close.
Dr. David Zaccardelli, president and CEO of Dova, commented: “In addition to offering patients with ITP a new treatment option, we expect DOPTELET will also address an important unmet medical need in the market.”
For the pharmaceutical company whose stated goal is “acquiring, developing and commercializing drug candidates for diseases where there is a high unmet medical need,” the expanded FDA approval is a big win.
Disclosure: 1) Kevin Jaillet compiled this article for Streetwise Reports LLC and is an employee of Streetwise Reports. He or members of his household own securities of the following companies mentioned in the article: None. He or members of his household are paid by the following companies mentioned in this article: None. 2) The following companies mentioned in this article are billboard sponsors of Streetwise Reports: None. Click here for important disclosures about sponsor fees. The information provided above is for informational purposes only and is not a recommendation to buy or sell any security. 3) Comments and opinions expressed are those of the specific experts and not of Streetwise Reports or its officers. 4) The article does not constitute investment advice. Each reader is encouraged to consult with his or her individual financial professional and any action a reader takes as a result of information presented here is his or her own responsibility. By opening this page, each reader accepts and agrees to Streetwise Reports’ terms of use and full legal disclaimer. This article is not a solicitation for investment. Streetwise Reports does not render general or specific investment advice and the information on Streetwise Reports should not be considered a recommendation to buy or sell any security. Streetwise Reports does not endorse or recommend the business, products, services or securities of any company mentioned on Streetwise Reports. 5) From time to time, Streetwise Reports LLC and its directors, officers, employees or members of their families, as well as persons interviewed for articles and interviews on the site, may have a long or short position in securities mentioned. Directors, officers, employees or members of their immediate families are prohibited from making purchases and/or sales of those securities in the open market or otherwise from the time of the interview or the decision to write an article until three business days after the publication of the interview or article. The foregoing prohibition does not apply to articles that in substance only restate previously published company releases.
Expectations for the project report and speculation about recent trading activity are given in an iA Securities report.
In a June 25 research note, iA Securities analyst George Topping reported that Rubicon Minerals Corp. (RBY:NYSE.MKT; RMX:TSX) intends to release the preliminary economic assessment (PEA) on its Phoenix gold project in Q3/19.
Topping noted that much of the necessary aboveground infrastructure at the Red Lake, Ontario asset is already there, including offices, the mill, the electric substation and the tailings management facility. Underground, 14,000 meters (14,000m) are already developed along with an operational shaft descending 730 meters below the surface.
“Given all the existing infrastructure, we estimate a low CA$100 million in start-up capex to get to an 88,000 ounces of gold per year, US$860 per ounce all-in sustaining cost operation,” wrote Topping. Production expansions would follow. At a gold price of CA$1,875 per ounce, the project would yield a 42% internal rate of return, or CA$2.50 per share target return, annually, according to IA Securities’ base case. However, successful exploration efforts could boost that to CA$4.20 per share.
Topping highlighted that while Rubicon continues to derisk Phoenix, the stock price has not responded accordingly but, rather, has dropped. Specifically, it decreased 7% in the past seven days and 36% in the past three months.
The analyst indicated the downward movement began in April when equity holders came off restriction following the company’s CA$7 million flow-through financing. Then the rumor that Newmont Goldcorp might sell the Campbell mine in Red Lake added uncertainty. As for other contributors, Topping said, “We postulate with the gold price rising, some holders, institutional and retail, may be selling their smaller cap names to reallocate capital to large caps golds, which typically move first before the junior gold companies.”
Topping concluded that at a current share price of about CA$0.79, the downside risks to Rubicon are minimal, and the company has a solid management team with an advanced gold project in an established mining camp. It has capital for its 2019 exploration project, a PEA being released next quarter and the potential to restart Phoenix by late 2020.
As such, iA Securities has a Buy rating and a CA$2.50 per share price target on Rubicon.
Disclosure: 1) Doresa Banning compiled this article for Streetwise Reports LLC and provides services to Streetwise Reports as an independent contractor. She or members of her household own securities of the following companies mentioned in the article: None. She or members of her household are paid by the following companies mentioned in this article: None. 2) The following companies mentioned in this article are billboard sponsors of Streetwise Reports: None. Click here for important disclosures about sponsor fees. 3) Comments and opinions expressed are those of the specific experts and not of Streetwise Reports or its officers. The information provided above is for informational purposes only and is not a recommendation to buy or sell any security. 4) The article does not constitute investment advice. Each reader is encouraged to consult with his or her individual financial professional and any action a reader takes as a result of information presented here is his or her own responsibility. By opening this page, each reader accepts and agrees to Streetwise Reports’ terms of use and full legal disclaimer. This article is not a solicitation for investment. Streetwise Reports does not render general or specific investment advice and the information on Streetwise Reports should not be considered a recommendation to buy or sell any security. Streetwise Reports does not endorse or recommend the business, products, services or securities of any company mentioned on Streetwise Reports. 5) From time to time, Streetwise Reports LLC and its directors, officers, employees or members of their families, as well as persons interviewed for articles and interviews on the site, may have a long or short position in securities mentioned. Directors, officers, employees or members of their immediate families are prohibited from making purchases and/or sales of those securities in the open market or otherwise from the time of the interview or the decision to write an article until three business days after the publication of the interview or article. The foregoing prohibition does not apply to articles that in substance only restate previously published company releases. As of the date of this article, officers and/or employees of Streetwise Reports LLC (including members of their household) own securities of Newmont Goldcorp, a company mentioned in this article.
Disclosures from iA Securities, Rubicon Minerals Corp., Research Update, June 25, 2019
Conflicts of Interest: The research analyst and or associates who prepared this report are compensated based upon (among other factors) the overall profitability of iA Securities, which may include the profitability of investment banking and related services. In the normal course of its business, iA Securities may provide financial advisory services for the issuers mentioned in this report. iA Securities may buy from or sell to customers the securities of issuers mentioned in this report on a principal basis.
Analyst’s Certification: Each iA Securities research analyst whose name appears on the front page of this research report hereby certifies that (i) the recommendations and opinions expressed in the research report accurately reflect the research analyst’s personal views about the issuer and securities that are the subject of this report and all other companies and securities mentioned in this report that are covered by such research analyst and (ii) no part of the research analyst’s compensation was, is, or will be directly or indirectly, related to the specific recommendations or views expressed by such research analyst in this report.
Analyst Trading: iA Securities permits analysts to own and trade in the securities and or the derivatives of the issuer under their research coverage, subject to the following restrictions. No trades can be executed in anticipation of coverage for a period of 30 days prior to the issuance of the report and 5 days after the dissemination of the report to our clients. For a change in recommendation, no trading is allowed for a period of 24 hours after the dissemination of such information to our clients. A transaction against an analyst’s recommendation can only be executed for a reason unrelated to the outlook of the stock for the issuer and with the prior approval of the Director of Research and the Chief Compliance Officer.
Company Related Disclosures: Franco-Nevada: The analyst has visited the issuer’s operations. No payment or reimbursement was received from the issuer for the associated travel costs.
In the past 12 months, Industrial Alliance Securities Inc., its officers, directors, or analysts involved in the preparation of this report has provided services to the issuer for remuneration other than normal course investment advisory or trade execution services.
This young company features projects in established prolific and mining-friendly areas.
In the few years that Black Tusk Resources Inc. (TUSK:CSE; BTKRF:OTC) has been aroundit was formed in 2016 and went public in November 2017it has managed to procure two projects in highly prolific areas of Canada. The company’s flagship project, Golden Valley, sits in the Abitibi Greenstone Belt in western Quebec, not far from the Ontario border. The Abitibi has produced more than 100 mines and 170 million ounces of gold since the early 1900s. Quebec is considered a mining-friendly jurisdiction, ranking fourth on the Fraser Institute’s Mining Investment Attractiveness Index.
Golden Valley is located a mere 26 kilometers south of the Casa Berardi Mine, which is 100%-owned by Hecla Mining Company. That underground mine has produced more than 1.9 million recovered gold ounces since 1988, and is expected to produce about 150,000 ounces of gold at a cash cost of roughly $850/ounce this year.
“The charts for Black Tusk show outstanding strength.” – Clive Maund
The 1,850-hectare Golden Valley project has seen historical drilling, and one highlight hole drilled by Noranda Inc., LAB87-B2, returned:
0.91 gram per tonne (g/t) gold over 13.3 meters (51.3 meters to 64.6 meters), including 1.82 g/t gold over 4.5 meters from 57 meters to 61.5 meters, including:
1.4 g/t gold from 57 meters to 58.5 meters;
2.15 g/t gold from 58.5 meters to 60 meters;
1.90 g/t gold from 60 meters to 61.5 meters.
Another hole, LAB109-03-01, drilled by Noranda in 2004, returned:
1.40 g/t gold from 51.3 meters to 52 meters;
0.51 g/t gold from 107.3 meters to 108.2 meters in iron formation within basalt;
1.25 g/t gold from 109.5 meters to 112.1 meters, including:
0.99 g/t gold from 109.5 meters to 110.2 meters in iron formation within basalt;
2.49 g/t gold from 110.2 meters to 111.1 meters in iron formation within basalt;
0.32 g/t gold from 111.1 meters to 112.1 meters in iron formation within basalt.
The drill holes are close to roads and accessible.
“Over 4,000 meters of historical drilling has been conducted at Golden Valley, so we know that gold mineralization is there,” Black Tusk CEO Richard Penn told Streetwise Reports. “The Laberge Deformation Zone, which is similar to the gold-bearing Casa Berardi Fault structure, passes through the property.” Gold mineralization intersected in historical diamond drilling on the Golden Valley project has never been followed up, even though the site is accessible.
“Most of the drill pads are really easy to access. We are essentially drilling only about 330 meters off the side of the road, so we can just pull up with equipment. We don’t have to fly helicopters,” Penn explained.
“The site has infrastructureroads, power, waterand a local labor pool,” Penn added.
On June 10, Black Tusk reported that it received a drill permit to construct 15 drill pads on the Golden Valley property and followed up by announcing on June 24 that it expects to begin diamond drilling on July 18. “These drill stations will allow for the testing of two gold-bearing structures as outlined by historic work previously undertaken by other companies,” the company stated.
The first stage of drilling will have two targets: target 1 is designed to “verify and expand upon the presence of a gold-bearing shear zone intercepted in prior drill programs,” while target 2’s proposed drilling is designed to “verify and expand upon the presence of gold-bearing iron formation structure intercepted in prior drill programs,” the company announced. Stage 1 drilling will comprise up to 1,500 meters over 10 sites.
Stage 2, the company noted, is “planned to follow up on results of the stage 1 drilling and is scheduled to begin after all of the samples have been analyzed and the data has been synthesized and interpreted. Stage 2 drilling will expand upon significant results obtained from stage 1.”
“We expect to get drill results back in August, and can do additional drilling in September, guided by the assays,” Penn explained.
Black Tusk’s second project, Goldsmith, is across Canada in British Columbia, in the Kootenays region. The area has seen mineral exploration as far back as 1865. The 885-hectare site benefits from infrastructure such as year-round highway access and water, and the power grid is just 14.5 km away.
“Goldsmith is a high-grade gold property, a nuggety style of deposit that is close to surface,” Penn explained. “We went in there last fall with excavators and did a big trenching program and we got some really good numbers, 14.42 g/t, 5/26 g/t and 5/34 g/t.” Results from rock sampling returned assays as high as 29.89 g/t, 13.34 g/t and 9.61 g/t. Historical rock sampling has returned some eye-popping results along the lines of 9901.8 g/t, 197.16 g/t and 140.16 g/t.
Despite these high numbers, this summer Black Tusk is turning its attention this summer to Golden Valley, and will further explore Goldsmith at a later time.
Industry observers have their eyes on Black Tusk. Technical analyst Clive Maund wrote on CliveMaund.com on May 20, “the charts for Black Tusk show outstanding strength, to the extent that it is worth going for without delay and this is a good candidate to switch to from weaker stocks. . . Black Tusk is rated an immediate strong buy at the current favorable price (CA$0.15).” Black Tusk shares are currently trading at around CA$0.15.
Bob Moriarty wrote last year on 321 Gold, “At the very least the company is interesting. They are in a gold district, they did a very cheap deal on the project and have a tiny number of shares.”
Black Tusk has approximately 25 million shares outstanding, 30 million fully diluted, “which is extremely tight; the average company of the Canadian Securities Exchange has 65 million shares outstanding,” Penn stated. Insiders hold about 20% of the shares. The company trades on the CSE in Canada under the symbol TUSK and OTC in the United States under the symbol BTKRF.
Penn stressed that investors won’t have to wait a long time before they find out what Black Tusk has in the ground. “We have our permits to drill and will begin to drill July 18. We should have all our results in August. Everything will be rolled out in the next two to three months.”
Disclosure: 1) Patrice Fusillo compiled this article for Streetwise Reports LLC and provides services to Streetwise Reports as an employee. She or members of her household own securities of the following companies mentioned in the article: None. She or members of her household are paid by the following companies mentioned in this article: None. 2) The following companies mentioned in this article are billboard sponsors of Streetwise Reports: None. Click here for important disclosures about sponsor fees. As of the date of this article, an affiliate of Streetwise Reports has a consulting relationship with Black Tusk Resources. Please click here for more information. 3) Comments and opinions expressed are those of the specific experts and not of Streetwise Reports or its officers. The information provided above is for informational purposes only and is not a recommendation to buy or sell any security. 4) The article does not constitute investment advice. Each reader is encouraged to consult with his or her individual financial professional and any action a reader takes as a result of information presented here is his or her own responsibility. By opening this page, each reader accepts and agrees to Streetwise Reports’ terms of use and full legal disclaimer. This article is not a solicitation for investment. Streetwise Reports does not render general or specific investment advice and the information on Streetwise Reports should not be considered a recommendation to buy or sell any security. Streetwise Reports does not endorse or recommend the business, products, services or securities of any company mentioned on Streetwise Reports. 5) From time to time, Streetwise Reports LLC and its directors, officers, employees or members of their families, as well as persons interviewed for articles and interviews on the site, may have a long or short position in securities mentioned. Directors, officers, employees or members of their immediate families are prohibited from making purchases and/or sales of those securities in the open market or otherwise from the time of the interview or the decision to write an article until three business days after the publication of the interview or article. The foregoing prohibition does not apply to articles that in substance only restate previously published company releases. As of the date of this article, officers and/or employees of Streetwise Reports LLC (including members of their household) own securities of Black Tusk Resources, a company mentioned in this article.
Additional Disclosures: Bob Moriarty, 321 Gold: Bob Moriarty: I, or members of my immediate household or family, own shares of the following companies mentioned in this article: None. Black Tusk Resources is an advertiser on 321 Gold.
CliveMaund.com: Clive Maund does not own shares of Black Tusk and neither he nor his company has been paid by Black Tusk.
Impressions from the tour and what they mean for the next resource estimate update are presented in a CIBC report.
In a June 21 research note, analyst Bryce Adams reported that CIBC raised its target price on Osisko Mining Inc. (OSK:TSX) to CA$4.50 per share from CA$3.50. In comparison, the company’s stock is currently trading at around CA$3.30 per share.
The increased target comes after CIBC visited Osisko’s Windfall project in Quebec for the first time on June 20 but before the H2/19 release of the updated resource estimate on it.
One of the key takeaways from the site visit, Adams said, was that it is clear upside exists “well beyond the conservative preliminary economic assessment” that outlined 8.9 million tons (8.9 Mt) at 6.68 grams per ton (6.68 g/t), or 1.9 million ounces (1.9 Moz), in light of a maiden resource of 13 Mt at 6.68 g/t, or 2.9 Moz. Thus, the analyst added, the resource estimate “has the potential to positively influence resource grade and tonnage.”
Adams pointed out that the updated resource estimate for Windfall, likely to be released in Q4/19, will encompass a significant amount of infill drilling along with some expansion drilling. Also of note, a single top cut will replace the triple capping used in previous updates. “With this change and infill drilling completed, we see potential for about 15% higher resource grades,” he wrote. “Furthermore, we see resource expansion and more detailed mine planning potential with the feasibility study,” expected in H2/20.
The other impression of Windfall, Adams noted, was that it was bustling with activity, with about 240 people there, 22 drills running and underground development in progress.
Disclosure: 1) Doresa Banning compiled this article for Streetwise Reports LLC and provides services to Streetwise Reports as an independent contractor. She or members of her household own securities of the following companies mentioned in the article: None. She or members of her household are paid by the following companies mentioned in this article: None. 2) The following companies mentioned in this article are billboard sponsors of Streetwise Reports: None. Click here for important disclosures about sponsor fees. 3) Comments and opinions expressed are those of the specific experts and not of Streetwise Reports or its officers. The information provided above is for informational purposes only and is not a recommendation to buy or sell any security. 4) The article does not constitute investment advice. Each reader is encouraged to consult with his or her individual financial professional and any action a reader takes as a result of information presented here is his or her own responsibility. By opening this page, each reader accepts and agrees to Streetwise Reports’ terms of use and full legal disclaimer. This article is not a solicitation for investment. Streetwise Reports does not render general or specific investment advice and the information on Streetwise Reports should not be considered a recommendation to buy or sell any security. Streetwise Reports does not endorse or recommend the business, products, services or securities of any company mentioned on Streetwise Reports. 5) From time to time, Streetwise Reports LLC and its directors, officers, employees or members of their families, as well as persons interviewed for articles and interviews on the site, may have a long or short position in securities mentioned. Directors, officers, employees or members of their immediate families are prohibited from making purchases and/or sales of those securities in the open market or otherwise from the time of the interview or the decision to write an article until three business days after the publication of the interview or article. The foregoing prohibition does not apply to articles that in substance only restate previously published company releases.
Disclosures from CIBC, Osisko Mining Inc., June 21, 2019
Analyst Certification: Each CIBC World Markets Corp./Inc. research analyst named on the front page of this research report, or at the beginning of any subsection hereof, hereby certifies that (i) the recommendations and opinions expressed herein accurately reflect such research analyst’s personal views about the company and securities that are the subject of this report and all other companies and securities mentioned in this report that are covered by such research analyst and (ii) no part of the research analyst’s compensation was, is, or will be, directly or indirectly, related to the specific recommendations or views expressed by such research analyst in this report.
Analysts employed outside the U.S. are not registered as research analysts with FINRA. These analysts may not be associated persons of CIBC World Markets Corp. and therefore may not be subject to FINRA Rule 2241 restrictions on communications with a subject company, public appearances and trading securities held by a research analyst account.
Potential Conflicts of Interest: Equity research analysts employed by CIBC World Markets Corp./Inc. are compensated from revenues generated by various CIBC World Markets Corp./Inc. businesses, including the CIBC World Markets Investment Banking Department. Research analysts do not receive compensation based upon revenues from specific investment banking transactions. CIBC World Markets Corp./Inc. generally prohibits any research analyst and any member of his or her household from executing trades in the securities of a company that such research analyst covers. Additionally, CIBC World Markets Corp./Inc. generally prohibits any research analyst from serving as an officer, director or advisory board member of a company that such analyst covers.
In addition to 1% ownership positions in covered companies that are required to be specifically disclosed in this report, CIBC World Markets Corp./Inc. may have a long position of less than 1% or a short position or deal as principal in the securities discussed herein, related securities or in options, futures or other derivative instruments based thereon.
Recipients of this report are advised that any or all of the foregoing arrangements, as well as more specific disclosures set forth below, may at times give rise to potential conflicts of interest.
Important Disclosure Footnotes for Osisko Mining Inc. (OSK)
· CIBC World Markets Inc. expects to receive or intends to seek compensation for investment banking services from Osisko Mining Inc. in the next 3 months.
A subscriber recently mentioned getting into a real estate ETF so we started going over the data which may suggest the Real Estate sector could become the next big trade over the next 12+ months. The news that the US Fed may decrease rates in an attempt to front-run global economic weakness and real estate market weakness may result in a waterfall event in local and regional real estate markets. This type of event could become a fantastic trading opportunity for technical traders.
Overall, our research has been focused on one of the hottest markets anywhere in the US, California. Los Angeles, Ventura County, Orange County, San Diego, and San Francisco make up the entire massive Southern California real estate market. The California real estate market is a fairly strong indicator for weaker market segments because the number of transactions taking place across the 400+ miles spanning San Francisco to San Diego represent multiple trillions of dollars, vast segments of consumers and types of housing as well as an incredibly diverse economic landscape ranging from coastal regions, farming regions, cities, technology hubs, agriculture and dozens of others (source).
Our concern is that a rate decrease by the US Fed may be interpreted as a “move to attempt to abate fear” instead of a “move to support the markets”. If this decrease in rates does happen and at-risk homeowners fear the Fed is trying to push buttons to adjust the consumer environment toward a “buying bias” and sellers become scared, then the race to sell faster (decreasing prices to attract buyers) may become the norm. In other words, in an effort to support the markets, the Fed could take actions that remove the floor from the markets as sellers attempt to get the best price possible before buyers become aware of the “race to the bottom” in terms of pricing.
At-risk homeowners are under increasing pressures as pricing, income and other expenses seem to have wreaked havoc with what was a traditionally strong real estate market just three years ago. It appears the Fed has raised rates just enough to start to show the cracks in the dam in Orange County and LA County, California. The increasing number of blue dots, as well as the continue “price drops” in these areas, are a very clear sign that the “hot market” is now just “mildly warm and cooling fast”. Prices are past the peak and are already starting to decline fairly rapidly.
Additionally, delinquency levels for commercial and industrial loans are starting to rise dramatically – much like what happened in 2007 – just months before the credit market crash in 2008. Commercial and Industrial loan delinquencies rose sharply from 1.14 in Q2 2007 to 1.45 in Q1 2008 – eventually peaking at 447 in Q3 2009. Currently, Delinquency levels are at 1.17 – up from 0.93 for Q4 2018. If this trend continues past September, we could be looking at a very different real estate economic picture by the end of 2019 or early 2020 (Source).
CONCLUDING THOUGHTS:
Our interpretation of the US housing market is that buyers are becoming more opportunistic as they are watching the markets and watching how sellers are dropping prices in an attempt to attract a sale. Buyers have not seen this type of activity since early 2007-08 or so when sellers were getting desperate to get out of their homes near the top of the market. At the same time, watching how sellers attempt to push their home into the hands of buyers creates a shifting dynamic in the Real Estate market. All the sudden it went from a seller’s market and is now shifting into a buyers market.
The rates of delinquencies, consumer confidence, and levels of disposable income all factor into the market’s reactions to price and sales activity. When buyers believe it is opportunistic to buy, they will move mountains to attempt to acquire a home or an asset. When buyers believe it is not opportunistic to buy an asset, they will likely decide to wait for a more opportunistic time to make their purchase.
In part II of this article, we will share our research that highlights the incredible trade setup related to the Real Estate market and how technical traders can position their portfolios for this move.
I can tell you that huge moves are about to start unfolding not only in real estate, but metals, stocks, and currencies. Some of these super cycles are going to last years. Brad Matheny goes into great detail with his simple to understand charts and guide about this. His financial market research is one of a kind and a real eye-opener. PDF guide: 2020 Cycles – The Greatest Opportunity Of Your Lifetime
As a technical analysis and trader since 1997, I have been through a few bull/bear market cycles. I believe I have a good pulse on the market and timing key turning points for both short-term swing trading and long-term investment capital. The opportunities are massive/life-changing if handled properly.
I urge you to visit my Wealth Building Newsletter and if you like what I offer, join me with the 1 or 2-year subscription to lock in the lowest rate possible, get a FREE BAR OF GOLD and ride my coattails as I navigate these financial market and build wealth while others lose nearly everything they own during the next set of crisis’.
Saudi Arabia’s CEO Amin Nasr’s message to the press that oil flows to the market are guaranteed, should be taken with a pinch of salt.
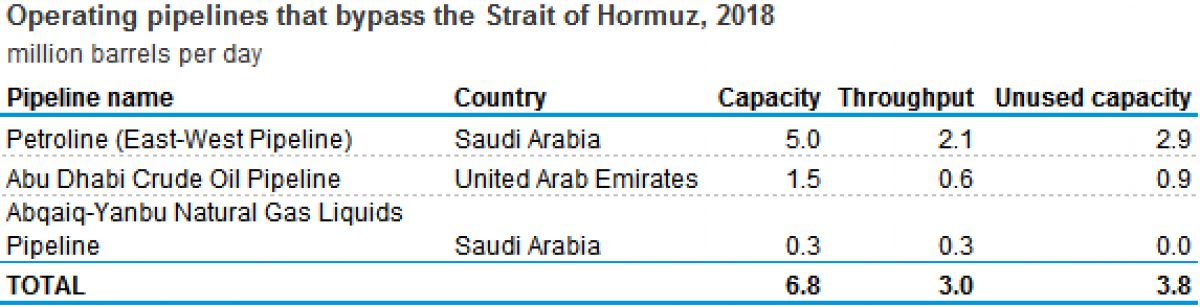
Looking at the current volatility in the Persian/Arabian Gulf and the possibility of a temporary closure of the Strait of Hormuz, the Aramco CEO’s message might be a bit overoptimistic. In reality, Aramco will not be able to keep the necessary crude oil and products volumes flowing to Asian and European markets in the case of a full Strait of Hormuz blockade. Even that Aramco owns and operates a crude oil pipeline with a capacity of 5 million bpd, carrying crude 1,200 kilometers between the Arabian Gulf and Red Sea, much more is needed to keep the oil market stable.
Nasr’s move to stabilize the market is praiseworthy but should be seen as an attempt to quell fears of traders and financial analysts, especially just before the OPEC+ meeting in Vienna next week. Nasr reiterated that Aramco (aka the Kingdom) is able to supply sufficient crude through the Red Sea, reiterating that the necessary pipeline and terminal infrastructure is there. However, what analysts tend to forget, Nasr’s statement is only linked to Saudi’s oil export volumes, which will likely be not higher this summer than around the level this pipeline can support. The real issue, if it comes to a full-blown conflict, is that not only Saudi oil is being threatened.
At present, between 20-21 million bpd of crude and petroleum products are transported via the Strait of Hormuz. Saudi exports are a vast part of it, but also the UAE, Iraq, Kuwait, Bahrain, Qatar and Iran, will have to look at additional routes. A closure or military action in the region will cause a temporary disruption for all maritime traffic. Besides the options that are the already on the table, such as the Saudi onshore pipeline and the UAE’s Fujairah pipeline, no other real alternatives are available, as overland trucking or rail transport is minimal. Transferring volumes via the Saudi and UAE’s pipelines is not an option at all, as the total capacity of the two is less than 10 million bpd, representing not even 50% of the current maritime flows through Hormuz. Another thing that should be noted is that pipelines can’t ship crude and crude products at the same time.
Another consequence of a blockade would be that most available VLCCs and other tankers will either be in the Persian Gulf (and blocked) or will not be able to be rerouted. Before the market will have found a solution for this, days and probably weeks will have gone by, and a price spike for all products is to be expected. This will likely also be the case for LNG and other commodity flows.
Few analysts are talking about oilfield security and pipeline availability. Any military advisor will put these options as part of his or her 1st phase military action plan. If Iran were to be attacked, or faces a surgical strike by an opponent, all Arab oil and gas infrastructure will become a legitimate offensive target (at least in the eyes of Tehran and its proxies). Geographically seen, Tehran has been dealt the best cards. Looking at the majority of oil and gas production assets and infrastructure in the Arab world, especially in Saudi Arabia, UAE or even Iraq, everything is in reach of short-distance missiles, fighter jets and even drones. Any move against Iran will result in a full-scale attack on Saudi’s Eastern Province (which produces 80% of all its oil and gas), Abu Dhabi’s offshore oil infrastructure and the regional pipelines. Looking at history, denying energy access and diminishing the opponents stability is a no-brainer in military strategy.
It can be taken for granted that Iran, the Houthis, Hezbollah and others, already have prepared their oil and gas infrastructure strategy. Washington, Riyadh, Abu Dhabi and even Manama, will be frantically looking for answers, but the geographical situation is disastrous.
Quelling fears in the market is the right thing to do, but reality also needs to be addressed. Nasr’s message is that of an oil company CEO, taking all precautions to deal with a calamity. ADNOC’s Sultan will be doing the same. Still, the oil market is at present a victim of geopolitical power projections of emotional leaders superseding rationality. This confrontation is one of a possibly unprecedented order, not for oil (as sceptics again will state) but with oil as a weapon for defeat or survival. The continuing reference to the Iran-Iraq tanker war during 1980-1988 is out of touch with reality. At this time, it is not going to be Iran denying support or trade with Iraq, but a possible Arab-Iranian confrontation, led by the USA if no countermeasures are being implemented.
Asian consumers will need to prepare for severe price hikes in the most optimistic scenario, but also for a shutdown of vast parts of their economy. Hormuz will not be standing on its own, more is to be taken into account, especially proxy reactions in Yemen (Gulf of Aden) or East Med (Hezbollah). Negative repercussions for Europeans are also in the picture. Saudi Arabia can do a lot, but saving the global economy if the Gulf explodes is not one of their capabilities.
Welcome to this week’s Market Wrap Podcast, I’m Mike Gleason.
Coming up we have an interview with Greg Weldon that you absolutely are not going to want to miss. Hear what Greg has to say now about gold after accurately predicting the recent breakdown point to the dollar on this very podcast a little over a month ago. We’ll also get his thoughts on lagging silver, hear his breakdown the generational high we’re seeing in the gold to silver ratio right now and why he is on the verge of making a major trading decision in the white metal ahead of a big move he sees coming. All that and more coming up in our interview with Greg Weldon, right after this week’s market update.
Precious metals markets are set to close out the week, the month, and the quarter with underlying strength building for some big moves ahead.
The standout performer this month has been gold, breaking above $1,400 an ounce. Meanwhile, the raging palladium bull market is still powering ahead – with prices on the verge of posting new all-time highs. Even the lagging metals, silver and platinum, are showing signs of lifting off major bottoms.
For the week, gold is up 0.9% to bring spot prices to $1,412 an ounce. Silver shows a weekly decline of 0.5% to trade at $15.33. Platinum looks higher by 2.6% since last Friday’s close to come in at $834 per ounce. And finally, palladium trades near a record high this Friday morning at $1,557 thanks to this week’s 4.5% advance.
Although there could be summer doldrums and a period of consolidation coming up for precious metals, the longer-term technical and fundamental outlook appears to be quite favorable. Bulls are anticipating the Federal Reserve’s full capitulation to easy money policies as soon as the FOMC’s next meeting in July.
President Donald Trump went on quite a series of rants this week aimed at the Fed. He minced no words in calling for lower interest rates, an end to Quantitative Tightening, and a weaker U.S. dollar. He even implied that he might take the unprecedented step of firing or demoting the Fed chairman.
Predictably, CNBC, CNN, and the rest of the mainstream media went nuts. Even Trump-friendly Maria Bartiromo of Fox Business was taken aback by the President’s language:
CNBC Anchor: In an interview with NBC’s Meet the Press, President says he never threatened to demote Powell, but he has the power to do so if he wanted, which kind of felt like a threat. Here’s what he had to say.
Donald Trump: What he’s done is 50 billion a month in Quantitative Tightening. That’s ridiculous.
CNN Anchor: And this President very publicly is trying to send the signal that he wants lower rates. He said he wants Mario Draghi to be the Fed chief, because in Europe they are talking about stimulus and cutting rates.
Maria Bartiromo (Fox Businees): Why do we need interest rates to go lower? Why do we need a cut in rates if things are going so well, Mr. President?
Donald Trump: For one thing, we have a lot of debt. I want to get it out, I want to pay it off. We have a lot of debt. But what we really have is, we need to stay even with these people. These people are devaluing their currency because they’re not doing well against us. So they devalue and we can’t. We are no longer on a level playing field. As they reduce their currency in order to take advantage of the United States, we have a man that doesn’t do anything for us. We’re sitting there and we stay. He should have never raised the rates to the level that he raised them and I’ve been right on that.
Maria Bartiromo (Fox Businees): He said he’s not going to get pushed around by political… he basically suggested yesterday I’m not going to get pushed around.
Donald Trump: So he’s trying to prove how tough he is because he’s not going to get pushed around. Here’s a guy, nobody ever heard of him before, and now I made him and he wants to show how tough he is. Okay? Let him show how tough he is. I have the right to demote him. I have the right to fire him.
Reporter at Press Conference: Could you clarify what you would do if the president Tweets or calls you to say he would like to demote you as Fed chair?
Jerome Powell: I think the law is clear, that I have a four-year term and I fully intend to serve it.
The fate of the Fed chair and the direction of monetary policy in the months ahead could determine the outcome of the 2020 election.
This week President Trump’s numerous potential challengers on the Democratic side took to the debate stage. While the candidates sparred on some personal matters and policy details, they all seem to agree that the government needs to spend trillions of dollars more than it already does.
Senator Bernie Sanders wants to spend $1.6 trillion to cancel the student loan debt of 45 million borrowers. Beto O’Rourke wants to spend $5 trillion on “climate change.” Elizabeth Warren wants to spend trillions more on a government-run healthcare system to replace private insurance.
Joe Biden is peddling slightly less expensive versions of each of these schemes. But even his proposals would cost trillions of dollars that the government doesn’t have – and push the economy much closer to centrally planned socialism than free-market capitalism.
It seems that Bernie Sanders’ socialist ideas – once regarded as fringe – are now mainstream among Democrats. Even if Sanders loses in the primaries, he has already won in terms of pushing his issues. The eventual Democrat nominee will likely embrace 90% of his agenda.
Democrats are currently talking about a wealth tax and new taxes on Wall Street to pay for their spending ambitions. But they can’t even pay for all the spending that Congress has already committed to. Not with taxes, anyway.
The only way the math of trillion-dollar deficits, which are already projected, plus trillions in new spending commitments adds up is by factoring in a huge expansion of the currency supply. In effect, Democrats are counting on easy money and Quantitative Easing from the Fed. It’s the same thing Trump is counting on to get re-elected.
All our policy debates are now predicated on the central bank’s artificial stimulus. For an institution that was supposedly founded to be above politics, the Federal Reserve is actually driving the political spectacle of a major party turning socialist.
In what kind of world would a national debt of $22 trillion cause politicians to believe the government can and should spend trillions more? Only in a world of unlimited fiat money.
The supply of Federal Reserve notes will continue growing relentlessly regardless of who wins the 2020 election. But neither politicians nor central bankers will be able to similarly inflate the supply of physical precious metals.
Well now, without further delay, let’s get to this week’s exclusive and explosive interview.
Mike Gleason: It is my privilege now to welcome in Greg Weldon, CEO and President of Weldon Financial. Greg has decades of market research, and trading experience specializing in the metals, and commodity markets and even authored a book back in 2006, titled Gold Trading Bootcamp where he accurately predicted the implosion of the U.S. credit market, and urge people to buy gold when it was only $550 an ounce. Greg is one of our favorite guests here on the money metals podcast and it’s great to have them back on.
Greg, thanks for the time again and welcome. How are you?
Greg Weldon: Great, my pleasure, Mike, how you doing?
Mike Gleason: Doing very well. Well, Greg, I want to commend you first off because you absolutely were all over this move in gold. We talked to you back in early May, and you told us that silver and the industrial metals would lag, which they have. And meanwhile, despite that sluggishness and the overall metal sector, you were impressed with how gold was doing based on the fact that the dollar wasn’t breaking down at the time, but you were anticipating that it would. And then gold, if it could get above $1,344, that people would want to be involved because we could see some real fireworks in a big move from there. So fast forwarding a bit, we saw gold move up in that range in early June, and it flirted with that key level of $1,344, that you spoke about for a couple of weeks. And the first close we finally got above $1,344, was last Tuesday, June 18th to close it about four $1,347 from what I saw.
And just like you said back in early May like clockwork, we then saw it gained like $80 immediately in the four or five trading days that followed that June, 18th close. So, well done on that one Greg, I’ve got to commend you again. So here we are now as we’re talking on Wednesday afternoon, we’ve seen a bit of a pause on this rally. We’re still looking at a spot price about $1,400. So now I’ll ask you what you’re looking for going forward for gold. Does the rally continue? And do we match towards $1,500 and beyond, or do we see a pullback?
Greg Weldon: Well, let’s go short term first, and then backtrack because where we are right now, the high this week in the futures contract, $1,433, if you go back the interim high during the decline off the 2011 secular high, you hit an interim low in the middle of 2013 and you had a counter, what was then a counter trend rally? The high there was $1,429. So, it’s interesting, you’re $1,429, six years ago and you’re $1,433, here and you have something of a pullback, you have something of reversal, two days left in the week, this could end up being kind of a reversal week. So yeah, it could pull back, but I think that this is not really enough of a resistance level to bail on positions. I think this pullback if it were to materialize would probably be a buying opportunity.
I could see support in the $1,360/65 area. I mean, you may not even get below $1,380, and you’re already at $1,410. So another $30 down doesn’t really seem like much. But for me in this first leg of this next big secular leg of this bull market, which really we could track all the way back to 1971 frankly, and this will be wave five of this gigantic secular, long-term bull market would be $1,555. So, you have further upside here, the risk-reward if you’re not long already has been skewed. So, it’s not the same really favorable risk-reward that we had back in – whether you’re talking about June, July – I mean this has been a process, and it has been one that has mapped out with all humility, almost precisely as we suggested it would. We said it would take patience to get to this point because really what we saw in late May, early June and in through August in particular (last year) when it really started to become visible, was the gold market de-linking from the dollar.
And when the dollar kept rallying, and gold was holding like a Rockstar at like $1,260-ish. That to me was the final piece of the puzzle. We said back in August, I did two major pieces in August, one of which was called a Bridge Too Far, and that was talking about the Fed and suggesting the Fed would actually keep raising rates into December. Taking a bridge too far, meaning one rate hiked too many, too far beyond what neutral really was. And if Powell wanted to get to neutral, and they went too far, they’d actually be a little tight, and that would set the stage for reversal of the Fed, bring the dollar into play. And that is the way this has played out in 2019. In the bigger picture dynamic though, the fact that gold held there a $1,266 or so when the dollar was making new highs, threatening to go back above 100, I mean the relative price of gold should have been something more like $1,050 to $1,100.
I can remember getting asked in interviews at that point, when gold was stagnant and it really wasn’t going anywhere through early part of 2019, it was flat to down. It got up to $1,344 but failed. But the correction came right to where it had to come. The moving averages on a long term basis, we’re converging bullishly right there with a 61% retracement of the move off of last year’s low to that first quarter high. And again, the dollar making new heights here with a suggested that you would have broken that level. And when you didn’t, that was huge. And the stage was set. And we said to me, when you look at what’s going on in the world, and when you look at I think the last time we talked about this places that are multiple like Venezuela, and Argentina, and Turkey, and Pakistan, and Iran, and Uzbekistan, and Kazakhstan, even the Venezuelan situation kind of spreading into Colombia.
The number of places where currencies we’re getting trashed, was one thing too that was interesting because the dollar wasn’t racing to new highs in the dollar index like it was against some of these emerging market currencies. We’re at a place like Angola, we talked about in the Kwanzaa, it’s like, who cares about the Kwanzaa? Well, we cared. And there was a reason for that. It’s an OPEC country to produce a 1.6 million barrels of oil today, which right now is more than Nigeria. And it was a currency that had just gotten slammed, and gold in Kwanzaa was at record highs. Gold in Kwanzaa was up 500% in a matter of years. So, these are the kinds of things that to me play in the big picture where we’re at now, which is pretty simply this Mike, I mean growing lack of confidence, growing such suspicion that maybe central banks won’t just be able to keep getting away with papering over these problems the way they do every time, the degree to which somebody like the European Central Bank, or the Bank of Japan, or the Swiss National Bank, I mean they have virtually no room to cut interest rates again. They’re going to have to come up with something new and ingenious and ask me about that in a few minutes because there was something new and ingenious on the table here, which I think not a lot of people are aware of. It’s going to blow you away.
But keeping with the answer here because it’s important. This made the dollar the relief valve, I always talk about the dollars a relief valve. I’ve been doing this 35 years, Mike you know as well as I do, the dollar’s always the relief valve, but more so now because all these other central banks are going to look to the Fed to be basically the central banker to the world.
Because a lot of these other central banks don’t have the means, they didn’t raise rates like the Fed did so then they had more ammo on the back end like the Fed does. And not only that, but if it is like this thing where you see the dollar going up so dramatically in a lot of these emerging market currencies and no one even pays attention to. This meant the dollar is part of the problem. The Fed could not allow the dollar to break out through these highs around the 98, 99 level because that would have brought down the whole dynamic around emerging markets again, brought the deflationary dynamic back into commodities. We started to see the base metals break, and all of a sudden it was like, “Whoa, wait a minute. We can’t let the dollar go here.”
The dollar has to be the relief valve for a variety of reasons, and the Fed will have to be the one to provide the stimulus. And that’s where we got. So that’s wildly bullish for me, and gold in the longer-term. So, we’re very bullish on gold here in the longer term.
Mike Gleason: Now, speaking of silver, one of the big questions that metals investors are asking right now is, when is silver going to finally break out, or if it will now, when gold ran into that resistance level around $1,430, I believe it was August, of 2013, that you just alluded to, I looked it up, silver was just over $25 an ounce bound, $25.23, essentially $10 higher than it is right now. The last time gold was at this $1,430 level. So, the gold to silver ratio has gone from about 57 to 1 on that day in late August 2013, to 92 to 1 now, which is just truly astonishing. Now, historically, silver outperforms gold during a bull market in metals. So with the gold breaking out to multiyear highs, Greg, it is starting to look like the bull has returned here, yet silver is underperforming at least to this point. This is something, as I mentioned earlier, that you were anticipating when we spoke last in May, and you were right on the money there. But talk a bit about whether, or not you expect silver to start cashing up to gold, or a silver investors are going to have to tough it out a while longer.
Greg Weldon: Well, you could have asked them more timely question, and you did not set me up for this, I mean, you really didn’t. I did a special on silver yesterday, and looking at the gold silver ratio at 92, it’s at a 27-year high Mike. And when you look at the setup in silver, and certainly silver’s at risk, I mean if gold gets a correction here and gets back down to $1,350, silver could plunge. I don’t think that’s going to happen. I think you’re going to see some rotation. And I think silver, I said yesterday in my piece for my clients, I said silver is sitting on the launching pad. We’re waiting for the countdown, we’re waiting for ignition. $16.20 is the key technical level. I think you’re going to break it.
I think you’re going to break out, and to me, silver offers great opportunity here. And what I’m considering doing for our money management clients, and we have massive open profits here in gold… we were long from $1,196 in gold… I am very seriously considering dumping my gold and putting it all into silver. Like right here. Like maybe soon. I would like to see $16.20 violated. I’m a little skittish about waiting for it to be violated because that would potentially, you get a lot of slippage here, and I don’t want to give too much up here. Having said that, the other thing I would point out in this same vein of what you’re talking about, the historic norm in these bull market phases, where it’s not just gold, like it’s been. Gold is not only out performed silver, gold is outperformed the gold mining shares.
And the GDX, the ETF that tracks the gold mining shares is breaking out. And I think I mentioned on your show the NUGT, for those types of investors out there to have risk capital to burn, that are willing to jump out of airplanes type of thing. The NUGT is a triple leveraged ETF to the gold mining shares. That thing we were very bullish on this, I own it personally and it broke out. So, this is another kind of tell that silver maybe in the pipeline here is the fact that the GDX is breaking out. And the other thing I noted in our silver specialty yesterday was the SIL too, the silver miners shares. You’ve got Mag, you’ve got First Majestic. I mean, those have always been kind of two of my favorites.
They certainly were in 2016, we call it the low in the fourth quarter in gold and silver. And actually made a newer low in the mining shares before it broke out after our call. But those two, mining shares have already broken out. And when you look at the SIL versus the price of silver, it’s flipping right now, where the silver mining shares are beginning to grab the torch of upside leadership here. So to me, all that bodes very well for silver, let alone the fact the crack in the dollar keeps widening here. And you get through the 96.50-ish level, which is right where the long term two year exponential moving average, which is a phenomenal long term trend indicator. And the recent really to me the key pivot on the downside to complete a topping pattern in the dollar index is 95.02, you’re sitting right on top of both of those. The momentum has shifted in the dollar, and that puts not only silver in play, but frankly, Mike the entire commodities complex.
Mike Gleason: Speaking of the broader commodities complex here, I know you follow the Ag market as well, and I wanted to ask you about what’s going on there because there’s a lot of concern about how all the recent flooding in the Midwest is going to produce a very poor crop output this year. And that could have some real implications on the price of food, which could spill over to the larger commodities sector. Not to mention the terrorists from China, which are hurting our food exports. A comment on that if you would, and how likely is it that we may see some real inflation there, Greg?
Greg Weldon: Well, now I have to ask you, Mike, is someone secretly sending you the WeldonLive? Because just as special on Ags on Monday, and this is something we caught a six or, seven weeks ago because the planting numbers were horrible. I mean, the planting progress reports we watched from the USDA, and now you’re even looking at some of the crop conditions reports. Now what’s interesting here, and this may take a second for this answer, but it’s really important to me because food price inflation has already risen from negative to around 2%, and now you have a whole line up here of food commodities that are poised to break out based on this same story, which is the unbelievable rain, and flooding, and the whole wet situation in basically the middle of the bread basket, if you will, when you look at states like, Nebraska and Iowa, and Illinois, and Indiana, and Kentucky and Ohio, really the hardest hit.
But when you look at the USDA data, which came out actually on Monday at four o’clock, eastern time. There’s already kind of an uproar here going on, in terms of the farmers in the field saying that the USDA numbers may be fudged here. Now there is something called prevent planting, which is when farmers basically plant crops they know are not going to ever really be harvested, or brought to market in these kinds of situations. This is something the USDA will allow in certain circumstance as they have here, where farmers plant crops just to ensure that they get their insurance payments on these crops. So, this is a big deal. And when you look at corn, I mean the USDA is basically saying, “Okay, well corns caught up. It’s basically 100% planted.” When you read some of the surveys, and there’s a lot of the private agricultural services that produce surveys of farmers.
I mean, wow, Mike, I’m willing to let any of your listeners have these two reports on silver, on the Ags. But it is mind blowing to read the comments from farmers. I mean there are guys that are saying, I’m driving around my county, and I see fields that are planted 0%. I see field that had been planted that are already underwater again. And soybean farmers are now doing what they call sky planting, which means they can’t get the machines onto the field because it’s still too muddy, it’s still raining, it’s still 60 degrees in all these places. You don’t have warmth, you don’t have wind, is not drying out. So, they can’t get the machinery onto the fields. They’re dropping seeds from airplanes. Hoping that this will somehow take in the soybean crop.
When I see all of this dynamic, and then you read the conditions report which is so heavily skewed, you got more than twice as many fields are being reported parts of the crop, at least in soybeans, and corn are being reported in poor to very poor condition against halving, or worse in the crop that’s reported good or very good. The big picture here in really kind of the big wild card is yield because USDA is not cutting their yield forecasts. And yields are going to be nowhere near what the USDA is suggesting. And there are some claims by these farmers that the USDA is fudging these numbers because otherwise prices would be skyrocketing here, and they’re trying to kind of contain this issue. Well, you know how it works, it’s like intervening in currencies by central banks – intervention.
You could contain the currency until you can’t anymore. And that’s like basically holding a basketball – and I play pool basketball here all the time – you hold the ball under water, when you let go, it explodes up to the surface with some level of violence. This is what’s going to happen to grain markets. We are incredibly bullish on some of these grains, particularly soybeans because I feel that the numbers are going to end up looking so much worse than they look now. Because yields, let alone Mike, if it gets hot and dry on the flip side in August, because it’s a late crop, which makes it susceptible to lower yields in hot dry conditions later in the growing season. So, if you get a double whammy here, it could be devastating for the farmers. It’s unfortunate for the farm community, but in terms of prices, I mean there’s a ton of upside.
The other thing to think about is this has gotten to the point where livestock farmers now are concerned, that there may not be enough feed for their cows, and they may be slaughtering them earlier, bringing this to market, this could affect milk, butter, prices of dairy products certainly, beef. The potential tangent unintended consequences of this are significant, and how that plays into the CPI for food. And then I’ll throw one more at you because we haven’t even talked about the dollar, and the dollar, and the Ag commodity at complex are very tightly correlated. It’s almost as tightly, if not even maybe more sometimes than gold is to the dollar. And in that case, you look at stuff like sugar, coffee, Cocoa, you have some of these commodities set up, very bullishly at low prices. And the thing I will mention too about soybeans that is also applicable to things like sugar. The margin for error in the supply-demand balance sheet is very thin.
Now demand might soften somewhat in China, not even related to tariffs because some of the issues with animals there, and demand for feed, but it’s still going to grow. And if you don’t grow the crops, and already expecting we have lower acreage and soybeans, we were expecting a lower yield, they’re expecting a lower crop, and now you’re going to magnify that, when you’re going to have record demand, you could wipe out what has been considered a burdensome supply really fast. So, the entirety of the commodities complex, including many of the offshoots from this grain, and feed situation, and particularly as it relates to some of the soft tropical commodities, which have been severely depressed, would benefit greatly from a lower dollar. So this could be a real exciting time for the entire commodity complex. Not just gold and silver.
Mike Gleason: Yeah, it all has major implications for the dollar, and that generally has major implications for gold and silver. Gosh, so much more I want to talk to you about here, and we’ll save some of that for next time, but I definitely want to give you an opportunity to talk about the Gold Investor Bootcamp, Greg. I know that’s something you’re really promoting right now, and it’s fantastic stuff that people need to find out about because you’ve just heard about it, Greg absolutely, was all over this recent move in gold. I’m going to start calling him Nostradamus. He’s been so dead on with these calls. Tell people about the Bootcamp. Greg
Greg Weldon: Well, it’s interesting is, it’s not just about trading, we’re traders here but a lot of our clients or investors too. So the Gold Investors Bootcamp. It’s available on our website. It’s basically four videos. I’m going to have to cut one of the videos in half because it’s like an hour and a half long, but it’s essentially, for all intents and purposes, five videos, five hours, over 500 pages of text. I take you through investing a gold, number one. Do you do coins and bars? Do you call Mike Gleason, and buy silver coins, and silver bars, and so on and so forth. Do you invest in ETFs? Do you buy individual mining shares? Do you trade futures? So, I give you a breakdown of all of that, how to potentially create portfolios in a variety of ways, whether it’s using my individual mining shares, the ETFs or trading the futures. What kind of risk reward parameters should be looking at? So, it was kind of a top down, bottom up dynamic around trading.
And then to me, the most interesting part of the whole Bootcamp, was why should you be interested in gold and silver right now? And that’s part three. And it was really fun to do. And this all came about because my publisher, my agent, and my book was published in 2007, very early 2007, but I wrote it in 2006 by John Wiley & Sons. And to me the situation is so similar then to now in terms of the opportunity and really the mandate to have exposure to these things as a means of protection. So, it was twofold. I’m giving my publisher constantly for the last four years, “Can you write another book? Can you write another book? Can you write another book?” And finally, I’m like, “It’s time to write another book.”
So, I started putting the material together, and at the same time I’m getting questions from my clients about gold and silver, about trading them, even about futures. So, I decided I could kill two birds with one stone, answer all the questions, and provide myself the material for the book, which is now not going to be done because the Bootcamp is so good that I decided, look, I’d rather sell the Bootcamp, we can get it to people quicker. It’s more interactive. So, we’re real excited about that. And as a result of the Bootcamp, which we ran live, and now we’re selling it because it’s been recorded. WeldonLive we do everything, and it’s not a cheap service, it’s more for institutions.
So, we actually have started building Gold-Guru.com, which is going to be our new website with a service that’s going to be very affordable, and it is going to basically be hands on trading, investing in the mining shares, the ETFs, the futures markets, the underlying price. All of it will be available to retail, and institutional for client both so that website will be debuting next month as kind of an offshoot from the Bootcamp. The Bootcamp’s available now, Gold-Guru.com will be available in about 30 days, and we’re hoping two piggyback the two together, and provide what is needed out there. We’re meeting demand, and demand from our existing clients, and demand for pretty much everyone that’s coming through the Bootcamp. And I’ll tell you what, the comments, and the people that have reached out to us to basically give us their critique on the Bootcamp, have been just so overwhelmingly positive.
We have not had a single negative comment. People are kind of blown away, and I just put it all out there, man. It’s 100% right there everything that I believe, everything I do, and everything I think is in there. And I couldn’t believe more strongly personally – and while I’m not a gold bug, you know this, we’ve been bears on gold many times in the last five years – but this is the time. The time is now. The amount of money that’s going to be needed to be printed in this next downturn, theoretically. You’re already looking at what’s happening in Europe. The ECB says, they’re going to stimulate more. I don’t think people really understand what the ECB just told us, because it’s kind of important.
The ECB has their deposit rate. Their emergency deposit rate is set at minus 40 basis points, and they’re saying we could cut rates again and they could, because you have the Riksbank in Sweden at minus 75, you’ve got the Swiss National Bank with a target range that the low end is minus one and a quarter. So, sure there’s room to cut rates, but this really is hurting depositors, it’s hurting savers, it’s hurting fixed income investors. So, the ECB has hatched a plan that, I don’t even know if it’s really public yet, but it’s being talked about kind of among the big hedge fund guys. And I’m actually having some of my big clients call me after I mentioned that like, I haven’t heard about this. What is this?
The plan allegedly is for the ECB to raise interest rates, significantly. To raise the deposit rate to a 2%. And that would basically give everyone who wants to deposit money in the bank, so they can get paid rather than having to pay the ECB to hold their money. And at the same time they’re going to establish a new borrowing rate that is going to be minus 200 basis points, and the banks will be able to take that money as much as they want at minus 200 basis points, and turn around and make loans to consumers, and businesses at minus 50 basis points. In other words, the ECB is going to fund the banks to basically pay consumers, and businesses to borrow more money. It’s probably the most bullish story I’ve ever heard for gold potentially, and it’s probably the beginning of the end of this whole dynamic. That’s insane. It really is because the risk to central banks is greater than buying government debt, and so on and so forth.
If they institute this dynamic and it may be a two-step process, maybe a three-step process. Again, it just gets back to all the huge, big picture, multi-decade secular reasons to be bullish gold here in that central banks have so corrupted the system here with cheap money, there’s no turning back. There’s only one way to go. They are all in, and they will do whatever it takes, and it devalues all paper. Debt and currencies are all just IOUs at the end of the day. And this is going to create tremendous demand for gold as a protection of the purchasing power of your wealth.
Mike Gleason: Yeah, eventually you’ve got to think the chickens are going to come home to roost, and maybe we’re starting to see the beginning of this. A lot of us have been surprised that the system is kind of operated as it has for so long, and maybe we’re starting to see some of those fireworks start to develop.
Well, excellent, and thanks again Greg. I hope you have a wonderful weekend. Thanks so much for your comments, and enjoy your summer, and I can’t wait to get back with you a before long so we can discuss how this all unfolds. Take care.
Greg Weldon: Sure. Mike, my pleasure.
Mike Gleason: Well, that will do it for this week. Thanks again to Greg Weldon of Weldon Financial. For more information, simply go to WeldonOnline.com where you can sign up for a free trial, and be sure to check out Gold Investor Bootcamp. Again, you can find all of that information at WeldonOnline.com, be sure to check that out.
Mike Gleason: And check back here next Friday for our next weekly Weekly Market Wrap Podcast. Until then, this has been Mike Gleason with Money Metals Exchange, thanks for listening and have a great weekend everybody.
The Money Metals News Service provides market news and crisp commentary for investors following the precious metals markets.
Here are this week’s links to the latest Commitment of Traders data changes that were released on Friday.
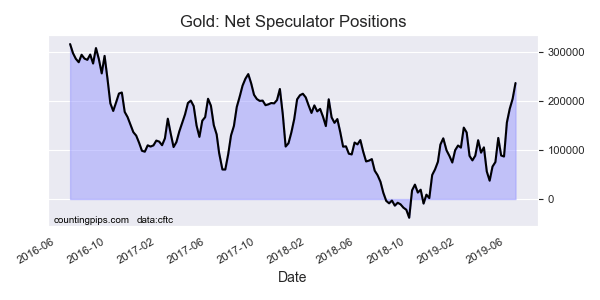
This week in the COT data, precious metals speculators once again added to their bullish positions sharply for a fourth week. Gold positions have strengthened by approximately +150,000 net contracts in just these last four weeks and are now at the most bullish level since September 9th of 2017.
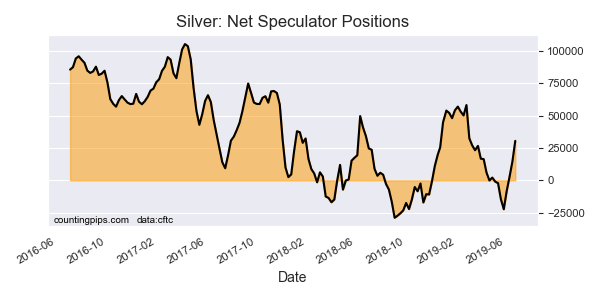
Silver bets continued their dramatic turnaround this week and improved for a fourth week. Silver had been at a low of -22,409 contracts on May 28th before a sharp surge in bullishness in the past month.
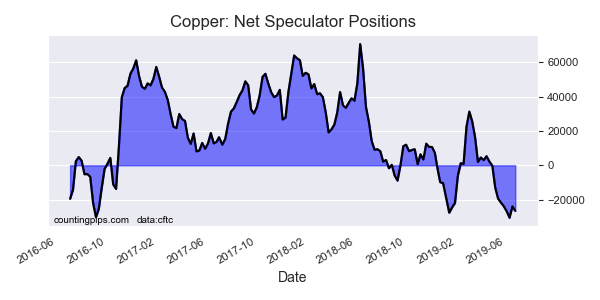
Copper speculators, meanwhile, increased their short bets this week and for the ninth time out of the past ten weeks.
In currencies, the USD Index Speculators reduced their bullish bets for the third time in the past four weeks. The Canadian dollar and Japanese yen speculative positions saw improvements on the week (lower bearish levels) while Euro speculators added to bearish bets slightly this week after a strong improvement last week.
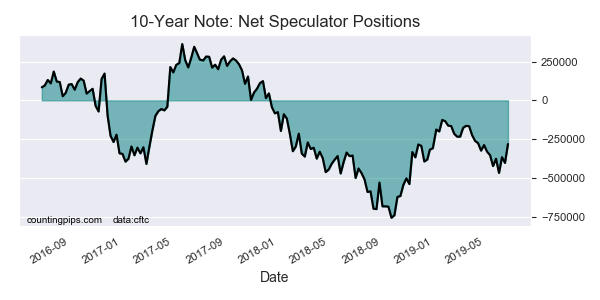
The 10-Year Bond speculators bailed out of their net short positions sharply this week by the largest one-week amount since November 13th of 2018. These usually reliable trend-followers have been caught on the wrong side of this market as 10-year bonds have rallied approximately 7.5% this year and yields have plummeted with the 10-year yield currently at 2.00%.
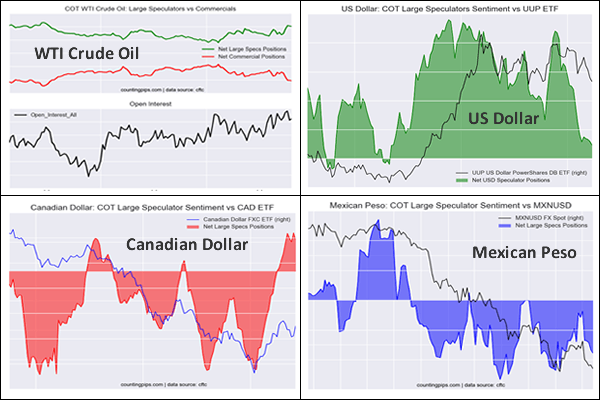
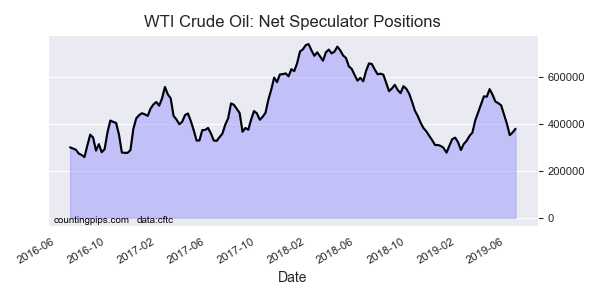
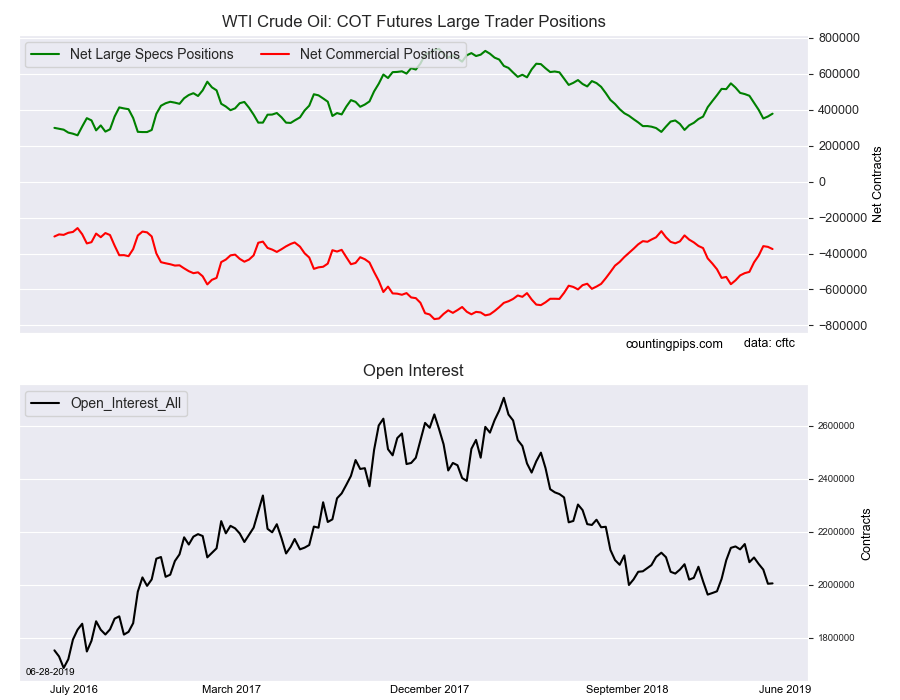
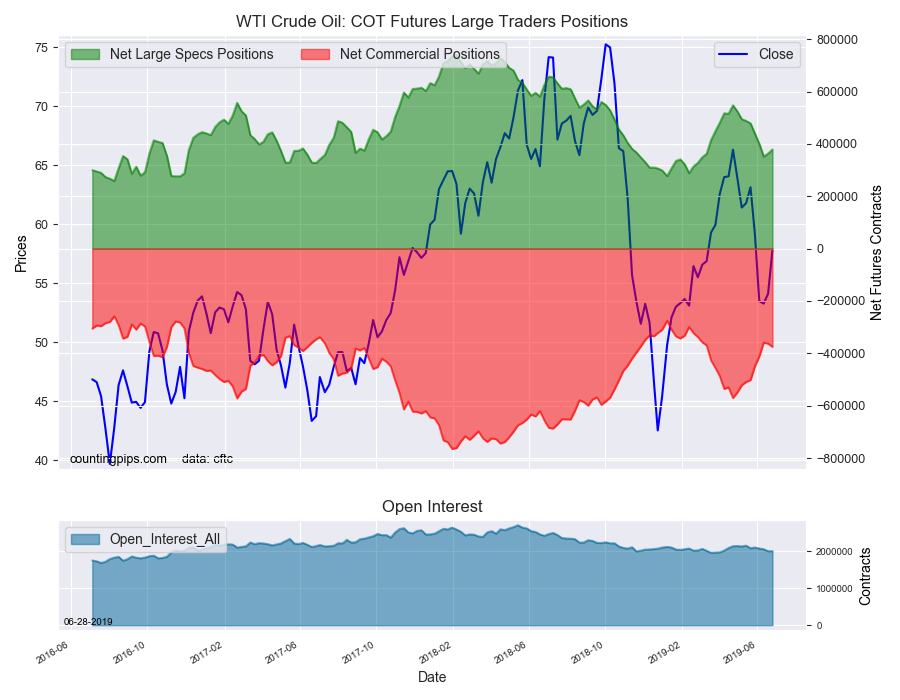
The WTI Crude oil speculators raised their bullish net positions for a second straight week although this was a second weekly gain due to short-covering.
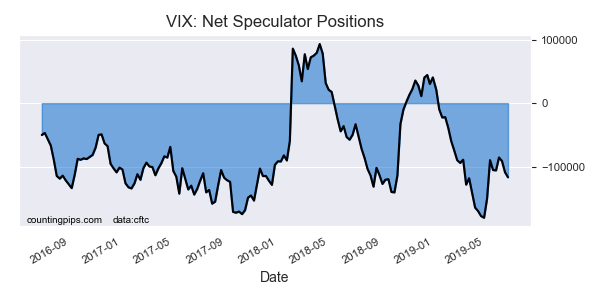
Finally, VIX speculators continued to add to their bearish positions again this week and have now added to short bets in five out of the past six weeks. The bearish sentiment has picked up again and the overall bearish position is now above the -100,000 contract level for a second straight week.
Large currency speculators lowered their net positions in the US Dollar Index futures markets this week, according to the latest Commitment of Traders (COT) data released by the Commodity Futures Trading Commission (CFTC) on Friday. See full article.
The large speculator contracts of WTI crude futures totaled a net position of 378,803 contracts, according to the latest data this week. This was a change of 15,716 contracts from the previous weekly total. See full article.
Large speculator contracts of the 10-Year Bond futures totaled a net position of -281,099 contracts, according to the latest data this week. This was a change of 121,885 contracts from the previous weekly total. See full article.
Large precious metals speculator contracts of the Gold futures totaled a net position of 236,554 contracts, according to the latest data this week. This was a change of 32,231 contracts from the previous weekly total. See full article.
Large stock market volatility speculator contracts of the VIX futures totaled a net position of -116,694 contracts, according to the latest data this week. This was a change of -8,050 contracts from the previous weekly total. See full article.
Large precious metals speculator contracts of the silver futures totaled a net position of 30,565 contracts, according to the latest data this week. This was a change of 16,049 contracts from the previous weekly total. See full article.
Metals speculator contracts of the copper futures totaled a net position of -26,539 contracts, according to the latest data this week. This was a change of -2,587 contracts from the previous weekly total. See full article.
*COT Report: The COT data, released weekly to the public each Friday, is updated through the most recent Tuesday (data is 3 days old) and shows a quick view of how large speculators or non-commercials (for-profit traders) were positioned in the futures markets.
The CFTC categorizes trader positions according to commercial hedgers (traders who use futures contracts for hedging as part of the business), non-commercials (large traders who speculate to realize trading profits) and nonreportable traders (usually small traders/speculators).
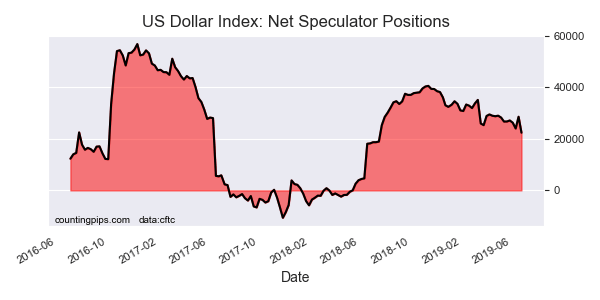
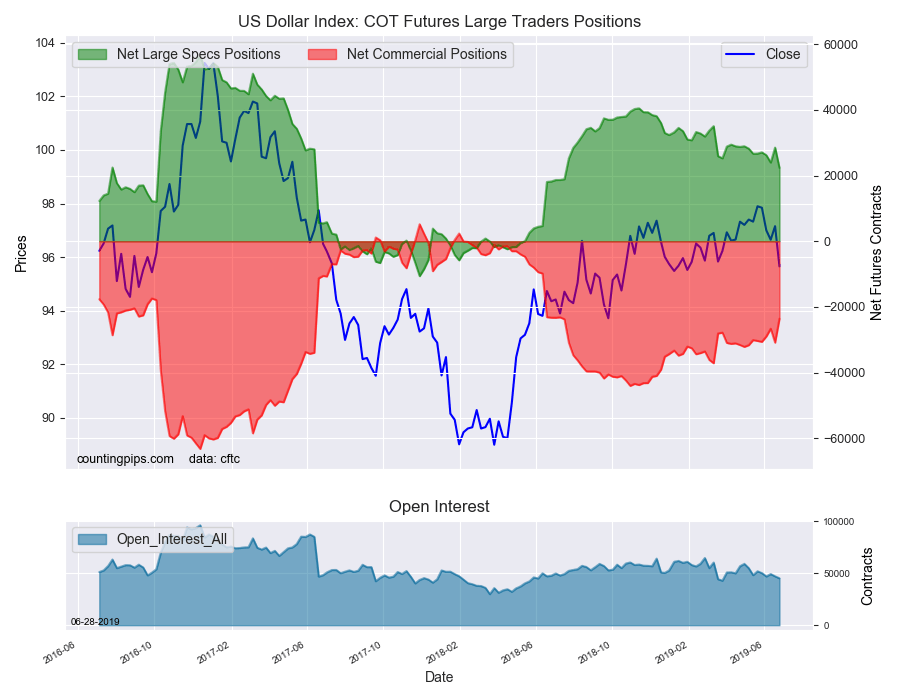
Large currency speculators lowered their bullish net positions in the US Dollar Index futures markets this week, according to the latest Commitment of Traders (COT) data released by the Commodity Futures Trading Commission (CFTC) on Friday.
The non-commercial futures contracts of US Dollar Index futures, traded by large speculators and hedge funds, totaled a net position of 22,366 contracts in the data reported through Tuesday June 25th. This was a weekly decline of -6,183 contracts from the previous week which had a total of 28,549 net contracts.
This week’s net position was the result of the gross bullish position decreasing by -5,992 contracts (to a weekly total of 34,327 contracts) in addition to the gross bearish position which saw rose by 191 contracts for the week (to a total of 11,961 contracts).
Large currency speculators cut their bets of the US Dollar Index for the third time in the past four weeks and by the largest one-week decline since March. The overall trend for speculator bets has been steadily lower in recent months since reaching a high of +40,513 contracts on January 13th.
Individual Currencies Data this week:
In the other major currency contracts data, we saw just one substantial change (+ or – 10,000 contracts) in the speculators category this week.
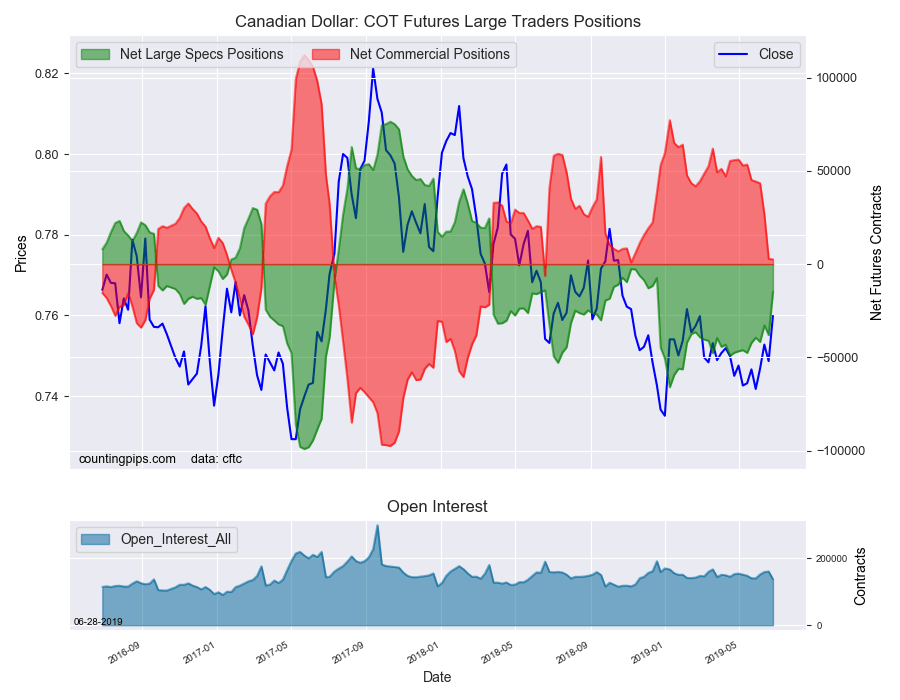
Canadian dollar positions rose sharply by over +23,000 net contracts this week. The CAD speculator position remains bearish but has improved for seven out of the past ten weeks and has gone from a standing of -49,162 contract on April 16th to -14,790 contracts this week. The current level is the least bearish point for CAD positions since December 18th.
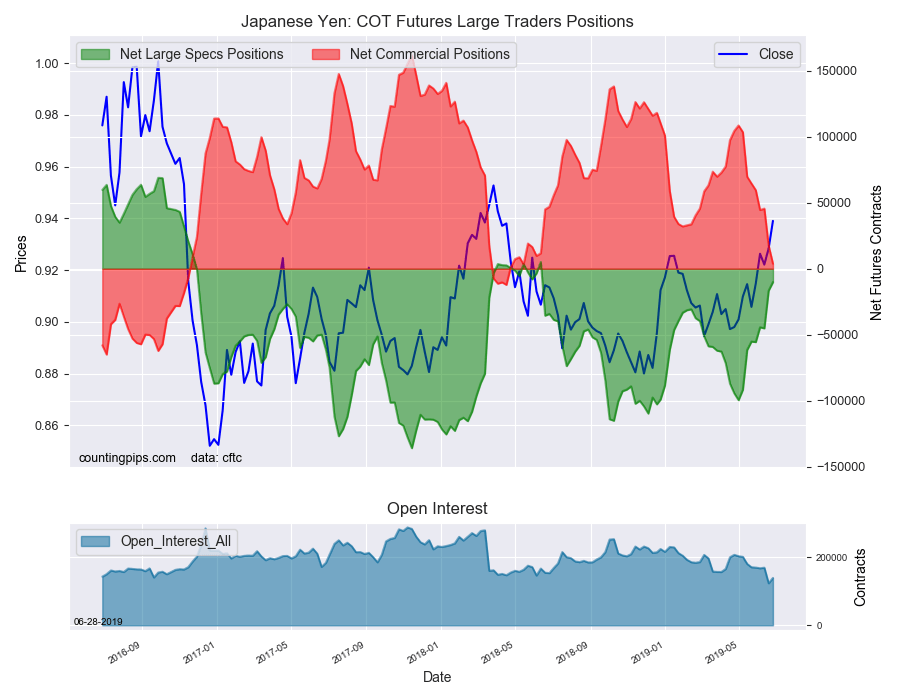
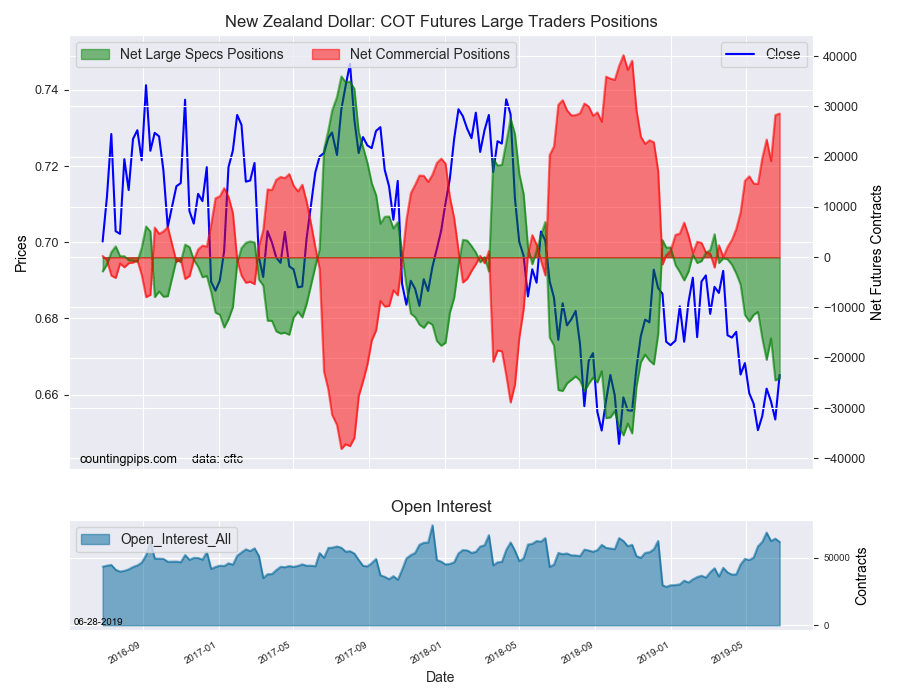
Overall, the major currencies that saw improving speculator positions this week were the Japanese yen (6,418 weekly change in contracts), Canadian dollar (23,281 contracts) and the New Zealand dollar (415 contracts).
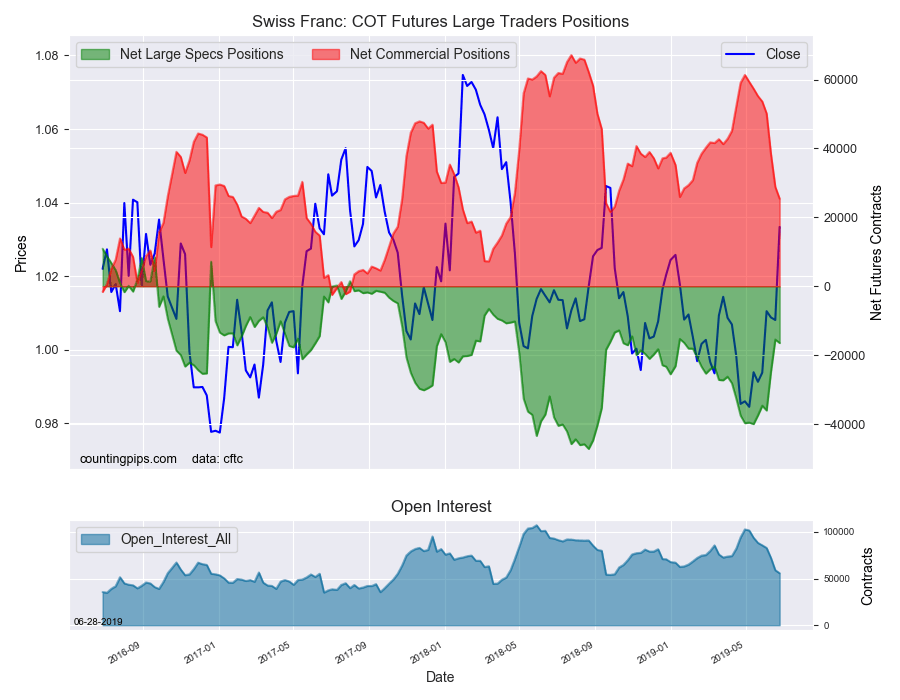
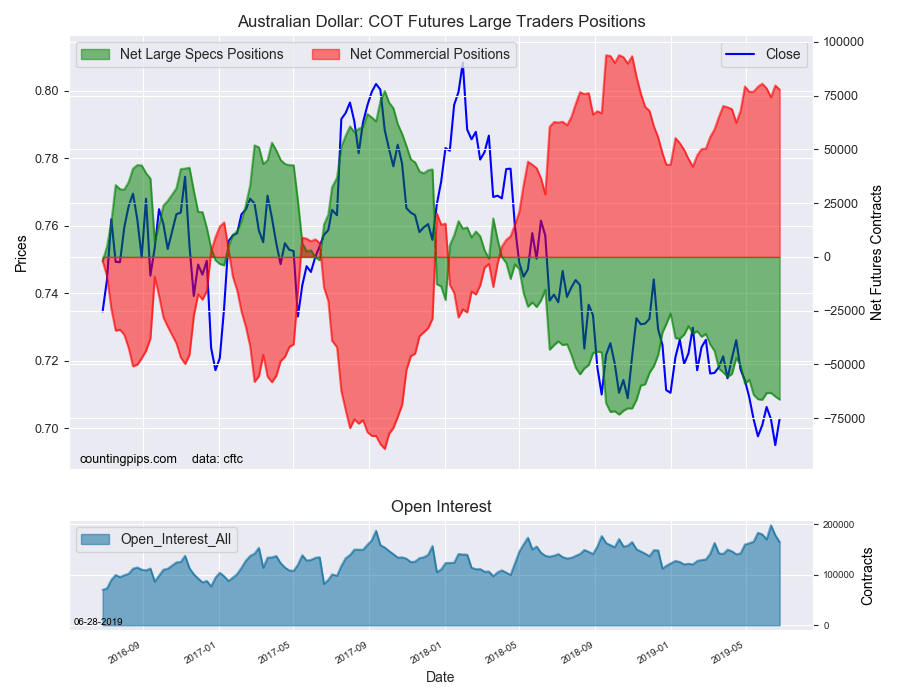
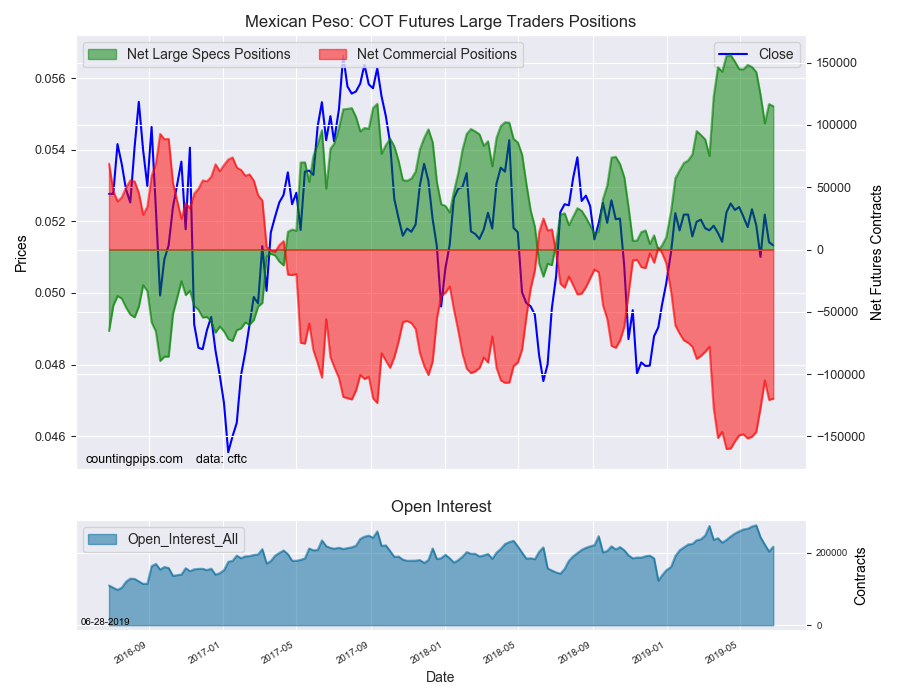
The currencies whose speculative bets declined this week were the US dollar index (-6,183 weekly change in contracts), euro (-3,965 contracts), British pound sterling (-6,373 contracts), Swiss franc (-997 contracts), Australian dollar (-1,457 contracts) and the Mexican peso (-1,771 contracts).
Other Notables for the week:
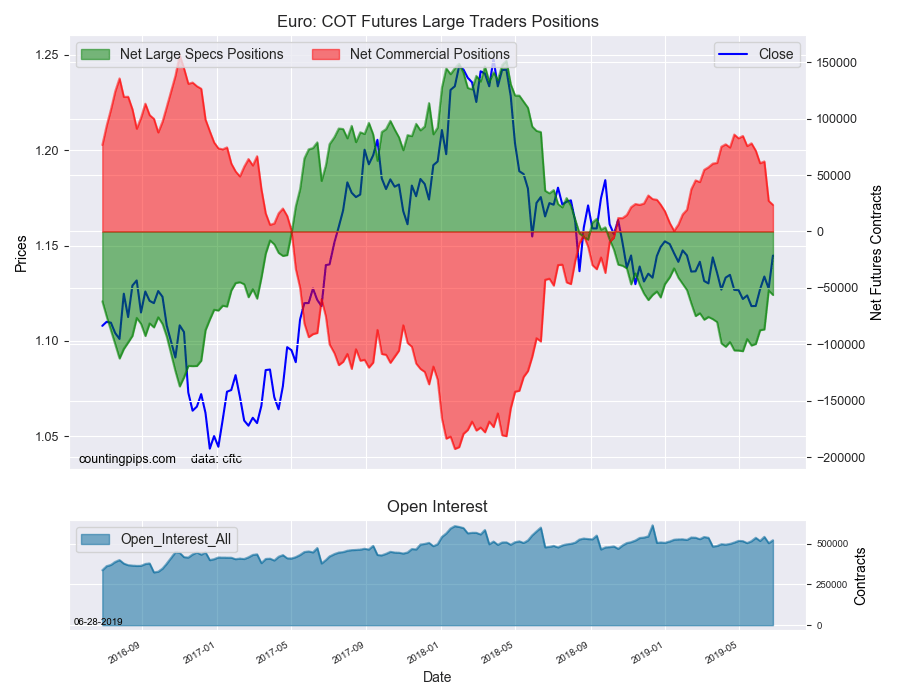
Euro speculators increased bearish bets slightly this week after a large improvement last week (34,462 contracts) and four straight weeks of declining bearish bets. The euro position remains bearish but is about half of its most bearish level recently (-106,105 contracts on May 7th).
Japanese yen speculator positions continued to improve (get less bearish) this week for a second week. The current bearish standing for JPY is currently at just -10147 contracts and the least bearish level since June 12th of 2018 when the net position was in a small bullish position.
See the table and individual currency charts below.
Table of Large Speculator Levels & Weekly Changes:
Currency
Net Speculator Position
Specs Weekly Change
USD Index
22,366
-6,183
EuroFx
-56,295
-3,965
GBP
-58,937
-6,373
JPY
-10,147
6,418
CHF
-16,481
-997
CAD
-14,790
23,281
AUD
-66,320
-1,457
NZD
-24,053
415
MXN
115,035
-1,771
This latest COT data is through Tuesday and shows a quick view of how large speculators or non-commercials (for-profit traders) were positioned in the futures markets. All currency positions are in direct relation to the US dollar where, for example, a bet for the euro is a bet that the euro will rise versus the dollar while a bet against the euro will be a bet that the dollar will gain versus the euro.
Weekly Charts: Large Trader Weekly Positions vs Price
EuroFX:
The Euro large speculator standing this week was a net position of -56,295 contracts in the data reported through Tuesday. This was a weekly reduction of -3,965 contracts from the previous week which had a total of -52,330 net contracts.
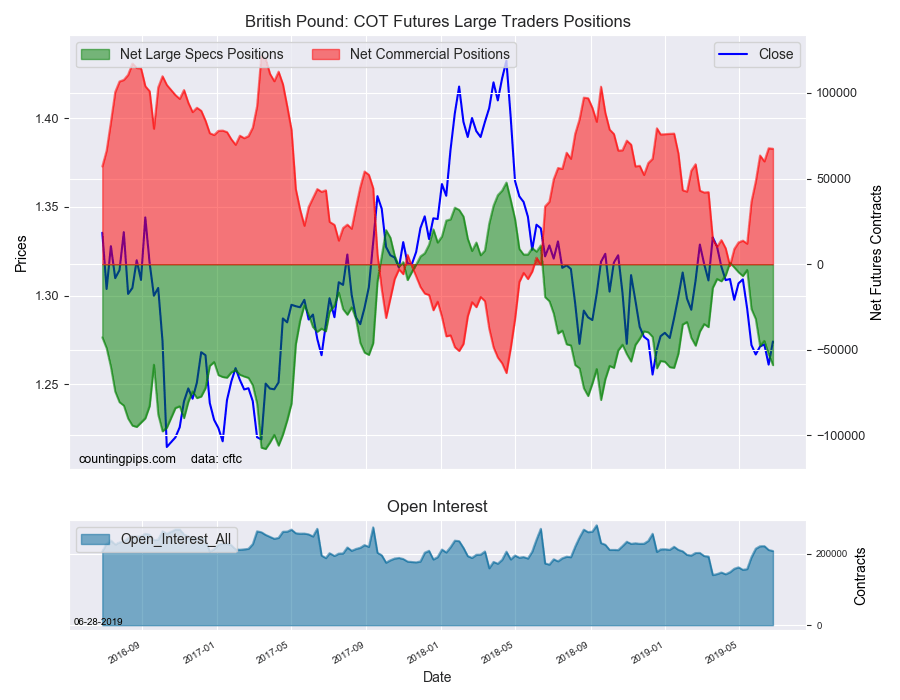
British Pound Sterling:
The large British pound sterling speculator level came in at a net position of -58,937 contracts in the data reported this week. This was a weekly lowering of -6,373 contracts from the previous week which had a total of -52,564 net contracts.
Japanese Yen:
Large Japanese yen speculators totaled a net position of -10,147 contracts in this week’s data. This was a weekly rise of 6,418 contracts from the previous week which had a total of -16,565 net contracts.
Swiss Franc:
The Swiss franc speculator standing this week equaled a net position of -16,481 contracts in the data through Tuesday. This was a weekly decline of -997 contracts from the previous week which had a total of -15,484 net contracts.
Canadian Dollar:
Canadian dollar speculators reached a net position of -14,790 contracts this week. This was a boost of 23,281 contracts from the previous week which had a total of -38,071 net contracts.
Australian Dollar:
The large speculator positions in Australian dollar futures came in at a net position of -66,320 contracts this week in the data ending Tuesday. This was a weekly decrease of -1,457 contracts from the previous week which had a total of -64,863 net contracts.
New Zealand Dollar:
The New Zealand dollar speculative standing reached a net position of -24,053 contracts this week in the latest COT data. This was a weekly increase of 415 contracts from the previous week which had a total of -24,468 net contracts.
Mexican Peso:
Mexican peso speculators was a net position of 115,035 contracts this week. This was a weekly decrease of -1,771 contracts from the previous week which had a total of 116,806 net contracts.
Article By CountingPips.com – Receive our weekly COT Reports by Email *COT Report: The COT data, released weekly to the public each Friday, is updated through the most recent Tuesday (data is 3 days old) and shows a quick view of how large speculators or non-commercials (for-profit traders) were positioned in the futures markets.
The CFTC categorizes trader positions according to commercial hedgers (traders who use futures contracts for hedging as part of the business), non-commercials (large traders who speculate to realize trading profits) and nonreportable traders (usually small traders/speculators).
Large energy speculators raised their bullish net positions in the WTI Crude Oil futures markets this week, according to the latest Commitment of Traders (COT) data released by the Commodity Futures Trading Commission (CFTC) on Friday.
The non-commercial futures contracts of WTI Crude Oil futures, traded by large speculators and hedge funds, totaled a net position of 378,803 contracts in the data reported through Tuesday June 25th. This was a weekly advance of 15,716 net contracts from the previous week which had a total of 363,087 net contracts.
The week’s net position was the result of the gross bullish position (longs) dropping by -5,808 contracts (to a weekly total of 496,941 contracts) but being overcome by the gross bearish position (shorts) which fell by -21,524 contracts for the week (to a total of 118,138 contracts).
Last two weeks of gains due to short covering
This week’s speculators crude oil position rose for a second straight week following a streak of seven consecutive weekly declines that ultimately trimmed the bullish position by approximately 195,000 contracts.
The gains of the past two weeks, however, were due to short positions bailing out of their positions in greater numbers (possibly due to geopolitical concerns) than traders adding to bullish positions which is not a great sign of strength.
The current bullish standing now remains under the +400,000 contract level for 3rd straight week and for the first time since early March.
WTI Crude Oil Commercial Positions:
The commercial traders position, hedgers or traders engaged in buying and selling for business purposes, totaled a net position of -374,908 contracts on the week. This was a weekly shortfall of -12,239 contracts from the total net of -362,669 contracts reported the previous week.
WTI Crude Oil Futures:
Over the same weekly reporting time-frame, from Tuesday to Tuesday, the WTI Crude Oil Futures (Front Month) closed at approximately $57.83 which was a boost of $3.72 from the previous close of $54.11, according to unofficial market data.
*COT Report: The COT data, released weekly to the public each Friday, is updated through the most recent Tuesday (data is 3 days old) and shows a quick view of how large speculators or non-commercials (for-profit traders) as well as the commercial traders (hedgers & traders for business purposes) were positioned in the futures markets.
The CFTC categorizes trader positions according to commercial hedgers (traders who use futures contracts for hedging as part of the business), non-commercials (large traders who speculate to realize trading profits) and nonreportable traders (usually small traders/speculators).