This week – July 8 through July 13 – central banks from 7 countries or jurisdictions are scheduled to decide on monetary policy: Israel, Malaysia, Canada, Serbia, Egypt, Peru and Sri Lanka.
Following table includes the name of the country, the date of the next policy decision, the current policy rate, the result of the last policy decision, the change in the policy rate year to date, the rate one year ago and the country’s MSCI classification.
The table is updated when the latest decisions are announced and can always accessed by clicking on This Week.
Masayoshi Amamiya, Deputy Governor of the Bank of Japan, said that his department could further reduce the negative rate if it is needed to stimulate the economy. Will the USDJPY quotations grow?
Such a move indicates the weakening of the yen against the US dollar. The rate of the Bank of Japan is now -0.1% with annual inflation 0.7%. At the same time, the target inflation rate is much higher and amounts to 2%. Japan’s GDP growth in the 1st quarter of 2019 was 2.2% in annual terms. The Bank of Japan strives to keep it at this high level and expresses its readiness for an additional rate cut, if necessary. Such a monetary policy may contribute to the weakening of the yen. The US dollar index rose significantly due to the publication of good data on the US labor market in June. The number of new jobs (Non-farm payrolls) exceeded forecasts and turned out to be the maximum in 5 months. The Fed rate is now 2.5%. According to all forecasts, it will be reduced by 0.25% at the next meeting on July 31.
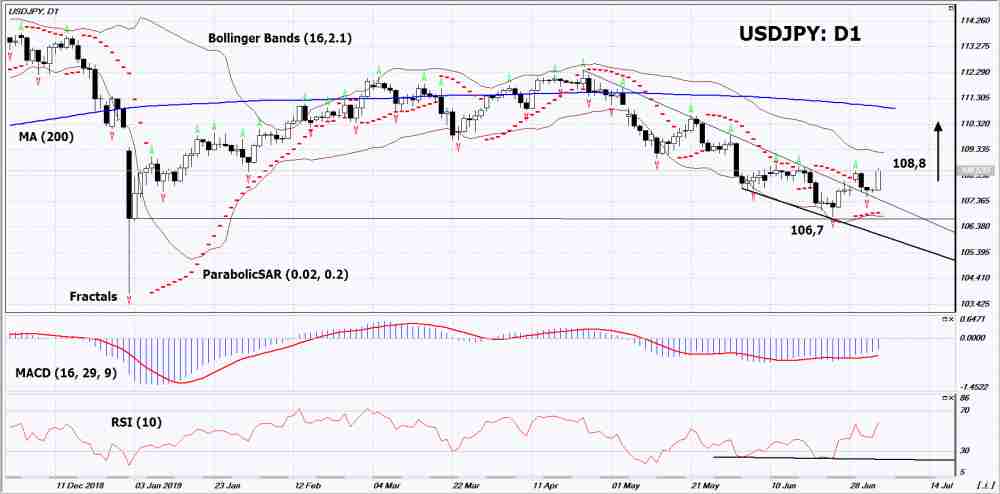
On the daily timeframe USDJPY: D1 came out of the downtrend. Various technical analysis indicators have generated uptrend signals. Further growth of quotes is possible in case of publication of negative macroeconomic data in Japan and positive in the United States.
The Parabolic indicator indicates uptrend signal.
The Bolinger bands narrowed, indicating volatility decrease . The bottom line of Bollinger has a slope up.
The RSI indicatoris above the 50 mark. It formed a weak divergence to the rise.
The bullish momentum may develop if USDJPY exceeds the last 3 upper fractals: 108.8. This level can be used as an entry point. This level can be used as an entry point. The initial stop loss can be placed below the signal of the Parabolic, the lower fractal and the lower Bollinger line: 106.7. After placing the pending order, the stop loss shall be moved following the signals of Bollinger and Parabolic to the next fractal minimum. Thus, we are changing the potential profit/loss to the breakeven point. More risk-averse traders may switch to the 4-hour chart after the trade and place a stop loss moving it in the direction of the trade. If the price meets the stop level (106,7) without reaching the order (108,8), we recommend to cancel the order: the market sustains internal changes that were not taken into account.
There are some key elements of political and economic Super-Cycles that all traders must stay aware of listed below. But if you have not yet read PART I do so now.
_ Very often, 12+ months before a major US political election cycle, the US stock market typically enters a Bearish trend phase that lasts until 8+ month before the actual election date.
_ The Transportation Index has not recovered to levels from the September 2018 peak. This lower price rotation in the Transportation Index suggests the global economy is not expecting growth in the near future.
_ Other than Precious Metals, the Commodities sector has rebounded off of recent lows but has yet to see any real price advancement – suggesting that demand for raw commodities is rather weak.
_ The Real Estate sector in the US is starting to falter near a current high price level. We are seeing price decreases hit the markets as sellers are desperate to attract buyers. This could be a warning that a price revaluation event is about to unfold in the US.
_ Super-Cycles suggest a moderately sized price rotation between now and early 2020 (likely greater than 20% in size). This rotation, should it happen, will become a price revaluation event that could attempt to “shake loose” some of the sector pricing and forward expectations we’ve mentioned (above).
Our bigger concern is the localized state and federal pension and retirement issues that continue to respond with higher levels of financial commitments and greater levels of annual budgets as related to ongoing capacity and operational activities in the US.
If an unwinding event was to unfold in or near 2020, it is our belief that a pricing revaluation event related to any of the core economic factors above (particularly with Real Estate, Economic Cycles, the US Presidential Elections, and a soft/weakening US economy) could result in a much larger price revaluation event taking place. This would create extended pressures on local State and Federal expenses and highlight debt issues that can often be hidden behind “creative accounting” tricks.
State and Local Government Debt Securities and Loan Liability levels have stayed elevated, yet somewhat flat over the past 10+ years. It is very likely that these debt levels have been contained because of the US easy money policies of the past 10+ years. When the US Dollar is cheap and easy to repay, these debt levels don’t look so difficult.
Pension and retirement systems/fund are a completely different story for State and Local government agencies. Asset flows have dramatically increased in volatility after 2000. Additionally, the depth and magnitude of asset outflows have become quite dangerous while price revaluation events were unfolding (2000 to 2004 and 2008 to 2015). Outflows in state and federal pension and retirement funds create large forward operational pressures and shortfalls in expected funding levels. These decreases in funding should be made whole by the State or City – but they are rarely ever repaid in full.
As these “wholes” in the pension and retirement systems continue to fester (resulting in decreased funds for pensioners and decrease fund to be deployed as investment assets), the problems begin to compound over time. More and more retirees and pensioners start drawing benefits while the system continues to take in less and less – never actually catching up in total value.
One big revaluation event, or possibly two, from now and we believe the entire system will create a multiple Trillion Dollar debt crisis within the US and possibly throughout the modern world. We believe the under-estimated state and federal pension/retirement funding issue is the next shoe to drop and that it will take a price revaluation event to expose the risks that are evident within this failed “Ponzi” scheme. Read the recent news about Chicago and Illinois to learn just how dangerous these entitlement contraptions really are.
Let’s assume that a revaluation event does take place within the next 5 to 10+ years – this would be something like a Real Estate price correction or some type of stock market, asset market price correction related to local or global economic issues. Could these massive asset funds handle an extended DRAWDOWN from their funds while Cities, States, and Federal agencies attempt to deal with declining revenues? How much time would it take for these pension and retirement funds to fall into crisis or insolvency?
By our estimates, the current asset levels in the US retirement/pension system have just started to breach the lower asset level channel originating from 1970 to 1999 attribution levels. It has taken 20+ years of US Fed and global Central Bank market manipulation, as well as President Trump’s incredible US economic and stock market rally, to recover to these levels.
Overall, skilled technical traders must be aware of the risks that are ever-present for another crisis event or what we are calling a “price revaluation event” that could create havoc on anyone’s retirement accounts, trading portfolios and/or simple family life/future. We’re trying to help to highlight what we believe will be the future 16 to 24 months of pricing activity within the US Stock market based on our research tools and our experience/knowledge.
I urge you visit my Wealth Building Newsletter and if you like what I offer, join me with the 1 or 2-year subscription to lock in the lowest rate possible and ride my coattails as I navigate these financial market and build wealth while others lose nearly everything they own during the next financial crisis. Join Now and Get a Free 1oz Silver Round or Gold Bar!
I can tell you that huge moves are about to start unfolding not only in metals, or stocks but globally and some of these super cycles are going to last years. A gentleman by the name of Brad Matheny goes into great detail with his simple to understand charts and guide about this. His financial market research is one of a kind and a real eye-opener. PDF guide: 2020 Cycles – The Greatest Opportunity Of Your Lifetime
As a technical analysis and trader since 1997, I have been through a few bull/bear market cycles. I believe I have a good pulse on the market and timing key turning points for both short-term swing trading and long-term investment capital. The opportunities are massive/life-changing if handled properly.
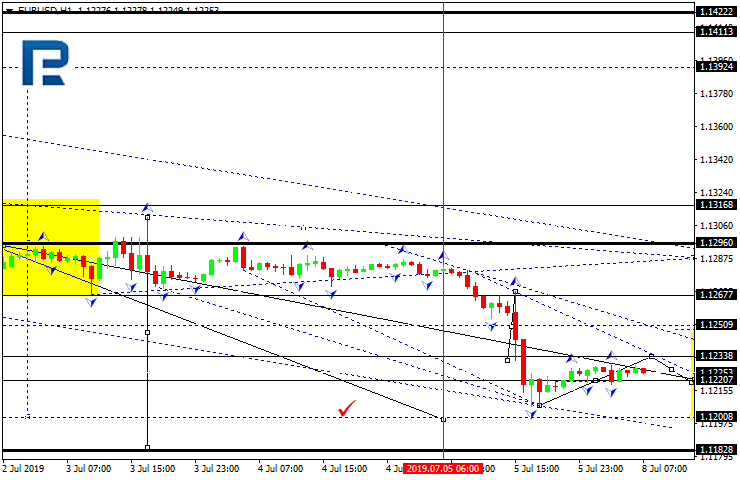
EURUSD has reached the predicted downside target; right now, it is consolidating around 1.1222. If later the price breaks the range to the upside, the instrument may start a new correction towards 1.1295; if to the downside – resume trading inside the downtrend with the target at 1.1200.
GBPUSD, “Great Britain Pound vs US Dollar”
GBPUSD has reached the short-term downside target; right now, it is trading upwards with the target at 1.2546. Later, the market may start another decline towards 1.2515 and then form one more ascending structure to reach 1.2584.
USDCHF, “US Dollar vs Swiss Franc”
After breaking the consolidation range to the upside, USDCHF has almost completed the first expansion at 0.9930. Possibly, today the pair may test 0.9890 from above. If later the price breaks 0.9930 to the upside, the instrument may resume trading inside the uptrend towards 0.9960; if 0.9888 to the downside – continue the correction with the target at 0.9845.
USDJPY, “US Dollar vs Japanese Yen”
USDJPY is trading downwards with the short-term target at 108.18. After that, the instrument may start a new growth towards 108.38 and then continue trading downwards to reach 108.14.
AUDUSD, “Australian Dollar vs US Dollar”
AUDUSD is trading upwards with the target at 0.6990. After that, the instrument may form a new descending structure towards 0.6975 and then form one more ascending structure to reach 0.7020.
USDRUB, “US Dollar vs Russian Ruble”
USDRUB is trading upwards with the short-term target at 64.06. After that, the instrument may start another decline towards 63.40 and then continue trading upwards with the first target at 64.40.
XAUUSD, “Gold vs US Dollar”
Gold has finished the first descending impulse; right now, it is being corrected towards 1404.30. Later, the market may form a new descending structure to break 1383.00 and then continue trading downwards with the target at 1330.00.
BRENT
Brent has completed the ascending structure at 64.86. Today, the pair may be corrected towards 63.65, thus forming a new consolidation range. If later the price breaks this range to the upside, the instrument may resume trading inside the uptrend towards 67.70; if to the downside – continue the correction to reach with the target at 62.00.
Attention! Forecasts presented in this section only reflect the author’s private opinion and should not be considered as guidance for trading. RoboForex LP bears no responsibility for trading results based on trading recommendations described in these analytical reviews.
In this exclusive interview, CEO Paul Cowley of First Vanadium discusses the vanadium market and his company’s prospects with Peter Epstein of Epstein Research.
First Vanadium Corp. (FVAN:TSX.V; FVANF:OTCQB) has been under pressure, along with hundreds of battery metal juniors and the underlying metals, including vanadium, cobalt and lithium. Even vanadium giant Largo Resources Ltd. (LGO:TSX) is down 61% from its 52-week high. Yet, if one believes in vanadium, it’s hard to ignore First Vanadiums shares at CA$0.44, down 78%! The pro forma enterprise value (market cap + debt cash) is just US$12.8M. The company has CA$1.9M in cash.
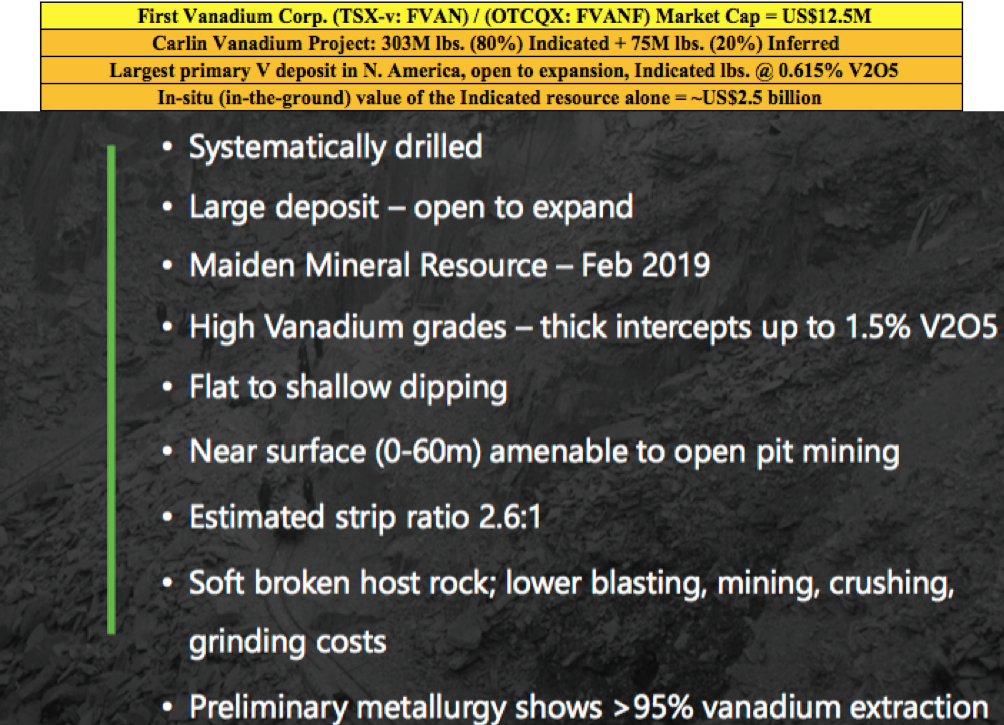
Yet, even at current vanadium pentoxide (V2O5) prices, the in-situ value of the Indicated-only portion (303 million pounds) of the company’s estimated resource is ~US$2.5 billion. Management believes it has the largest high-grade primary vanadium resource in North America.
There has been a lot of weeping and gnashing of teeth over the V2O5 (China) price falling from a 2019 high of US$17.6 to its current US$8.2 per pound. But, as the saying goes, the cure to low prices is. . .low prices. Few new projects make sense at today’s levels. I believe that V2O5 (China) between US$10US$15 per pound might be a sweet spot, good for both producers and end users.
Steel companies can afford to pay higher prices for V2O5, but grid-scale, vanadium redox flow battery (VRB) energy storage Systems (outside of China) might need prices below US$10/lb. to go mainstream. Importantly though, VRB plant costs are coming down. Vincent Sprenkle, a lead researcher at the U.S. Department of Energys Pacific Northwest National Laboratory (PNNL) recently said, “VRB costs could be lowered by another 50%.”That would be very bullish for vanadium prices, it would allow for widespread adoption of VRBs even with V2O5 prices above US$10/lb.
First Vanadium has a sizable resource, a good grade, in a great jurisdiction. A preliminary economic assessment (PEA) is expected by year end. The following interview of Paul Cowley, P.Geo., president, CEO and director of First Vanadium, was conducted by phone and e-mail between June 24 and July 2.
Peter Epstein: Please tell us about yourself and your team.
Paul Cowley: I’m an exploration geologist with 40 years’ experience in the discovery and evaluation of mineral deposits around the world. About half of my career was with a major, BHP Minerals. I was involved in leading the team in the Canadian Arctic that made four gold deposit discoveries that generated about 6 million ounces of gold. I also worked at Escondida and BHPs Ekati diamond mineduring their exploration days.
I’m a senior guy, but I’m the youngest of our group. The others have even more years of experience. We have two mining engineers that held mine general manager positions of very significant mines at majors. We have four metallurgists that have worked for majors in senior roles. We have a construction engineer who’s built 20 mines in North and South America; he’s currently building Lundin Gold Inc.’s (LUG:TSX) mine in Ecuador.
Peter Epstein: What do you make of the recent volatility in the vanadium price?
Paul Cowley: Since early March 2019 the vanadium price has taken an unexpected turn lower. Prices are not responding to the bigger picture demand and supply imbalance. Chinese steel plants did not recharge their vanadium inventories in this period, as many expected they would, putting pressure on traders to liquidate at undercutting prices, but they will have to restock. The U.S.-China trade wars, and some shortfall of enforcement of new Chinese rebar standards, appear to have exacerbated the situation in the short term.
It’s our view that the fundamentals of demand in global steel applications will outstrip supply and should push vanadium prices higher again in the second half of the year, and beyond. Adding to the demand side is the exciting boom in solar and wind projects, all of which require battery storage. This is happening on so many levels around the world that we expect to see the vanadium battery carve out a healthy market share in this expanding renewable space. Some are calling the 2020s the Solar Decade.
Peter Epstein: Please explain the significance of the historical data you recently received, which extended the strike length by 300 meters to the south.
Paul Cowley: It means more potential than we had expected. From our drilling, the deposit appears to be open to expansion in several areas, but we did not expect the deposit to be open to the south. The newly acquired data demonstrates a 15% strike length increase to the south and it’s still open in that direction. This is exciting news as this data was not included in the resource estimate we put out in February.
Peter Epstein: You already have a 303 million pound vanadium resource (in situ value of ~US$2.5 billion) in the Indicated category alone. Does the resource need to get any bigger?
Paul Cowley: That’s a good question. But it needs to be answered through an economic study. In our view, the resource is sizable. It’s currently the largest, highest-grade primary vanadium resource in North America. Our immediate priority is to demonstrate potential economic viability with what we have, knowing that we believe we could always make it bigger if and when we need to.
Peter Epstein: Some readers may assume that First Vanadium will need an expensive roaster in its operating flow sheet. What are your latest thoughts?
Paul Cowley: Not true. The path we are on with our metallurgical flow sheet does not include, or require, a roaster.
Peter Epstein: Although Nevada is the #1 global mining jurisdiction in the latest Fraser Institute Mining Survey, some complain that it takes a long time to get permits. What does your team expect in this regard?
Paul Cowley: In general, in the U.S. that is true, but not in Nevada. Nevada has a responsible review and process, but it’s a mining stateand even more so for us, now that vanadium is on the critical minerals list. The U.S. has unveiled its strategy in an effort to rebuild struggling domestic supply chains for metals and minerals it deems “critical” to the country’s manufacturing and defense sectors. Recently this was reiterated when President Trump and Prime Minister Trudeau announced a plan for the U.S. and Canada to collaborate on critical minerals.
Peter Epstein: What are the latest developments on the metallurgical front?
Paul Cowley: We continue to make strides on the metallurgical front. In April we announced an average of 95% vanadium extraction from the rock across the deposit, into solution. We do not know what ultimate recoveries will look like just yet, but we are making good progress. And we’re making strides in the area of pre-concentration, with the aim to reduce the plant size, which would lower the capital intensity of the project.
Peter Epstein: What are First Vanadium’s plans for a preliminary economic assessment (PEA)? Might that be a 1H 2020 event?
Paul Cowley: No, we think that we can move faster. Our aim is to initiate a PEA in the third quarter, with results to be reported before the end of the year.
Peter Epstein: Why should readers consider buying shares of First Vanadium?
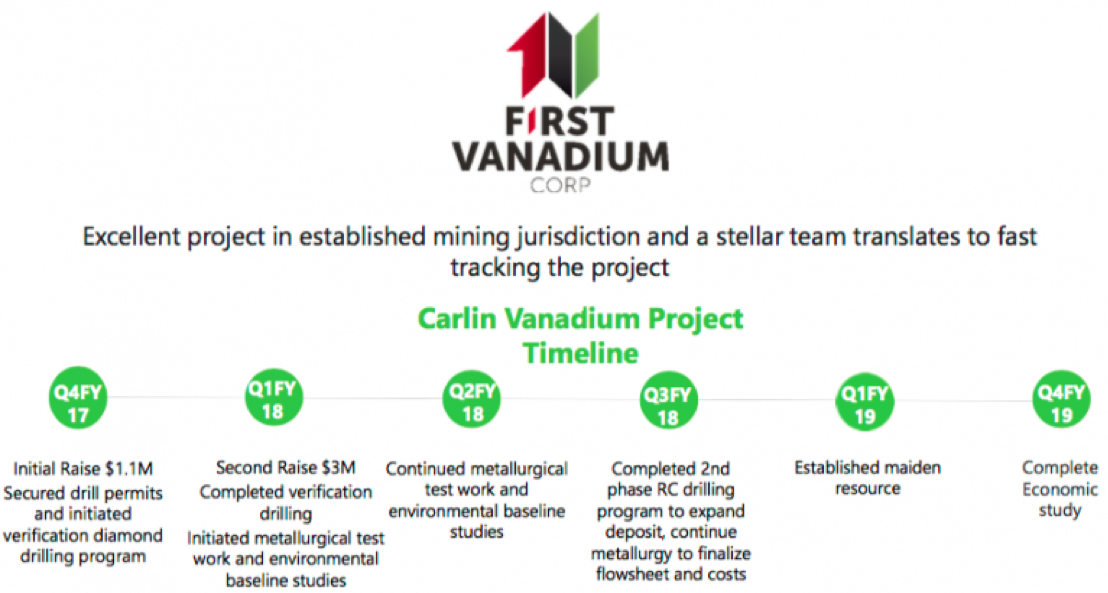
Paul Cowley: I see very good value and upside; an exceptional senior technical team, a good share structure and a great project. We now have CA$1.9 million in cash with the recent private placement closing, and 42.4 million shares. Our share price now is where it was at the beginning of 2018! Yet, we have delivered two successful drill campaigns, a mineral resource with considerably higher grades, and more metal in the ground than our historical resource, and 80% (303 million pounds) of it is in the Indicated category.
That, plus positive metallurgical test work and environmental baseline studies to advance permitting. If one is bullish on the vanadium price, currently at US$8.20/lb., then First Vanadium’s project in the first-of-84-ranked global jurisdiction of Nevada should be high on the list of projects to consider investing in.
Peter Epstein: Thank you Paul, very interesting and timely commentary on the vanadium market and on First Vanadium. I look forward to seeing a PEA later this year!
Peter Epstein is the founder of Epstein Research. His background is in company and financial analysis. He holds an MBA degree in financial analysis from New York University’s Stern School of Business.
Disclosures: The content of this interview is for information only. Readers fully understand and agree that nothing contained herein, written by Peter Epstein of Epstein Research [ER], (together, [ER]) about First Vanadium Corp., including, but not limited to, commentary, opinions, views, assumptions, reported facts, calculations, etc. is not to be considered implicit or explicit investment advice. Nothing contained herein is a recommendation or solicitation to buy or sell any security. [ER] is not responsible under any circumstances for investment actions taken by the reader. [ER] has never been, and is not currently, a registered or licensed financial advisor or broker/dealer, investment advisor, stockbroker, trader, money manager, compliance or legal officer, and does not perform market making activities. [ER] is not directly employed by any company, group, organization, party or person. The shares of First Vanadium Corp. are highly speculative, not suitable for all investors. Readers understand and agree that investments in small cap stocks can result in a 100% loss of invested funds. It is assumed and agreed upon by readers that they will consult with their own licensed or registered financial advisors before making any investment decisions.
At the time this article was posted, Peter Epstein owned no shares of First Vanadium Corp. and the company was an advertiser on [ER].
Readers understand and agree that they must conduct their own due diligence above and beyond reading this article. While the author believes hes diligent in screening out companies that, for any reasons, are unattractive investment opportunities, he cannot guarantee that his efforts will (or have been) successful. [ER] is not responsible for any perceived, or actual, errors including, but not limited to, commentary, opinions, views, assumptions, reported facts, financial calculations, etc., or for the completeness of this interview or future content. [ER] is not expected or required to subsequently follow or cover events & news, or write about any particular company. [ER] is not an expert in any company, industry sector or investment topic.
Streetwise Reports Disclosure: 1) Peter Epstein’s disclosures are listed above. 2) The following companies mentioned in the article are billboard sponsors of Streetwise Reports: None. Click here for important disclosures about sponsor fees. The information provided above is for informational purposes only and is not a recommendation to buy or sell any security. 3) Statements and opinions expressed are the opinions of the author and not of Streetwise Reports or its officers. The author is wholly responsible for the validity of the statements. The author was not paid by Streetwise Reports for this article. Streetwise Reports was not paid by the author to publish or syndicate this article. Streetwise Reports requires contributing authors to disclose any shareholdings in, or economic relationships with, companies that they write about. Streetwise Reports relies upon the authors to accurately provide this information and Streetwise Reports has no means of verifying its accuracy.
4) The article does not constitute investment advice. Each reader is encouraged to consult with his or her individual financial professional and any action a reader takes as a result of information presented here is his or her own responsibility. By opening this page, each reader accepts and agrees to Streetwise Reports’ terms of use and full legal disclaimer. This article is not a solicitation for investment. Streetwise Reports does not render general or specific investment advice and the information on Streetwise Reports should not be considered a recommendation to buy or sell any security. Streetwise Reports does not endorse or recommend the business, products, services or securities of any company mentioned on Streetwise Reports. 5) From time to time, Streetwise Reports LLC and its directors, officers, employees or members of their families, as well as persons interviewed for articles and interviews on the site, may have a long or short position in securities mentioned. Directors, officers, employees or members of their immediate families are prohibited from making purchases and/or sales of those securities in the open market or otherwise from the time of the interview or the decision to write an article until three business days after the publication of the interview or article. The foregoing prohibition does not apply to articles that in substance only restate previously published company releases.
USD has traded mildly to the upside over the European morning on Monday though the index is still sitting off last week’s highs at 96.83 last. A quiet session is likely today given the absence of any tier one economic data. The main focus of the week for USD traders will be the FOMC meeting minutes due on Wednesday. The market is currently pricing in a .25% rate cut for the July meeting so traders will be keen to assess the meeting minutes for signs as to whether this perspective is still valid.
Euro Weighed Down
EURUSD a little lower today, weighed on by a stronger USD. For now, EURUSD remains above the 1.1217 level having briefly pierced below it last week. German industrial production figures came In lower than expected today which has not helped EUR’s case, keepingpricein the red for now.
GBP Under Pressure
GBPUSD too is a little lower over early European trading on Monday as the pair remains subdued following the big sell-off last week. GBPUSD trades 1.2529 last, remaining above the 1.2484 support for now, though focus is on further downside this week. With no key domestic data today, GBP is likely to trade lightly across the remainder of the day.
Equities Rallying
Risk assets have started the week well with the SPX500 trading in the green over the first European session of the week. The SPX500 broke out to fresh all-time highs last week in response to optimism over a potential US-China trade deal. The market trades 2979.18 last, just off last week’s highs, though still supported at current levels, keeping the focus on another push higher.
Gold Up, JPY Down
Safe havens have had a mixed start to the week with gold trading higher against USD while JPY trades lower. Expectations that the Fed will ease in the near future is keeping gold prices supported. Although down off the recent highs, XAUUSD trades 1405.20 last, having found support at the 1391.61 level once again, keeping focus on further upside. USDJPY trades 108.45 last as price continues to fight to get back to the 108.78 level. The FOMC minutes later in the week should provide the main catalyst for price action this week.
Crude Capped
Oil prices have had a slow start to the week with crude still capped by the 57.85 level for now. The OPEC production cut extension announced last week failed lift off, instead, causing a counterintuitive drop lower which has yet to be recovered. While below 57.85, focus is on further downside in the near term.
Commodity Currencies Down For Now
USDCAD is benefitting from weaker oil prices today, which are weighing on CAD, keeping the pair just above support at the 1.3070 level. Price has been testing the level over recent days and if we see a recovery on oil over the coming sessions, we are likely to move below. The BOC meets this week and while no change in monetary policy is expected, the market will be keen to see if the bank maintains the resilient tone we heard last month, which should keep CAD further supported.
AUDUSD has traded a little lower over the European morning following a rally overnight. AUD remains bolstered by expectations renewed efforts to deliver a trade deal between the US and China, Australia’s largest trading partner. AUDUSD traded .6985 last, still below the .70 level for now.
In the H4 chart, XAUUSD tried to form a new rising impulse to update the high, but faced the strong resistance from bears, which made the pair return to the local low. As a result, the price may yet continue the correction towards 38.2% and 50.0% fibo at 1374.30 and 1354.34 respectively. The resistance is the high at 1438.97. If the pair breaks it, the instrument may continue growing towards long-term 618% fibo at 1510.00.
As we can see in the H1 chart, the pair is trading between the high and the target Fibonacci retracement, 38.2% at 1374.30.
USDCHF, “US Dollar vs Swiss Franc”
As we can see in the H4 chart, after reaching 50.0% fibo, USDCHF is forming a new correctional uptrend, which is heading towards the resistance at 23.6% fibo at 0.9989. After completing the pullback, the price may fall towards 61.8% fibo at 0.9588.
In the H1 chart, the uptrend continues. At the same time, there is a divergence on MACD, which may indicate a possible reverse soon. If the pair breaks the local support at 38.2% fibo at 0.9835, the instrument may start a new wave to the downside.
Attention! Forecasts presented in this section only reflect the author’s private opinion and should not be considered as guidance for trading. RoboForex LP bears no responsibility for trading results based on trading recommendations described in these analytical reviews.
The week ahead will be dominated by central banks once again. This week will see the Bank of Canada’s monetary policy decision alongside the release of the Federal Reserve monetary policy meeting minutes.
The recent uptick in Canada’s GDP could potentially give rise to a hawkish message from the BoC. Meanwhile, investors look to see how the FOMC minutes will shape the expectations of the Fed going forward.
On the economic front, the UK will be releasing its GDP data alongside industrial and production figures for June. Recent data has been broadly weak especially on the GDP front. The sterling is, however, expected to shrug aside the economic data in lieu of the Brexit developments.
China’s consumer inflation and producer prices index data will also be coming out this week. The data gains attention as investors weigh the prospects of the US-led tariffs and its impact on both consumer and producer prices. China’s inflation data will lay the groundwork in the run-up to next week’s other important data that include quarterly GDP figures.
Data from the eurozone takes a backseat, for the most part, this week. Industrial production figures are due as well as business and consumer surveys. We also expect the Sentix investor confidence report this week alongside Germany’s trade balance figures.
Here’s a quick recap of what’s to come in the currency markets this week.
US Inflation Data and Fed Minutes
Following a weak set of data from the Institute of Supply Management (ISM), and a subdued payrolls report, the expectations rise for a Fed rate cut. This was evident from the market rally last week which saw the US equity markets rising to fresh all-time highs.
This week, investors will get a glimpse into the Fed’s thinking on policy. The minutes will cover the June FOMC meeting where the Fed left interest rates unchanged. However, the central bank did announce that it would cut rates if the economy deteriorated.
Besides the FOMC meeting minutes, the week ahead will see the monthly consumer and producer prices index reports coming out. Inflation could ease back after weaker oil prices. The data could also further cement expectations of a rate cut.
US producer prices index is forecast to rise by 0.1% on the month in June. This marks the same pace of increase as the previous month. On a year over year basis, PPI is forecast to rise to 2.0%, up from 1.8% previously. Core PPI is forecast to remain steady, rising at a pace of 2.3%.
Will BoC Signal Hawkish Forward Guidance?
The BoC is unlikely to make any changes to its monetary policy. Therefore, interest rates will remain at 1.75%.
However, investors expect the BoC to shift its forward guidance from dovish to hawkish. This comes on the back of the recent economic data which has been somewhat positive. The latest monthly GDP reports saw the Canadian economy slowly gaining momentum.
Canada’s inflation, on the other hand, remains anchored to the BoC’s inflation target rate of 2.0%. The economic data will no doubt put the BoC on a hawkish path. This remains in contrast to many other central banks including the Fed who have turned dovish.
With most of the central banks signaling a dovish path, and some indicating a rate cut on the horizon, the BoC remains the sole central bank among the major economies that remains hawkish.
But we expect the central bank to use plenty of caution as it steers the global economic headwinds. Trade wars remain the major theme of uncertainty for monetary policy.
On Friday, the US published a fairly optimistic report on the labor market in June, which caused an increase in demand for USD. The dollar index (#DX) set new monthly highs. In the non-agricultural sector of the country, 224,000 new jobs were created, which is significantly higher than the forecasted value of 160,000. The growth of the average hourly wage did not meet market expectations and amounted to 0.2%. At the same time, the previous figure was revised upwards to 0.3%. The unemployment rate rose from 3.6% to 3.7%. At the moment, EUR/USD quotes are consolidating in the range of 1.12100-1.12400. Trading instrument has the potential to further decline. We recommend to open positions from key levels.
The Economic News Feed for 08.07.2019 is calm.
The price has fixed below 50 MA and 100 MA, which indicates the power of the sellers.
The MACD histogram is in the negative zone, but above the signal line, which gives a weak signal to sell EUR/USD.
The Stochastic Oscillator is located near the overbought zone, the %K line crossed the %D line. There are no signals at the moment.
Trading recommendations
Support levels: 1.12100, 1.11600
Resistance levels: 1.12400, 1.12750, 1.13100
If the price consolidates below the local support of 1.12100, the quotes will drop to 1.11700-1.11500.
Alternatively, quotes could recover to 1.12700-1.13000.
The GBP/USD currency pair
Technical indicators of the currency pair:
Prev Open: 1.25763
Open: 1.25248
% chg. over the last day: -0.43
Day’s range: 1.25207 – 1.25334
52 wk range: 1.2438 – 1.3631
Currency pair GBP / USD once again moved to a decline. The demand for USD has grown after the release of positive reports from the labor market. Tje rading tool updated key extremums and is consolidating in a rather narrow range of 1.25150-1.25350. In the near future, we deem a technical correction possible. Keep an eye on Brexit and open positions must be opened from key levels.
The Economic News Feed for 08.07.2019 is calm.
The price has fixed below 50 MA and 100 MA, which indicates the power of the sellers.
The MACD histogram is in the negative zone, but above the signal line, which gives a weak signal to sell GBP/USD.
The Stochastic Oscillator is in the neutral zone, the %K line is above the %D line, which indicates a bullish mood.
Trading recommendations
Support levels: 1.25150, 1.24850
Resistance levels: 1.25350, 1.25600, 1.26000
If the price consolidates below 1.25150, the quotes will move to 1.24850-1.24600.
Alternatively, the quotes may rise toward 1.25600-1.25800.
The USD/CAD currency pair
Technical indicators of the currency pair:
Prev Open: 1.30492
Open: 1.30660
% chg. over the last day: +0.19
Day’s range: 1.30660 – 1.30834
52 wk range: 1.2727 – 1.3664
On Friday USD/CAD had rather high trading activity. CAD was under pressure after a weak report on the labor market in Canada. At the moment, USD/CAD quotes are consolidating. Local levels of support and resistance are 1.30600 and 1.30850. Trading instrument can grow further. Pay attention to the dynamics of oil prices and open positions from key levels.
The Economic News Feed for 08.07.2019 is calm.
Indicators do not give accurate signals: the price crossed 50 MA and 100 MA.
The MACD histogram is located near the 0 mark.
The Stochastic Oscillator is in the neutral zone, the% K line crossed the% D line. There are no signals at the moment.
Trading recommendations
Support levels: 1.30600, 1.30400, 1.30000
Resistance levels: 1.30850, 1.31150, 1.31450
If the price consolidates above 1.30850, the quotes will grow to 1.31150-1.31400.
Alternatively, the quotes can descend to 1.30400-1.30200.
The USD/JPY currency pair
Technical indicators of the currency pair:
Prev Open: 107.811
Open: 108.435
% chg. over the last day: +0.61
Day’s range: 108.280 – 108.585
52 wk range: 104.97 – 114.56
The USD/JPY currency pair has stabilized after a sharp rise during Friday’s trading. At the moment, the trading instrument is consolidating. The key support and resistance levels are 108.250 and 108.600, respectively. USD/JPY quotes can grow further. Pay attention to the dynamics of the yield of US Treasury Bonds. Positions must be opened from key levels.
The Economic News Feed for 08.07.2019 is calm.
The price has fixed above 50 MA and 100 MA, which indicates the strength of buyers.
The MACD histogram is in the positive zone, but below the signal line, which gives a weak signal to buy USD/JPY.
The Stochastic Oscillator is in the oversold zone, the %K line crossed the %D line. There are no signals at the moment.
Trading recommendations
Support levels: 108.250, 108.000, 107.700
Resistance levels: 108.600, 109.000
If the price consolidates above the resistance level of 108.600, the quotes can grow to 109.000 round level.
Alternatively the quotes can fall to 108.000-107.800.
On Friday, the US dollar updated monthly highs against the publication of optimistic statistics on the labor market for June. Thus, the number of people employed in the nonfarm sector increased by 224K in June, while experts forecasted growth by 160K. The average hourly earnings growth did not meet market expectations and counted to 0.2%. At the same time, the previous figure was revised upwards to 0.3%. The unemployment rate rose from 3.6% to 3.7%. Traders suggest that the Fed will not sharply reduce the interest rate after such fairly positive data. On Friday, the US dollar index (#DX) closed in the positive zone (+0.58%).
On Friday, weak economic releases from Canada were also published. Thus, the employment rate fell by 2.2K in June, while investors expected an increase by 10.0K. Ivey PMI counted to 52.4 in June instead of the expected 55.0.
Boris Johnson, a front-runner to replace British Prime Minister, said that the country would most likely exit from the EU without a deal by October 31. “We were pretty much ready on March 29. And we will be ready by October 31,” he told the Sunday Telegraph. The official believes that the UK partners should understand that the country is ready for no-deal Brexit and should be worried about this. We recommend following the current information on the Brexit issue.
The “black gold” prices show positive dynamics. At the moment, futures for the WTI crude oil are testing the mark of $57.70 per barrel.
Market Indicators
On Friday, there was the bearish sentiment in the US stock markets: #SPY (-0.11%), #DIA (-0.11%), #QQQ (-0.20%).
The 10-year US government bonds yield has been recovering. Currently, the indicator is at the level of 2.02-2.03%.
The News Feed on 2019.07.08:
Today the publication of important economic news is not expected.