Large precious metals speculators edged their bullish net positions slightly lower in the Silver futures markets last week, according to the latest Commitment of Traders (COT) data released by the Commodity Futures Trading Commission (CFTC) on Monday (delayed due to July 4th holiday).
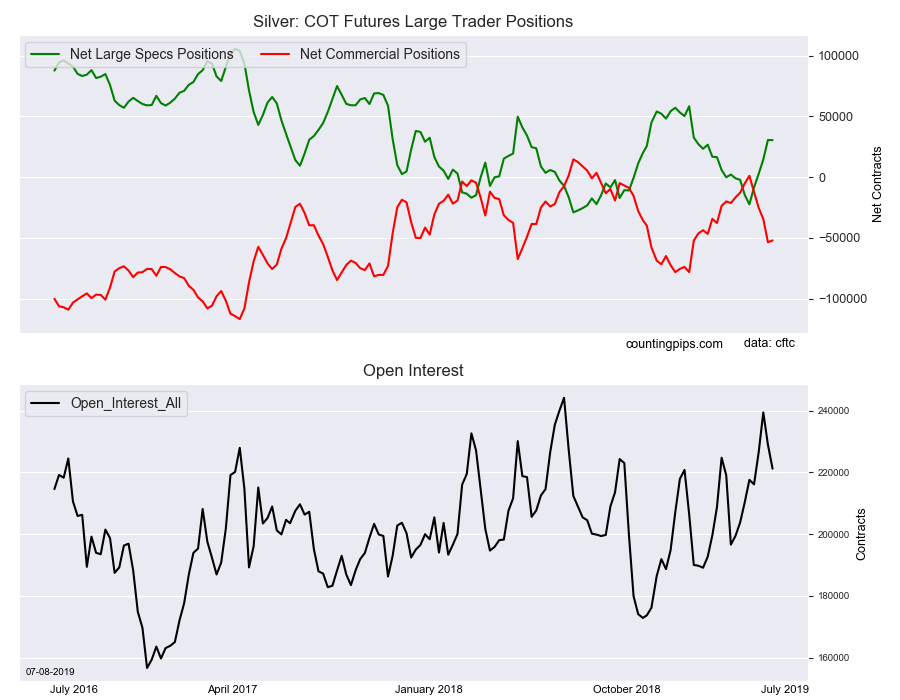
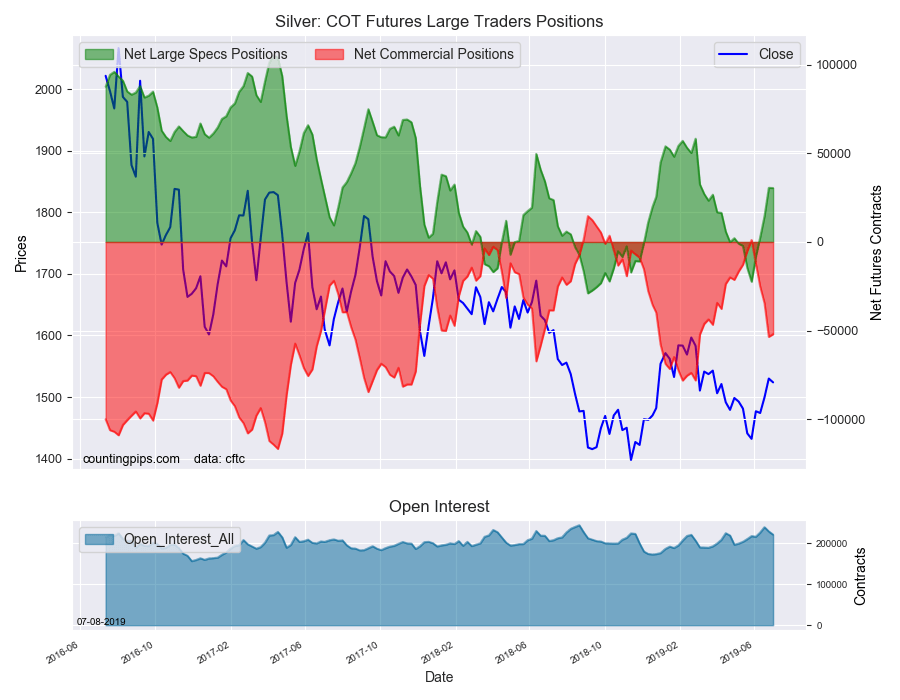
The non-commercial futures contracts of Silver futures, traded by large speculators and hedge funds, totaled a net position of 30,455 contracts in the data reported through Tuesday July 2nd. This was a weekly decline of -110 net contracts from the previous week which had a total of 30,565 net contracts.
The week’s net position was the result of the gross bullish position (longs) increasing by 2,166 contracts (to a weekly total of 99,739 contracts) while the gross bearish position (shorts) rose by 2,276 contracts for the week (to a total of 69,284 contracts).
The large speculator positions had gained very sharply for four straight weeks and by a total of +52,974 contracts over that period before last week’s slight pause. Silver’s recent bullish sentiment has spurred a dramatic turnaround from being bearish on June 4th with -8,443 net contracts.
The current standing for Silver speculative bets remains above the +30,000 net contract threshold for a second straight week, marking the first time since March bets have been this bullish.
Silver Commercial Positions:
The commercial traders position, hedgers or traders engaged in buying and selling for business purposes, totaled a net position of -52,063 contracts on the week. This was a weekly increase of 1,489 contracts from the total net of -53,552 contracts reported the previous week.
Silver Futures:
Over the same weekly reporting time-frame, from Tuesday to Tuesday, the Silver Futures (Front Month) closed at approximately $1523.80 which was a drop of $-6.20 from the previous close of $1530.00, according to unofficial market data.
*COT Report: The COT data, released weekly to the public each Friday, is updated through the most recent Tuesday (data is 3 days old) and shows a quick view of how large speculators or non-commercials (for-profit traders) as well as the commercial traders (hedgers & traders for business purposes) were positioned in the futures markets.
The CFTC categorizes trader positions according to commercial hedgers (traders who use futures contracts for hedging as part of the business), non-commercials (large traders who speculate to realize trading profits) and nonreportable traders (usually small traders/speculators).
Large precious metals speculators pushed their bearish net positions higher in the Copper futures markets last week, according to the latest Commitment of Traders (COT) data released by the Commodity Futures Trading Commission (CFTC) on Monday (delayed due to July 4th holiday).
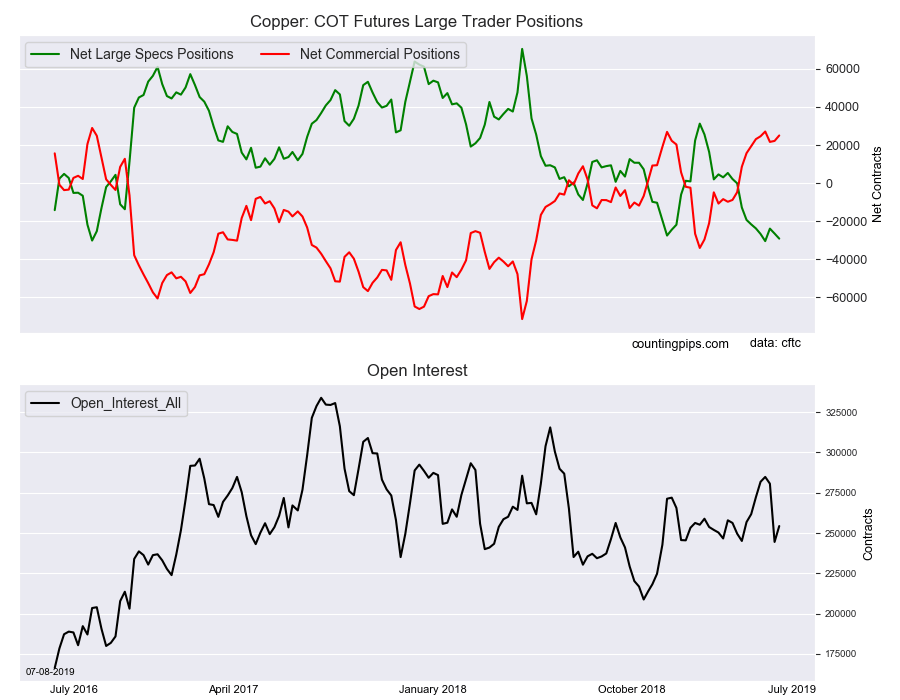
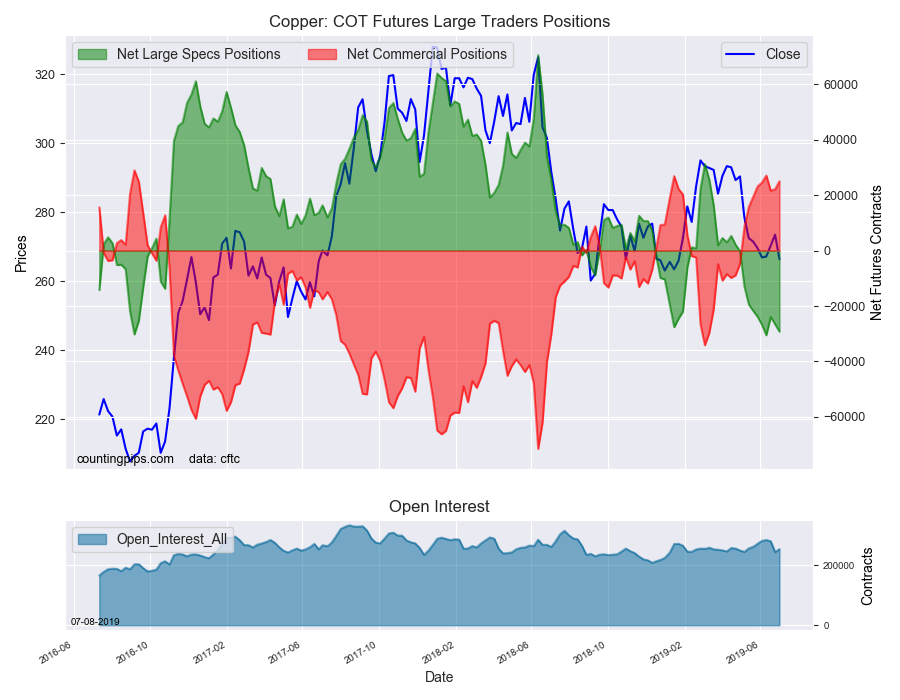
The non-commercial futures contracts of Copper futures, traded by large speculators and hedge funds, totaled a net position of -29,216 contracts in the data reported through Tuesday July 2nd. This was a weekly change of -2,677 net contracts from the previous week which had a total of -26,539 net contracts.
The week’s net position was the result of the gross bullish position (longs) rising by 3,181 contracts (to a weekly total of 76,478 contracts) while the gross bearish position (shorts) gained by 5,858 contracts for the week (to a total of 105,694 contracts).
The large speculators continued to up their bearish bets in Copper for a second consecutive week and for the tenth time out of the past eleven weeks.
The overall speculator standing has now been in bearish territory for ten straight weeks and has been above the -20,000 net contract level for seven straight weeks which comes in as the longest such streak since May and June of 2016 (which topped out at 7 weeks).
Copper Commercial Positions:
The commercial traders position, hedgers or traders engaged in buying and selling for business purposes, totaled a net position of 25,027 contracts on the week. This was a weekly uptick of 2,865 contracts from the total net of 22,162 contracts reported the previous week.
Copper Futures:
Over the same weekly reporting time-frame, from Tuesday to Tuesday, the Copper Futures (Front Month) closed at approximately $266.40 which was a fall of $-7.10 from the previous close of $273.50, according to unofficial market data.
*COT Report: The COT data, released weekly to the public each Friday, is updated through the most recent Tuesday (data is 3 days old) and shows a quick view of how large speculators or non-commercials (for-profit traders) as well as the commercial traders (hedgers & traders for business purposes) were positioned in the futures markets.
The CFTC categorizes trader positions according to commercial hedgers (traders who use futures contracts for hedging as part of the business), non-commercials (large traders who speculate to realize trading profits) and nonreportable traders (usually small traders/speculators).
The second half of the year is setting up favorably for the precious metals sector, which was led in the first half by gold and gold mining stocks.
Of course, the Wall Street-beholden financial media is largely ignoring metals and mining – preferring instead to give celebratory coverage to every move toward new highs in the Dow and S&P 500.
“The Dow Jones Industrial Average rallied 7.2% this month [June], notching its best June performance since 1938,” CNBC reported. “The S&P 500 posted its best first half of a year since 1997, soaring 17.3% and reaching an all-time high.”
That’s all well and good for conventional index investors.
But they are missing out on much bigger growth potential now being put on display by gold stocks.
For the month of June, the HUI gold miners index advanced 17.7% (more than double the Dow’s performance). The index is up over 30% since its low point in late May.
It’s not unusual for an annual rally in this volatile sector to produce a doubling of the majors’ share prices. For the more speculative juniors, gains can often be measured in multiples of 100%.
When things are going their way, there is no better sector than mining stocks for spectacular profit potential. When things aren’t, miners will burn investors far worse than any broad market index fund ever will.
Similarly, shares of gold and silver producers tend to amplify both the gains and the losses that occur in the underlying physical metals. Even a relatively modest correction in metal prices can translate into a crash in the equities.
Historically, the devasting declines produced during bear markets for mining stocks have outweighed the gains of bull markets. Over the past two decades, buy-and-hold investors have experienced lower risk and higher overall returns from bullion as compared to shares.
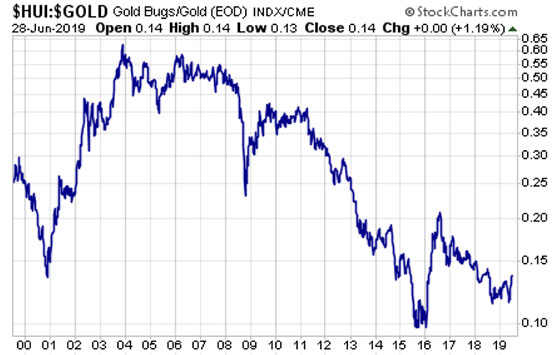
Investors may be surprised to learn that physical gold outperforms miners over the long run. The chart below – a 20-year look at the performance of the HUI gold miners index relative to spot gold prices – proves it:
Gold equities are suitable for traders and speculators who have a high tolerance for risk. Gold bullion is better suited for long-term investors and hedgers who seek to guard against risks in the financial system.
During the turbulent market conditions of 2008, gold prices finished the year in positive territory. The HUI index lost nearly 30% of its value.
At the end of the day, stocks are financial assets – regardless of whether they are associated with hard asset producing businesses. A mining business can go bankrupt; its shares can go to zero. A gold or silver coin will never become worthless.
Precious metals bulls who prefer to stick with physical bullion can still take some encouragement from periods when the mining sector gets hot. A sharp rise in gold and silver equities (as seen from late May through June this year) often precedes a sharp rise in the metals.
We haven’t yet seen silver move strongly to the upside. Prices remain extremely depressed in absolute terms and relative to gold and other metals.
Market guru Greg Weldon sees silver’s long, drawn out base as being akin to a “launching pad. We’re waiting for the countdown, we’re waiting for ignition.”
In a recent interview with Money Metals, Weldon noted the bullish price action in the major silver mining exchange traded fund (SIL). “When you look at the SIL versus the price of silver, it’s flipping right now, where the silver mining shares are beginning to grab the torch of upside leadership here. So to me, all that bodes very well for silver,” he said.
Silver tends to trade more volatile than gold. During bull markets, silver often performs like gold on steroids.
Though lately the white metal seems to have lost its mojo, it will eventually get it back. The technical setup suggests that could happen sooner rather than later (but investors should still be prepared to exercise patience).
Physical silver is a great choice for investors who want to capture upside potential similar to that of mining stocks while holding a hard asset that has historically served as money.
Given that the gold:silver ratio trades at a generational extreme of over 92:1, there may never be better time from a value perspective to favor silver. If the signal of the mining sector is accurate, silver is just about ready to launch.
The Money Metals News Service provides market news and crisp commentary for investors following the precious metals markets.
The reasons for the positive outlook are presented in a Pareto Securities report.
In a July 2 research note, analyst Tom Erik Kristiansen reported that Pareto Securities raised its year-end 2020 production estimate but lowered its target price on Panoro Energy ASA (PEN:OSE; 1PZ:FRA) to NOK 22 per share from NOK 23. Buy-rated Panoro is currently trading at NOK 16.70 per share.
Pareto decreased its target price on Panoro to “adjust for the operator’s (BW Energy) new and more conservative estimate of the resource potential of the largest exploration prospects on the [Dussafu] block” in Gabon, explained Kristiansen.
As for the energy company’s net production, Pareto expects Dussafu block output to more than double over the next three years due to Phase 2 of the Tortue development and a final investment decision of Ruche and Ruche North East, both expected this year, Kristiansen indicated. Additionally, Panoro also guided to 25% production growth at its Tunisian fields by year-end 2019, “which we find impressive considering that the asset was acquired less than one year ago (with no growth expected),” the analyst added.
Pareto increased its overall production estimates on the company for 2019 and 2020 by 4% and 24%, respectively. This means Panoro could double production to 4,000 barrels of oil equivalent (4,000 boe/day) by year-end 2022 and also reduce opex by 3040% to $15/boe.
Regarding that anticipated production growth, Kristiansen highlighted that significant potential exists for derisking it as well as for further upside via exploration and appraisal drilling. This is because exploration wells will be drilled, one each, at Hibiscus and Salloum in H2/19. Were the latter well to produce the 1,800 boe/day gross that it did on a short test, it would boost Panoro’s production amply and with high value barrels.
Kristiansen concluded that Pareto sees “significant near-term upside as Panoro continues to grow production and prove up more of the exploration potential on its blocks.” Also, he noted, “we think Panoro could surprise on the upside with further accretive mergers and acquisitions.”
Disclosure: 1) Doresa Banning compiled this article for Streetwise Reports LLC and provides services to Streetwise Reports as an independent contractor. She or members of her household own securities of the following companies mentioned in the article: None. She or members of her household are paid by the following companies mentioned in this article: None. 2) The following companies mentioned in this article are billboard sponsors of Streetwise Reports: None. Click here for important disclosures about sponsor fees. 3) Comments and opinions expressed are those of the specific experts and not of Streetwise Reports or its officers. The information provided above is for informational purposes only and is not a recommendation to buy or sell any security. 4) The article does not constitute investment advice. Each reader is encouraged to consult with his or her individual financial professional and any action a reader takes as a result of information presented here is his or her own responsibility. By opening this page, each reader accepts and agrees to Streetwise Reports’ terms of use and full legal disclaimer. This article is not a solicitation for investment. Streetwise Reports does not render general or specific investment advice and the information on Streetwise Reports should not be considered a recommendation to buy or sell any security. Streetwise Reports does not endorse or recommend the business, products, services or securities of any company mentioned on Streetwise Reports. 5) From time to time, Streetwise Reports LLC and its directors, officers, employees or members of their families, as well as persons interviewed for articles and interviews on the site, may have a long or short position in securities mentioned. Directors, officers, employees or members of their immediate families are prohibited from making purchases and/or sales of those securities in the open market or otherwise from the time of the interview or the decision to write an article until three business days after the publication of the interview or article. The foregoing prohibition does not apply to articles that in substance only restate previously published company releases.
Disclosures from Pareto Securities AS, Panoro Energy, July 2, 2019
This publication or report has been prepared solely by Pareto Securities Research.
Opinions or suggestions from Pareto Securities Research may deviate from recommendations or opinions presented by other departments or companies in the Pareto Securities Group. The reason may typically be the result of differing time horizons, methodologies, contexts or other factors.
Analysts Certification The research analyst(s) whose name(s) appear on research reports prepared by Pareto Securities Research certify that: (i) all of the views expressed in the research report accurately reflect their personal views about the subject security or issuer, and (ii) no part of the research analysts compensation was, is, or will be directly or indirectly related to the specific recommendations or views expressed by the research analysts in research reports that are prepared by Pareto Securities Research.
The research analysts whose names appears on research reports prepared by Pareto Securities Research received compensation that is based upon various factors including Pareto Securities total revenues, a portion of which are generated by Pareto Securities investment banking activities.
Conflicts of interest
Companies in the Pareto Securities Group, affiliates or staff of companies in the Pareto Securities Group, may perform services for, solicit business from, make a market in, hold long or short positions in, or otherwise be interested in the investments (including derivatives) of any company mentioned in the publication or report.
In addition Pareto Securities Group, or affiliates, may from time to time have a broking, advisory or other relationship with a company which is the subject of or referred to in the relevant Research, including acting as that companys official or sponsoring broker and providing corporate finance or other financial services. It is the policy of Pareto to seek to act as corporate adviser or broker to some of the companies which are covered by Pareto Securities Research. Accordingly companies covered in any Research may be the subject of marketing initiatives by the Corporate Finance Department.
To limit possible conflicts of interest and counter the abuse of inside knowledge, the analysts of Pareto Securities Research are subject to internal rules on sound ethical conduct, the management of inside information, handling of unpublished research material, contact with other units of the Group Companies and personal account dealing. The internal rules have been prepared in accordance with applicable legislation and relevant industry standards. The object of the internal rules is for example to ensure that no analyst will abuse or cause others to abuse confidential information. It is the policy of Pareto Securities Research that no link exists between revenues from capital markets activities and individual analyst remuneration. The Group Companies are members of national stockbrokers associations in each of the countries in which the Group Companies have their head offices. Internal rules have been developed in accordance with recommendations issued by the stockbrokers associations.
This material has been prepared following the Pareto Securities Conflict of Interest Policy. The guidelines in the policy include rules and measures aimed at achieving a sufficient degree of independence between various departments, business areas and sub-business areas within the Pareto Securities Group in order to, as far as possible, avoid conflicts of interest from arising between such departments, business areas and sub-business areas as well as their customers. One purpose of such measures is to restrict the flow of information between certain business areas and sub-business areas within the Pareto Securities Group, where conflicts of interest may arise and to safeguard the impartialness of the employees. For example, the Corporate Finance departments and certain other departments included in the Pareto Securities Group are surrounded by arrangements, so-called Chinese Walls, to restrict the flows of sensitive information from such departments. The internal guidelines also include, without limitation, rules aimed at securing the impartialness of, e.g., analysts working in the Pareto Securities Research departments, restrictions with regard to the remuneration paid to such analysts, requirements with respect to the independence of analysts from other departments within the Pareto Securities Group rules concerning contacts with covered companies and rules concerning personal account trading carried out by analysts.
Pareto Securities AS may have prepared or distributed investment recommendation, where Pareto Securities AS has been lead manager/co-lead manager or have rendered publicly known not immaterial investment banking services over the previous 12 months: Panoro Energy.
Pareto Securities AS may hold financial instruments in companies where a recommendation has been produced or distributed by Pareto Securities AS in connection with rendering investment services, including Market Making.
Gold and silver bugs are well aware that JPMorgan Chase dominates precious metals futures trading. Russ and Pam Martens of the financial blog Wall Street on Parade just identified how much control they have.
There are more than 5,300 FDIC insured banks in the U.S. Just two of them, JPMorgan and Citibank, hold 75.7% of all precious metals derivative contracts (primarily futures) in possession of the nation’s banks.
Other major Wall Street banks, including Goldman Sachs and Bank of America, are barely even in the game.
The market dominance implied by the outsized positions of these two banks is troubling enough. Metals investors have been pleading with regulators to step in for more than a decade, so far to no avail.
The most interesting part of the story, however, isn’t the monopoly power these banks wield in the futures markets. That’s been pretty well understood. Rather, it is the massive increase in the size of the position since the 2008 Financial Crisis.
Ten years ago, FDIC insured banks held metals contracts valued at less than $15 billion. Today they hold $38.6 billion – an increase of 157%.
Again, JPMorgan and Citi control more than three quarters of that position. It is one more confirmation that the futures markets are hopelessly broken and corrupted. Price discovery is not organic, it is rigged.
Regulators turned a blind eye as the bullion banks issued freshly printed contracts to any and all speculators willing to bet on higher gold and silver prices. There is effectively zero constraint on the supply of paper contracts. Demand is never enough to overwhelm supply and push prices consistently higher.
Piles of evidence now show the bullion banks using their dominant position and inside information to rig price movements lower – by hook and by crook. They profit over and over again from their huge, and perpetually growing, short position.
We continue to marvel at the lack of concern from regulators. These banks are, at this point, in plain view building monopoly positions in the highly leveraged futures markets. And they may be relying on price rigging to make those positions profitable.
It isn’t just that this sort of activity is crooked. It is also exceptionally risky.
These banks are FDIC insured, and FDIC funds may not be sufficient in the event of a major collapse. (Some believe it would be better if the FDIC did not exist and people had to think carefully about where to do their banking.)
Taxpayers could wind up footing the bill in a couple different scenarios…
For one, these bankers could be wagering more than they can afford to lose on highly leveraged derivatives of all sorts. We saw it happen in 2008, though the banks were rewarded with bailouts instead of being closed by officials.
The banks could also finally be held accountable in court for what they have done.
It may seem unlikely to jaded gold bugs, but there is hope.
The game is changing because the traditional bank regulators are losing control.
Bankers may be forced to answer to prosecutors, citizen juries, and class action attorneys in the next few years.
The Department of Justice is investigating now. One Vice President at JPMorgan and one bullion bank (Deutsche Bank) have already pled guilty. Both agreed to cooperate by providing evidence against other executives and banks involved in their rigging schemes.
As hard as it may be to imagine, JPMorgan and Citi could be bankrupted by fines, loss of trading privileges, and massive civil judgments piled on top of a loss of client and investor confidence.
Yes, we’ll understand if people scoff at the notion of a major Wall Street bank finally paying for their sins. It will be a first.
The Money Metals News Service provides market news and crisp commentary for investors following the precious metals markets.
This week is relatively quiet on the economic calendar for Australia. This means the AUDUSD is likely to move more on external events over the next few days.
Of the more important events coming up, overnight we get NAB Business Confidence. The day after tomorrow, we get the consumer confidence survey.
Most of the data we are getting is still from before the recent G20 meeting in which Trump and Xi met and, once again, agreed to a truce over the trade dispute.
While this is seen as a positive step, a lot of investors are still wary given the last time there was a pause, not much came from it. So, even when the new data comes out, we probably won’t see much of a change in outlook.
What We Are Looking For
There are two data points coming from the NAB tomorrow in the early morning. The one the market focuses more on is the Business Confidence number over the Business Conditions. This covers how businesses expect their markets to develop over the next six months, and is useful as a forward-looking date.
The consensus of expectations for the NAB Business Confidence figure is 2 compared to 7 in the prior month. This keeps it in growth territory, but barely. It’s also a return to the March level, which is well below the average of the last couple of years.
We can expect NAB Business Conditions to improve to 3 from 1 prior, reflecting the bump in projections we saw last time around.
The Election Effect
Last month, the NAB Business Survey came in with a relatively high number following the election. This was a combination of both the relief of getting over that bit of uncertainty and the positivity associated with the new government’s pledge to cut taxes.
The question now is whether that momentum maintains going forward, or whether it was a one time bump and sentiment will settle back into its prior somewhat dour outlook. There are several data points that suggest that May’s result was a one-off.
The Long Arm of the Fed
The first factor is a consideration regarding the Fed’s expected rate cut. During the time of the survey, the market was already pricing in at least a 0.25% rate cut in July. Then we had the better than expected NFP results on Friday which dampened that outlook.
However, with the RBA cutting twice and the Fed not in the same boat, the interest rate differential does not favor capital flows to Australia.
The survey was also done before the RBA made its second cut, though at the time there was a pretty broad consensus that there would be one.
Other Views
Private surveys of business confidence conducted late last week show that businesses seem to have the same views as in May, with a slim majority expecting good conditions for the foreseeable future.
That doesn’t mean that they are willing to invest, however. An increasing number are saying they are looking to hold off investment for now. Tasmania and Victoria being the exceptions to a general antipathy in the business sector, both performing quite well.
Analysts are billing this week’s events as a test to see if the election and RBA are having the desired effect on the markets. Should we get disappointing data, it might be a poor sign for Aussie strength in the long term.
This final portion of our multiple part research post regarding the future of a crisis-like price revaluation event will focus on two components that we want to highlight for every trader, investor, and reader. It does not matter if you are invested in anything at this point – you need to read this last portion of our research because you need to plan for and prepare for this next event.
This SPY chart highlights what our research team believes to be the current outcome of the US stock market given our predictive modeling systems, price rotation modeling and other proprietary utilities we use to conduct our research. We believe the current upside price rally is a push to establish price levels above $300 on this SPY chart, just as we suggested in the June 11 article, and that this attempt a major psychological price level ($300) will likely become an exhaustion rally point where price immediately rotates lower – attempting to find support. We believe temporary price support will be found near $287 to $298 where the price will briefly stall and move slightly higher into August 2019.
It is at this point that our cycle research becomes critical for technical traders. This price rotation will set up a final leg to a larger Pennant/Flag formation with the potential for that last upside price leg, in August, to become a “washout high” price move. This happens when price fakes a price move/trend, causing investors to believe a breakout or breakdown more is taking place and JUMP IN, then price immediately reverses direction.
It is extremely important for all technical traders to understand our original price predictions, from March 31, 2019, and our current price predictions, from June 11, 2019, align with this current article in certain aspects. Price is going to target the psychological $300 level in the SPY. Price is going to continue forming into a Pennant/Flag formation. And the price will likely peak in late August or early September – just as we have predicted.
We expect this price rotation, or price revaluation event, to attempt to find support as we have highlighted on this chart. If these levels fail to hold as price support, then we could be in for a much deeper price revaluation event. We don’t believe that will be the case as the US elections and other factors should prevent the price from falling too far below the $245 level.
Expect some increased price volatility over the next 30+ days. Expect Gold and Silver to properly reflect the FEAR and GREED that is prevalent within the global markets. Expect many traders will be caught off guard when this $300 level on the SPY is breached as many will be thinking “we are off to the races – time to pile into the LONG SIDE”. We believe this is the wrong action to take.
We’ll keep you informed as this plays out with Wealth Building & Global Financial Reset Newsletter and if you like what I offer, join me with the 1 or 2-year subscription to lock in the lowest rate possible and ride my coattails as I navigate these financial market and build wealth while others lose nearly everything they own during the next financial crisis. Join Now and Get a Free 1oz Silver Round or Gold Bar!
I can tell you that huge moves are about to start unfolding not only in metals, or stocks but globally and some of these super cycles are going to last years. A gentleman by the name of Brad Matheny goes into great detail with his simple to understand charts and guide about this. His financial market research is one of a kind and a real eye-opener. PDF guide: 2020 Cycles – The Greatest Opportunity Of Your Lifetime
As a technical analysis and trader since 1997, I have been through a few bull/bear market cycles. I believe I have a good pulse on the market and timing key turning points for both short-term swing trading and long-term investment capital. The opportunities are massive/life-changing if handled properly.
Gold limped into the trading week bearing battle scars from last Friday’s NFP induced selloff. Prices are struggling to keep above the $1400 level as of writing and could sink further thanks to the Dollar.
Investors seem to be re-evaluating whether the Federal Reserve will cut interest rates this month following the stonrg US jobs data and this continues to be reflected in the Dollar’s positive valuation. A resurgent Greenback complemented up with fading hopes of a Fed cut is certainly bad news for zero-yielding Gold in the near term.
However, Gold bulls are unlikely to lose sleep over this development given how global growth concerns, trade uncertainty and other geopolitical risks linger in the vicinity. Although the Fed may think twice before pulling rate cut trigger this month, the central bank is highly to act before year-end.
Away from the fundamentals, the technical illustrate a bullish picture on the daily charts. The trend points south despite Friday’s heavy selloff with buyers in control above $1380. A technical rebound from the $1380-$1400 region should inject bulls with enough inspiration to challenge $1430 and beyond.
Alternatively, a breakdown below $1380 should spark a depreciation towards $1360.
GBPUSD aggressively knocks on 1.2500’s door
Buying sentiment towards the Pound continues to diminish by the day as the poisonous combination of Brexit uncertainty, political risk, recession fears cripple appetite for the currency.
The GBPUSD is heavily bearish on the daily charts and has space for further downside amid an appreciating Dollar. A solid breakdown below 1.2500 should open the gates towards 1.2420 in the near term.
This setup will most likely be influenced by the pending GDP m/m report on Wednesday morning.
Disclaimer: The content in this article comprises personal opinions and should not be construed as containing personal and/or other investment advice and/or an offer of and/or solicitation for any transactions in financial instruments and/or a guarantee and/or prediction of future performance. ForexTime (FXTM), its affiliates, agents, directors, officers or employees do not guarantee the accuracy, validity, timeliness or completeness, of any information or data made available and assume no liability as to any loss arising from any investment based on the same.
At the beginning of the week, Oil prices are stable as Brent is trading at 64.42 USD.
Right now, there are no obvious speculative drivers that may push the commodity market in some particular direction. According to the weekly report on the Crude Oil Inventories and the Natural Gas Storage, both indicators are going down, which is quite okay for this time of the year. The Middle-East factor is rather calm, so there is no support to aggressive buyers. Moreover, the USD is looking pretty stable, but this week may change a lot.
The Baker Hughes Oil Rig Count report published last week turned out to be in favor of bulls. The report showed -4 units in comparison with the previous week and 963 units total. On YoY, the decline has already reached 89 units, which is quite serious.
To be more detailed, the current number of oil rigs is 788 units, while the highest number in 2018 was 888 units.
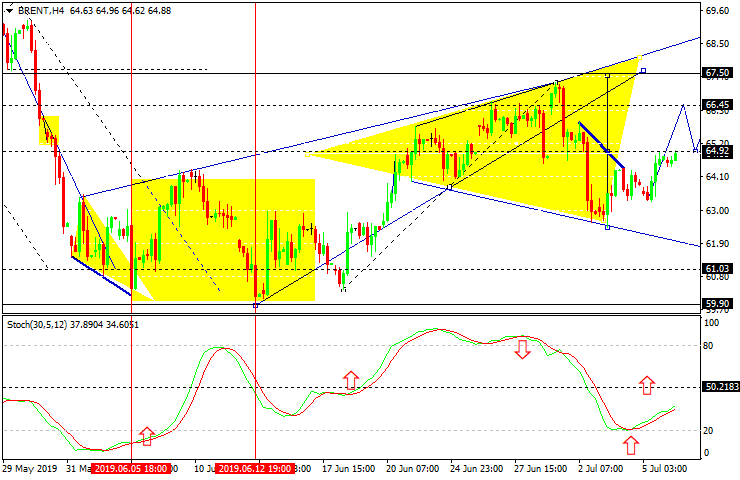
In the H4 chart, Brent is trading upwards. Possibly, the pair may grow with the first target at 67.50. Later, the market may start a new correction to reach 63.75 and then resume trading inside the uptrend with the short-term target at 70.00. From the technical point of view, this scenario is confirmed by Stochastic Oscillator, as its signal has reversed away from the “oversold area” and is currently moving upwards.
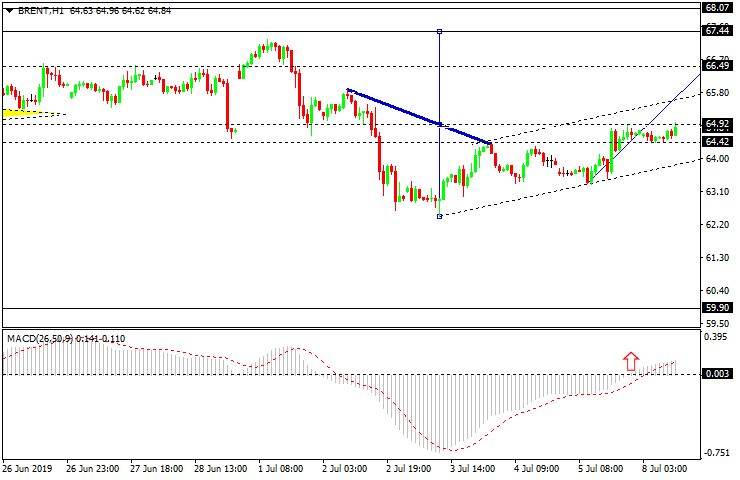
As we can see in the H1 chart, Brent is trading to break 64.90. After that, the instrument may continue trading inside the uptrend with the short-term target at 65.50 and then start a new correction towards 65.00. Later, the market may form one more ascending structure with the first target at 67.50. From the technical point of view, this scenario is confirmed by MACD Oscillator, as its signal line has broken 0 to the upside. As a result, the price may boost its growth towards 66.50.
Disclaimer
Any predictions contained herein are based on the authors’ particular opinion. This analysis shall not be treated as trading advice. RoboForex shall not be held liable for the results of the trades arising from relying upon trading recommendations and reviews contained herein.
The terms and benefits of the deal are discussed in a BMO Capital Markets report.
In a July 2 research note, BMO Capital Markets analyst Brian Quast reported that B2Gold Corp. (BTG:NYSE; BTO:TSX; B2G:NSX) agreed to sell its Nicaraguan assets to Calibre Mining for $100 million and a roughly 31% equity interest in Calibre. Closing of the deal is slated for October 2019.
The two gold mines being sold are El Limon and La Libertad, which together contribute about 150,000 ounces per year, or approximately 15% of B2 Gold’s total production.
Per the agreement, Calibre Mining will pay, on closing, $40 million in cash, 40 million Calibre common shares (valued at CA$0.60 per share) and a $10 million convertible debenture. Calibre will pay another $10 million in cash a year after the closing. With the transaction, B2Gold’s interest in Calibre will increase to about 31% from 11.9%.
BMO Capital considers the deal “positive” and the price “fair,” given it values the two mines together at CA$240 million, CA$225 million for El Limon and CA$15 million for La Libertad, Quast wrote. “With Nicaragua being a less traditional mining jurisdiction, and both mines underperforming expectations of late, it was unlikely that any acquirer was going to pay over net present value for either of these assets,” he added.
Quast highlighted that “the divestiture will allow B2Gold to better focus on optimizing and growing its larger, lower-cost assets.” It also will result in a lower all-in sustaining cost for the miner, decreasing to CA$665 per ounce from CA$683 per ounce.
BMO Capital has an Outperform rating and a CA$5.50 per share target price on B2Gold, whose stock is currently trading at around CA$3.94 per share.
Disclosure: 1) Doresa Banning compiled this article for Streetwise Reports LLC and provides services to Streetwise Reports as an independent contractor. She or members of her household own securities of the following companies mentioned in the article: None. She or members of her household are paid by the following companies mentioned in this article: None. 2) The following companies mentioned in this article are billboard sponsors of Streetwise Reports: None. Click here for important disclosures about sponsor fees. 3) Comments and opinions expressed are those of the specific experts and not of Streetwise Reports or its officers. The information provided above is for informational purposes only and is not a recommendation to buy or sell any security. 4) The article does not constitute investment advice. Each reader is encouraged to consult with his or her individual financial professional and any action a reader takes as a result of information presented here is his or her own responsibility. By opening this page, each reader accepts and agrees to Streetwise Reports’ terms of use and full legal disclaimer. This article is not a solicitation for investment. Streetwise Reports does not render general or specific investment advice and the information on Streetwise Reports should not be considered a recommendation to buy or sell any security. Streetwise Reports does not endorse or recommend the business, products, services or securities of any company mentioned on Streetwise Reports. 5) From time to time, Streetwise Reports LLC and its directors, officers, employees or members of their families, as well as persons interviewed for articles and interviews on the site, may have a long or short position in securities mentioned. Directors, officers, employees or members of their immediate families are prohibited from making purchases and/or sales of those securities in the open market or otherwise from the time of the interview or the decision to write an article until three business days after the publication of the interview or article. The foregoing prohibition does not apply to articles that in substance only restate previously published company releases.
Disclosures from BMO Capital Markets, B2Gold, July 2, 2019
IMPORTANT DISCLOSURES
Analyst’s Certification I, Brian Quast, hereby certify that the views expressed in this report accurately reflect my personal views about the subject securities or issuers. I also certify that no part of my compensation was, is, or will be, directly or indirectly, related to the specific recommendations or views expressed in this report.
Analysts who prepared this report are compensated based upon (among other factors) the overall profitability of BMO Capital Markets and their affiliates, which includes the overall profitability of investment banking services. Compensation for research is based on effectiveness in generating new ideas and in communication of ideas to clients, performance of recommendations, accuracy of earnings estimates, and service to clients.
Analysts employed by BMO Nesbitt Burns Inc. and/or BMO Capital Markets Limited are not registered as research analysts with FINRA. These analysts may not be associated persons of BMO Capital Markets Corp. and therefore may not be subject to the FINRA Rule 2241 restrictions on communications with a subject company, public appearances and trading securities held by a research analyst account.
Company Specific Disclosures Disclosure 9B: BMO Capital Markets makes a market in B2Gold in United States.