SP500 posts back-to-back loss

By IFCMarkets

Dollar strengthening intact

US stock market continued their retreat on Monday led by communication services and materials shares. The S&P 500 lost 0.5% to 2975.95. Dow Jones industrial slid 0.4% to 26806.14. The Nasdaq composite fell 0.8% to 8098.38. The dollar strengthening continued : The live dollar index data show the ICE US Dollar index, a measure of the dollar’s strength against a basket of six rival currencies, added 0.1% to 97.36 and is higher currently. Stock index futures point to lower market openings today

DAX 30 leads European indexes losses

European stocks extended losses on Monday led by banking shares. Both GBP/USD and EUR/USD continued falling and are lower currently. The Stoxx Europe 600 index slid 0.05%. The DAX 30 lost 0.7% to 12543.51 weighed by 5% drop in Deutsche Bank after news it would pull out of its global equities sales and trading operations. France’s CAC 40 slid 0.08% and UK’s FTSE 100 slipped 0.05% to 7549.27.

Hang Seng leads Asian indexes losses

Asian stock indices are mostly falling today. Nikkei however closed 0.1% higher at 21565.15 with yen slide against the dollar intact. Markets in China are retreating: the Shanghai Composite Index is down 0.2% and Hong Kong’s Hang Seng Index is 0.8% lower. Australia’s All Ordinaries Index extended losses 0.1% despite Australian dollar’s accelerating slide against the greenback.
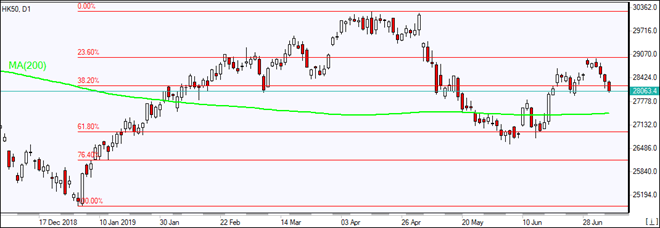
FR40 falling toward MA(200)   07/09/2019 Market Overview IFC Markets chart

Brent futures prices are edging higher today supported by Middle East tensions as Iran claimed it was enriching uranium above the 3% level agreed in the 2015 nuclear deal, and threatened retaliation for the UK seizure of Iranian oil tanker last week. Prices fell yesterday: September Brent crude lost 0.2% to $64.11 a barrel on Monday.

Market Analysis provided by IFCMarkets

Note:
This overview has an informative and tutorial character and is published for free. All the data, included in the overview, are received from public sources, recognized as more or less reliable. Moreover, there is no guarantee that the indicated information is full and precise. Overviews are not updated. The whole information in each overview, including opinion, indicators, charts and anything else, is provided only for familiarization purposes and is not financial advice or а recommendation. The whole text and its any part, as well as the charts cannot be considered as an offer to make a deal with any asset. IFC Markets and its employees under any circumstances are not liable for any action taken by someone else during or after reading the overview.
Huge Gap between US Markets and International Trade

By Dan Steinbock

Globalization is not a concern to the Trump administration, which seeks to sustain high market valuations that are not supported by the fundamentals. As a result, a global recession in 2020 would not be the worst scenario.

Since the mid-1980s, the Baltic Dry Index (BDI) has been used as a barometer of international commodity trade. It is also seen as an economic indicator of future economic growth and production.

During the years of globalization, the Index heralded the peak of the oil prices and soared to a record high in May 2008 reaching 11,793 points. But as the financial crisis spread in the advanced West, the BDI plunged by 94% to 663 points, the lowest since 1986. That’s when marine shippers were moving dangerously close to the combined operating costs of vessels, fuel, and crews.

As China and other large emerging economies chose to support the ailing advanced economies amid the global crisis in fall 2008, the US, the EU and Japan pledged they would accelerate reforms in global governance. Moreover, the central banks of the major advanced economies launched massive fiscal stimulus packages and monetary easing.

As a result, the Index returned to 4,661 in 2009. However, as promises of reforms were ignored and stimulus policies expired, the BDI bottomed out at 1,043 in early 2011, amid the European sovereign debt crisis.

During the past years, advanced economies have sustained a semblance of stability by relying on historically ultra-low interest rates (while the US Federal Reserve did exit from normalization, it is now pondering a return to rate cuts) and massive injections of quantitative easing.

Stagnation, despite hyper-monetary policies

Yet, these huge shifts have not been reflected by the BDI, which continues to stagnate, as do the advanced economies.

Another turn for the worse followed with US protectionist moves. As long as the Trump administration engaged in protectionist rhetoric but avoided a trade war, the BDI climbed to almost 1,600. As Trump opted for the trade war, the Index fell to less than 700 in early 2019 – close to its historical low amid the 2008 crisis.

Recently, there has been much optimism about the “resurgence” of the Index as the trade truce has supported its rise back to over 1,700. Yet, this increase is predicated on the trade truce. Moreover, it is a level that the Index first reached already in 2000 and the mid-1990s.

Here’s the bottom line that should worry us all: Despite huge stimulus packages after the 2008 global crisis, a decade of massive monetary injections and record-low interest rates, there has been no corresponding pickup in world trade.

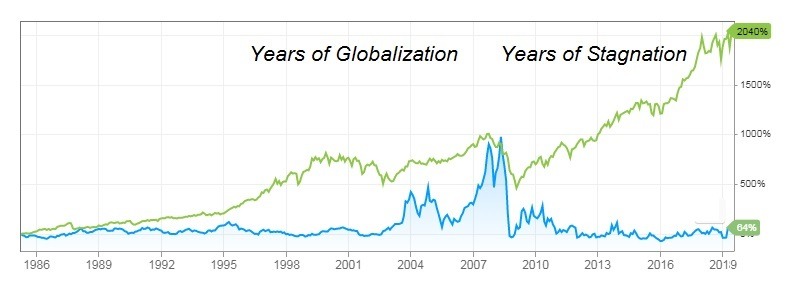
In contrast, the fate of the equities, as evidenced by the Dow Jones Industrial Average (DJIA), has been very different. In the past decade, the DJIA more than tripled from its crisis low of less than 8,000 to its peak of 26,966 in early 2018, before Trump launched his war path. Supported with the trade truce, it is now again close to its historical high at more than 26,900 (Figure).

Figure Years of Globalization, Years of Stagnation, 1985-2019

Source: Bloomberg; Baltic Dry Index; CNBC; Difference Group


Huge gap between US markets and international realities

Since the 1980s, international commodity trade, as proxied by the Baltic Dry Index, has increased by 64 percent. It remains today a tenth of its high in 2008. Meanwhile, US equities, as proxied by the Dow Jones Index, have increased by 2,040 percent. US equities have grown more than 30 times faster than international trade.

But why has the BDI not returned to its pre-crisis high? And why has it not climbed beyond that peak as the equity markets have done so triumphantly?

After all, in the past decade, world population has increased by some 1 billion people (more than three times the US population) and world GDP by almost $25 trillion (or the size of all 28 EU economies plus Japan together). Given presumably peaceful conditions, it is only fair to expect international trade would expand accordingly.

What is clear is that the current gap between US market highs and international economic realities is precipitating a global recession by 2020, given the current trends. And that is the benign – not the malignant – scenario. US market prices remain twice as high as their historical averages (in light of the cyclically-adjusted price-earnings ratio).

Worse, as US markets thrive whereas international fundamentals – including trade – stagnate, the gap between the two is paving way to a drastic market correction in the future that could prove far more disruptive and longer-lasting than the 2008 crisis.

[The commentary is based on Dr Steinbock’s recent presentation: “The Anomaly of US Markets and International Trade”]

About the Author:

Dr. Dan Steinbock is an internationally recognized strategist of the multipolar world and the founder of Difference Group. He has served at India, China and America Institute (US), Shanghai Institutes for International Studies (China) and the EU Center (Singapore). For more, see https://www.differencegroup.net/  


Despite Q2/19 Production Setback, Miner Intends to Meet Full-Year Guidance

By The Gold Report

Source: Streetwise Reports   07/06/2019

A description of the current situation and near-term outlook were provided in a CIBC report.

In a July 2 research note, CIBC analyst Oscar Cabrera reported that Freeport-McMoRan Inc. (FCX:NYSE) lowered its Q2/19 gold sales estimate but maintained its 2019 guidance for gold and copper. It also provided an operations update for PT Freeport Indonesia.

Freeport maintained its 2019 copper and gold sales guidance at 3.3 billion pounds and 800,000 ounces, respectively. However, the company lowered its Q2/19 gold sales due to the Grasberg pit resequencing.

Cabrera pointed out that Freeport importantly declared its intention to meet 2019 revised mine plans for the Grasberg open pit and noted the pit could potentially produce more copper and gold in 2019 than expected. The company also indicated that material not mined from the Grasberg open pit could be mined from the Grasberg block cave.

Freeport’s primary near-term catalysts, Cabrera wrote, include the company meeting operational guidance and executing development of the Grasberg underground ramp-up and of Lone Star.

After factoring into its model on Freeport revised Q2/19 guidance and the 2019 operating update, CIBC reiterated its Outperformer rating and $15 per share price target on the company. Freeport’s current stock price, in comparison, is around $11.29 per share, a discount to peers that is unwarranted, Cabrera pointed out, “given the completion of Grasberg’s agreement, strong operating/development project execution and a strong balance sheet.”

Freeport will report Q2/19 results before the market opens on July 24, 2019, and immediately follow them with a conference call.

Sign up for our FREE newsletter at: www.streetwisereports.com/get-news

Disclosure:
1) Doresa Banning compiled this article for Streetwise Reports LLC and provides services to Streetwise Reports as an independent contractor. She or members of her household own securities of the following companies mentioned in the article: None. She or members of her household are paid by the following companies mentioned in this article: None.
2) The following companies mentioned in this article are billboard sponsors of Streetwise Reports: None. Click here for important disclosures about sponsor fees.
3) Comments and opinions expressed are those of the specific experts and not of Streetwise Reports or its officers. The information provided above is for informational purposes only and is not a recommendation to buy or sell any security.
4) The article does not constitute investment advice. Each reader is encouraged to consult with his or her individual financial professional and any action a reader takes as a result of information presented here is his or her own responsibility. By opening this page, each reader accepts and agrees to Streetwise Reports’ terms of use and full legal disclaimer. This article is not a solicitation for investment. Streetwise Reports does not render general or specific investment advice and the information on Streetwise Reports should not be considered a recommendation to buy or sell any security. Streetwise Reports does not endorse or recommend the business, products, services or securities of any company mentioned on Streetwise Reports.
5) From time to time, Streetwise Reports LLC and its directors, officers, employees or members of their families, as well as persons interviewed for articles and interviews on the site, may have a long or short position in securities mentioned. Directors, officers, employees or members of their immediate families are prohibited from making purchases and/or sales of those securities in the open market or otherwise from the time of the interview or the decision to write an article until three business days after the publication of the interview or article. The foregoing prohibition does not apply to articles that in substance only restate previously published company releases.

Disclosures from CIBC, Freeport McMoRan Inc., July 2, 2019

Analyst Certification:
Each CIBC World Markets Corp./Inc. research analyst named on the front page of this research report, or at the beginning of any subsection hereof, hereby certifies that (i) the recommendations and opinions expressed herein accurately reflect such research analyst’s personal views about the company and securities that are the subject of this report and all other companies and securities mentioned in this report that are covered by such research analyst and (ii) no part of the research analyst’s compensation was, is, or will be, directly or indirectly, related to the specific recommendations or views expressed by such research analyst in this report.

Analysts employed outside the U.S. are not registered as research analysts with FINRA. These analysts may not be associated persons of CIBC World Markets Corp. and therefore may not be subject to FINRA Rule 2241 restrictions on communications with a subject company, public appearances and trading securities held by a research analyst account.

Potential Conflicts of Interest:
Equity research analysts employed by CIBC World Markets Corp./Inc. are compensated from revenues generated by various CIBC World Markets Corp./Inc. businesses, including the CIBC World Markets Investment Banking Department. Research analysts do not receive compensation based upon revenues from specific investment banking transactions. CIBC World Markets Corp./Inc. generally prohibits any research analyst and any member of his or her household from executing trades in the securities of a company that such research analyst covers.
Additionally, CIBC World Markets Corp./Inc. generally prohibits any research analyst from serving as an officer, director or advisory board member of a company that such analyst covers.

In addition to 1% ownership positions in covered companies that are required to be specifically disclosed in this report, CIBC World Markets Corp./Inc. may have a long position of less than 1% or a short position or deal as principal in the securities discussed herein, related securities or in options, futures or other derivative instruments based thereon.

Recipients of this report are advised that any or all of the foregoing arrangements, as well as more specific disclosures set forth below, may at times give rise to potential conflicts of interest.

Important Disclosure Footnotes for Freeport-McMoRan Inc. (FCX)

· CIBC World Markets Inc. expects to receive or intends to seek compensation for investment banking services from Freeport-McMoRan Inc. in the next 3 months.

( Companies Mentioned: FCX:NYSE,
)

Company Named ‘Top Small-Cap Growth Story’

The Energy Report

Source: Streetwise Reports   07/06/2019

The reasons for the positive outlook are given in a Raymond James report.

In a July 3 research note, analyst Praveen Narra reported that Raymond James maintained its Strong Buy rating but reduced its target price on Newpark Resources Inc. (NR:NYSE) to $12 per share from $13 (current share price about $7.18) due to the “softer U.S. oilfield and rig count.”

Due to the market change, Narra noted that Raymond James now conservatively estimates a Q2/19 EBITDA of $22.5 million, a 10% reduction in 2019 EBITDA and a 9% drop in 2020 EBITDA. For Newpark, the financial services firm lowered its Q2/19 margin projection by 5% and its year-end 2019 margin by 6%.

However, the analyst highlighted that growth is expected in all of Newpark’s divisions, thereby increasing margins. The company’s fluids segment, he wrote, “still has room for margin expansion as new Gulf of Mexico work and international contracts should offer strong incremental margins.”

Margins should see a boost from the company’s move into stimulation chemical sales, from which it achieved its first revenue in Q2/19. “The fruits of the fluids expansion are beginning to pay off,” Narra indicated. “We model about $80 million in stim/chem sales for 2020.”

The shift in its composite mats segment, which serves utilities, toward larger transmission and distribution (T&D) customers, once the transition ends, should also positively impact margins due to higher volume and longer term contracts. “For 2020, we expect topline growth of 15.2% year over year as both exploration and production and T&D work continues to grow,” Narra added.

He concluded, “Newpark remains our top small-cap growth story for its unique exposure both in and out of the oilfield,” noting that with the free cash flow expected in the next two years, the company remains undervalued. At its current share price of $7.18, Raymond James’ target price offers about 60% upside and “is one of our highest upside names,” he commented.

Sign up for our FREE newsletter at: www.streetwisereports.com/get-news

Disclosure:
1) Doresa Banning compiled this article for Streetwise Reports LLC and provides services to Streetwise Reports as an independent contractor. She or members of her household own securities of the following companies mentioned in the article: None. She or members of her household are paid by the following companies mentioned in this article: None.
2) The following companies mentioned in this article are billboard sponsors of Streetwise Reports: None. Click here for important disclosures about sponsor fees.
3) Comments and opinions expressed are those of the specific experts and not of Streetwise Reports or its officers. The information provided above is for informational purposes only and is not a recommendation to buy or sell any security.
4) The article does not constitute investment advice. Each reader is encouraged to consult with his or her individual financial professional and any action a reader takes as a result of information presented here is his or her own responsibility. By opening this page, each reader accepts and agrees to Streetwise Reports’ terms of use and full legal disclaimer. This article is not a solicitation for investment. Streetwise Reports does not render general or specific investment advice and the information on Streetwise Reports should not be considered a recommendation to buy or sell any security. Streetwise Reports does not endorse or recommend the business, products, services or securities of any company mentioned on Streetwise Reports.
5) From time to time, Streetwise Reports LLC and its directors, officers, employees or members of their families, as well as persons interviewed for articles and interviews on the site, may have a long or short position in securities mentioned. Directors, officers, employees or members of their immediate families are prohibited from making purchases and/or sales of those securities in the open market or otherwise from the time of the interview or the decision to write an article until three business days after the publication of the interview or article. The foregoing prohibition does not apply to articles that in substance only restate previously published company releases.

Disclosures from Raymond James, Newpark Resources Inc., July 3, 2019

ANALYST INFORMATION

Analysts Holdings and Compensation: Equity analysts and their staffs at Raymond James are compensated based on a salary and bonus system. Several factors enter into the bonus determination, including quality and performance of research product, the analyst’s success in rating stocks versus an industry index, and support effectiveness to trading and the retail and institutional sales forces. Other factors may include but are not limited to: overall ratings from internal (other than investment banking) or external parties and the general productivity and revenue generated in covered stocks.


The analysts Praveen Narra and J. Marshall Adkins, primarily responsible for the preparation of this research report, attest to the following: (1) that the views and opinions rendered in this research report reflect his or her personal views about the subject companies or issuers and (2) that no part of the research analyst’s compensation was, is, or will be directly or indirectly related to the specific recommendations or views in this research report. In addition, said analyst(s) has not received compensation from any subject company in the last 12 months.

RAYMOND JAMES RELATIONSHIP DISCLOSURES
Certain affiliates of the RJ Group expect to receive or intend to seek compensation for investment banking services from all companies under research coverage within the next three months.

Raymond James & Associates, Inc. makes a market in the shares of Newpark Resources, Inc.

Raymond James & Associates received non-investment banking securities-related compensation from Newpark Resources, Inc. within the past 12 months.

Additional Risk and Disclosure information, as well as more information on the Raymond James rating system and suitability categories, is available here.

( Companies Mentioned: NR:NYSE,
)

COT Report: Gold, Euro & Canadian dollar bets jump. VIX, 10-Year bets more bearish

By CountingPips.comReceive our weekly COT Reports by Email

Here are this week’s links to the latest Commitment of Traders data changes that were released on Friday.

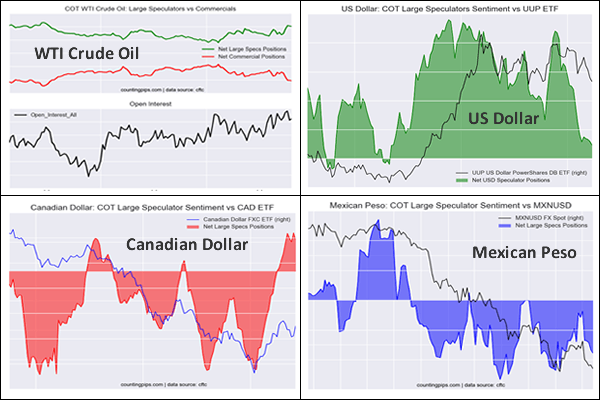
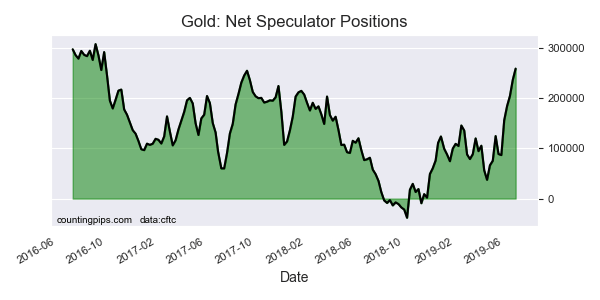
Last week in the COT data (delayed due to July 4th holiday), precious metals speculators continued to boost their Gold positions for a fifth consecutive week. Gold bullish positions have now gained by +172,258 net contracts in just the last five weeks.

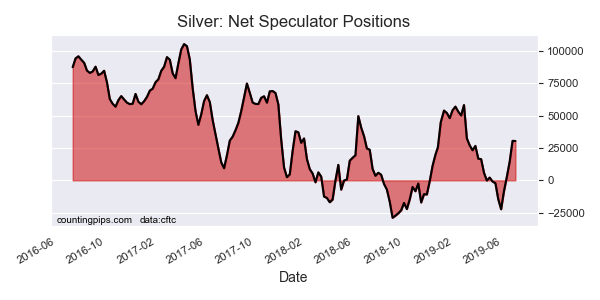
Silver bets cooled off last week after four strong weekly gains previously. Silver speculative bets dipped by just -110 net contracts and remain above the +30,000 net contract threshold for a second straight week.

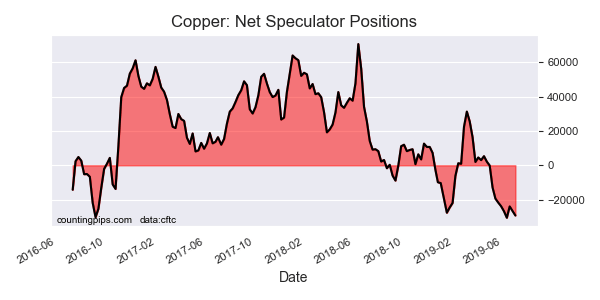
Copper speculators, meanwhile, raised their short bets again and for the tenth time out of the past eleven weeks.

In currencies, the USD Index Speculator bets were virtually unchanged this week while the Canadian dollar bets jumped for a second week over +20,000 contracts (CAD also went net bullish overall). Euro speculators sharply decreased their bearish bets by over +24,000 contracts last week.

The 10-Year Bond speculators added to their existing bearish position this week after strongly bailing out of bearish bets in two out of three previous weeks.

The WTI Crude oil speculators raised their bullish net positions for a third straight week. This latest data saw bulls adding to their positions after two straight weekly gains due to short-covering.

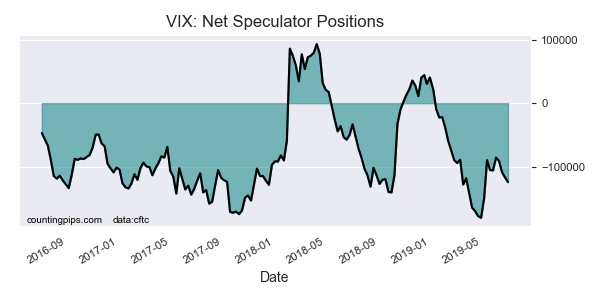
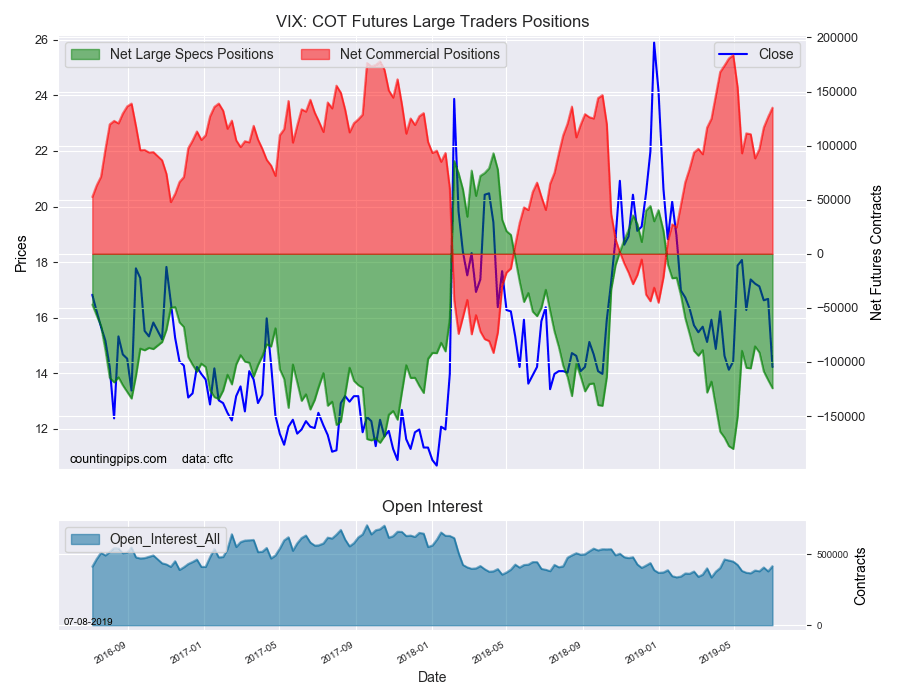
Finally, VIX speculators once again continued to raise their bearish positions for a fourth straight week. The bearish sentiment has now risen to the highest level since May 7th which was one week after reaching an all-time record high position of -180,359 contracts on April 30th.


US Dollar Index Speculator bets edge up. Euro & Canadian dollar bets jump

Large currency speculators increased their net positions in the US Dollar Index futures markets this week, according to the latest Commitment of Traders (COT) data released by the Commodity Futures Trading Commission (CFTC) on Friday. See full article.


WTI Crude Oil Speculators upped their bullish positions for 3rd week

The large speculator contracts of WTI crude futures totaled a net position of 392,810 contracts, according to the latest data this week. This was a change of 14,007 contracts from the previous weekly total. See full article.


10-Year Note Speculators pushed their bearish bets slightly higher

Large speculator contracts of the 10-Year Bond futures totaled a net position of -288,884 contracts, according to the latest data this week. This was a change of -7,785 contracts from the previous weekly total. See full article.


Gold Speculators increased their bullish bets to highest since 2016

Large precious metals speculator contracts of the Gold futures totaled a net position of 258,946 contracts, according to the latest data this week. This was a change of 22,392 contracts from the previous weekly total. See full article.


VIX Speculators raised their bearish bets for 4th straight week

Large stock market volatility speculator contracts of the VIX futures totaled a net position of -124,224 contracts, according to the latest data this week. This was a change of -7,530 contracts from the previous weekly total. See full article.


Silver Speculators slightly edged their bullish bets lower after 4 strong weeks of gains

Large precious metals speculator contracts of the silver futures totaled a net position of 30,455 contracts, according to the latest data this week. This was a change of -110 contracts from the previous weekly total. See full article.


Copper Speculators added to their bearish bets again last week

Metals speculator contracts of the copper futures totaled a net position of -29,216 contracts, according to the latest data this week. This was a change of -2,677 contracts from the previous weekly total. See full article.


Article By CountingPips.comReceive our weekly COT Reports by Email

*COT Report: The COT data, released weekly to the public each Friday, is updated through the most recent Tuesday (data is 3 days old) and shows a quick view of how large speculators or non-commercials (for-profit traders) were positioned in the futures markets.

The CFTC categorizes trader positions according to commercial hedgers (traders who use futures contracts for hedging as part of the business), non-commercials (large traders who speculate to realize trading profits) and nonreportable traders (usually small traders/speculators).

Find CFTC criteria here: (http://www.cftc.gov/MarketReports/CommitmentsofTraders/ExplanatoryNotes/index.htm).

US Dollar Index Speculator bets edge up. Euro & Canadian dollar bets jump

July 8th – By CountingPips.comReceive our weekly COT Reports by Email

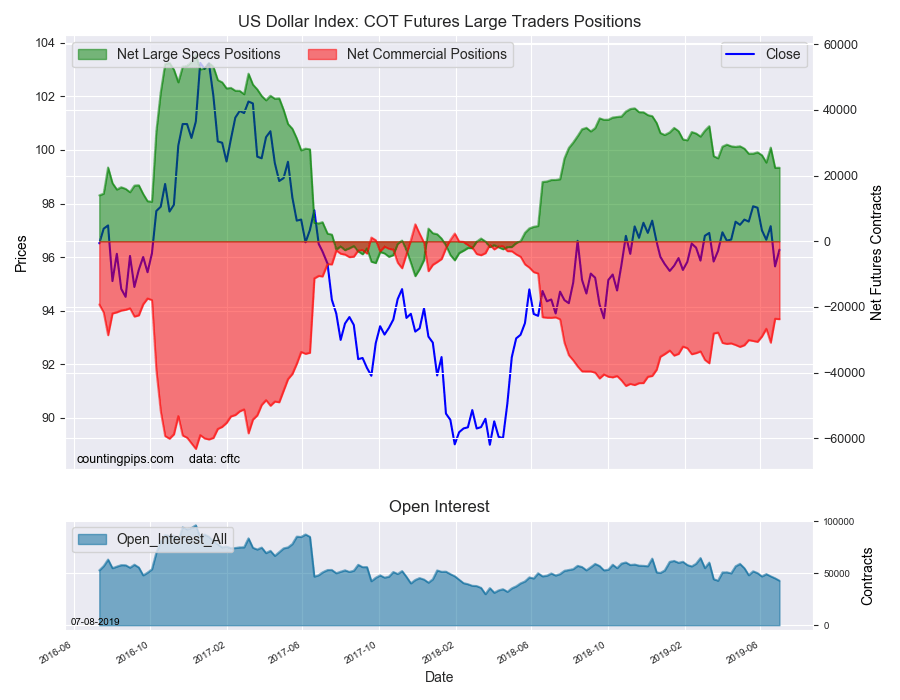
US Dollar Index Speculator Positions

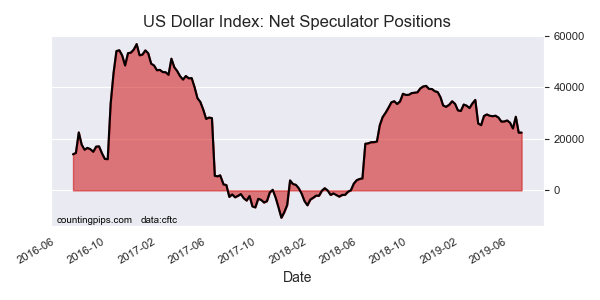
Large currency speculators slightly edged their net positions higher in the US Dollar Index futures markets last week, according to the latest Commitment of Traders (COT) data released by the Commodity Futures Trading Commission (CFTC) on Monday (delayed due to July 4th holiday).

The non-commercial futures contracts of US Dollar Index futures, traded by large speculators and hedge funds, totaled a net position of 22,417 contracts in the data reported through Tuesday July 2nd. This was a weekly bump of 51 contracts from the previous week which had a total of 22,366 net contracts.

This week’s net position was the result of the gross bullish position falling by -830 contracts (to a weekly total of 33,497 contracts) while the gross bearish position dipped by -881 contracts for the week (to a total of 11,080 contracts) .

Large speculator positions were virtually unchanged this week following a drop by over -6,000 contracts in the previous week. The current US Dollar Index standing remains bullish but is near the low end of the range of its recent bullish strength.


Individual Currencies Data this week:

In the other major currency contracts data, we saw two substantial changes (+ or – 10,000 contracts) in the speculators category this week.

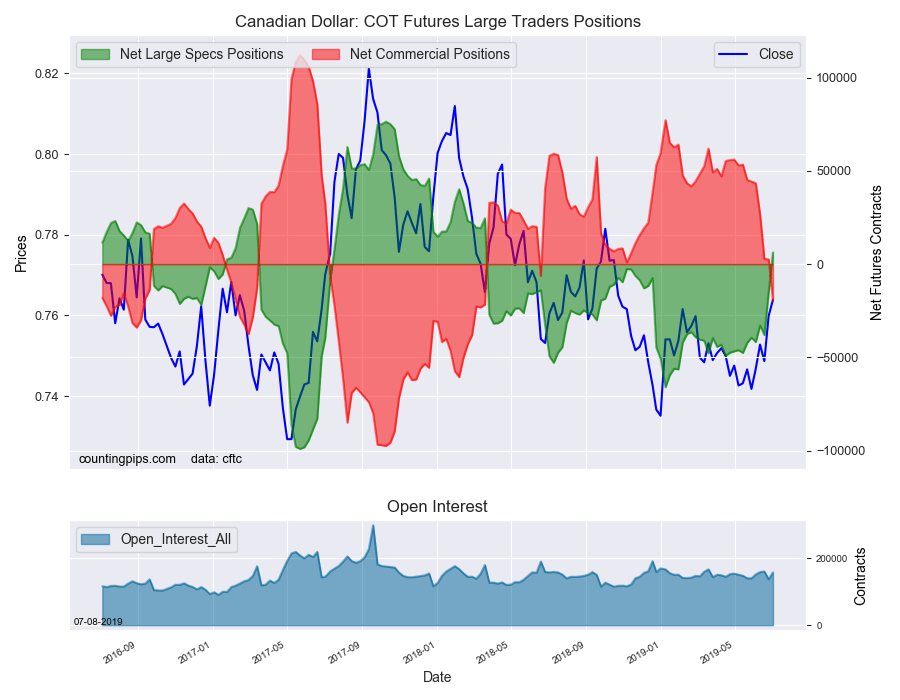
Canadian dollar positions jumped sharply for a second straight week by at least+20,000 net contracts. The CAD speculator standing has now turned into an overall net bullish position for the first time since March 20th of 2018 (a span of 67 weeks).

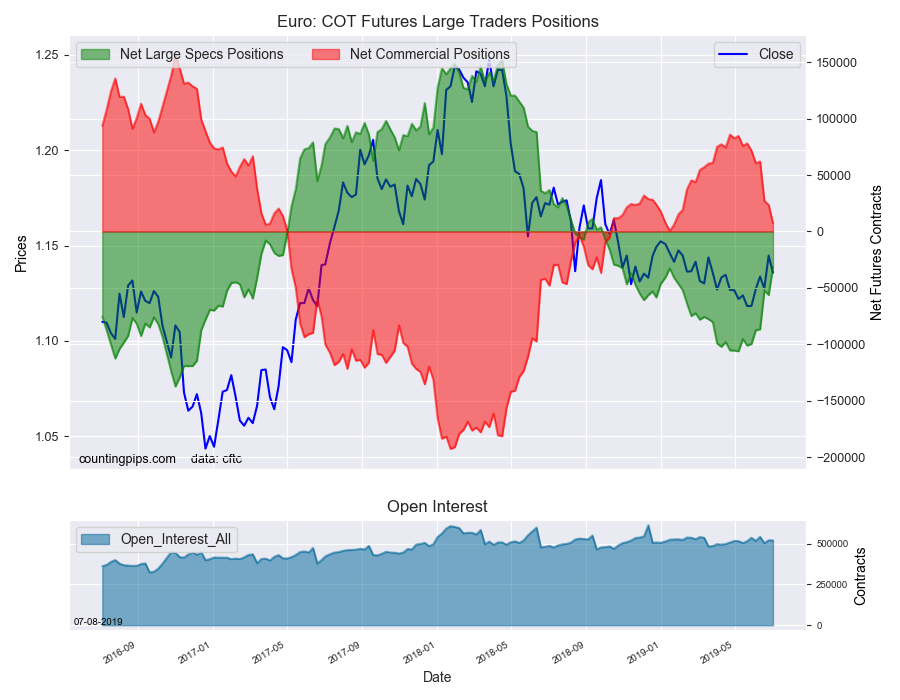
Euro speculator bets improved (went less bearish) by over +24,000 contracts last week. Euro positions have now gained by at least +10,000 contracts in three out of the past five weeks of as bearish sentiment has cooled. The Euro position is now at the least bearish level since October 2018.

Overall, the major currencies that saw improving speculator positions this week were the US dollar index (51 weekly change in contracts), euro (24,562 contracts), Japanese yen (8,920 contracts), Swiss franc (5,739 contracts), Canadian dollar (21,083 contracts), Australian dollar (7,585 contracts) and the New Zealand dollar (21 contracts).

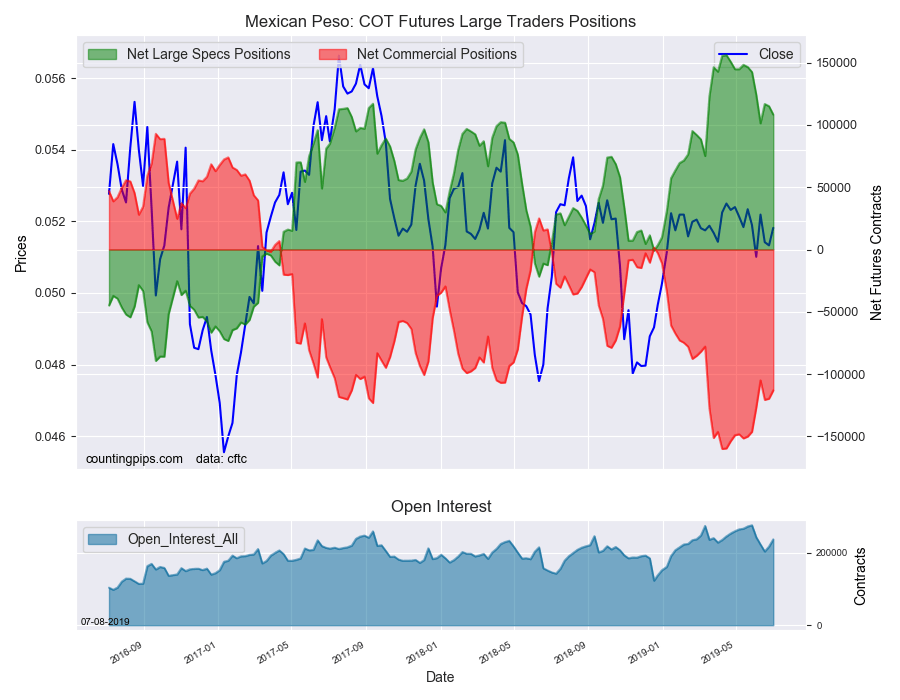
The currencies whose speculative bets declined this week were the British pound sterling (-5,307 weekly change in contracts) and the Mexican peso (-6,768 contracts).

See the table and individual currency charts below.


Table of Large Speculator Levels & Weekly Changes:

CurrencyNet Speculator PositionSpecs Weekly Change
USD Index22,41751
EuroFx-31,73324,562
GBP-64,244-5,307
JPY-1,2278,920
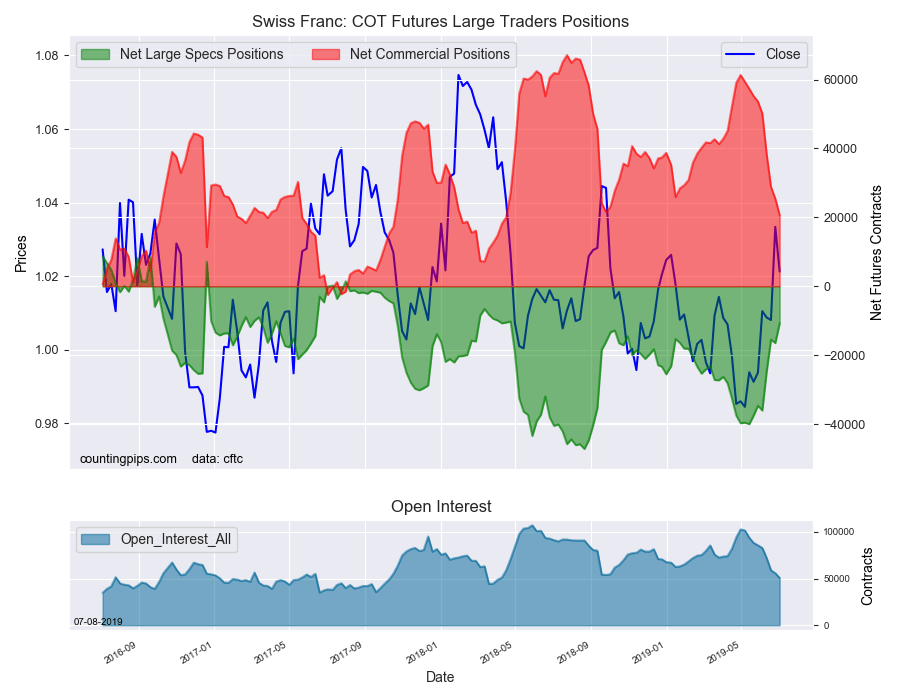
CHF-10,7425,739
CAD6,29321,083
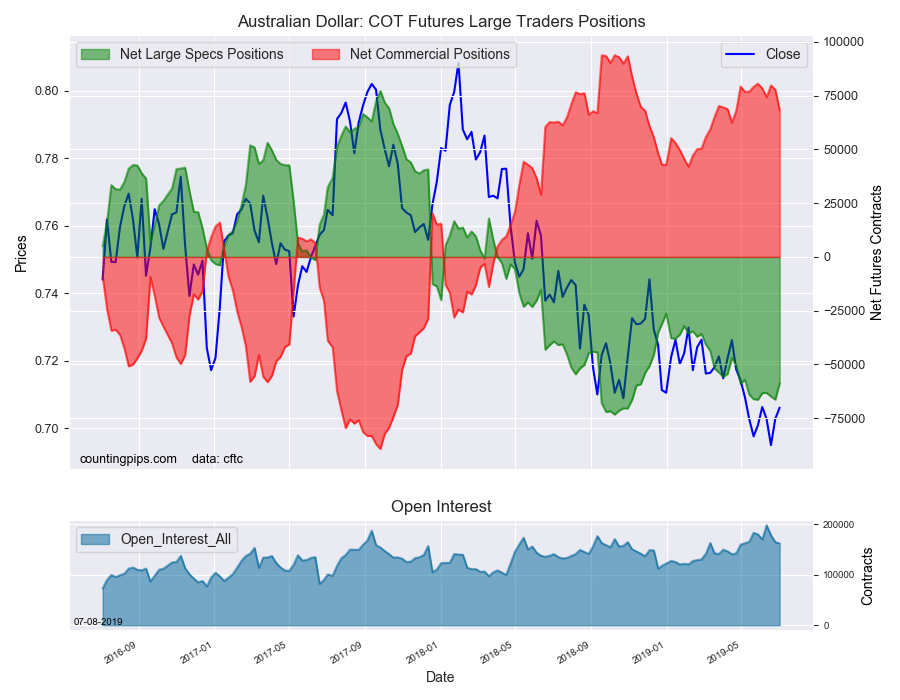
AUD-58,7357,585
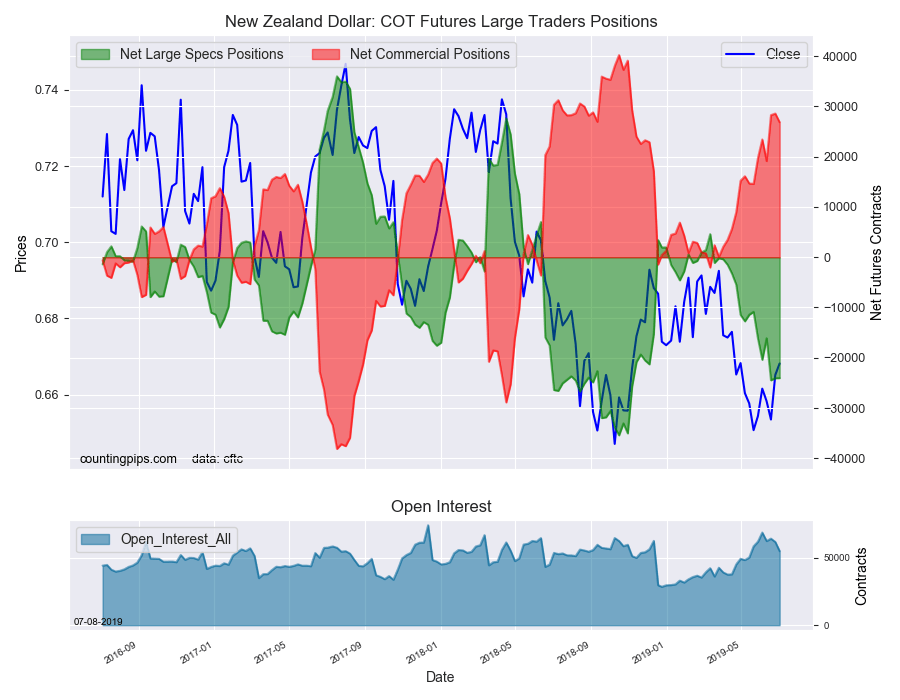
NZD-24,03221
MXN108,267-6,768


This latest COT data is through Tuesday and shows a quick view of how large speculators or non-commercials (for-profit traders) were positioned in the futures markets. All currency positions are in direct relation to the US dollar where, for example, a bet for the euro is a bet that the euro will rise versus the dollar while a bet against the euro will be a bet that the dollar will gain versus the euro.


Weekly Charts: Large Trader Weekly Positions vs Price

EuroFX:

The Euro large speculator standing this week totaled a net position of -31,733 contracts in the data reported through Tuesday. This was a weekly boost of 24,562 contracts from the previous week which had a total of -56,295 net contracts.


British Pound Sterling:

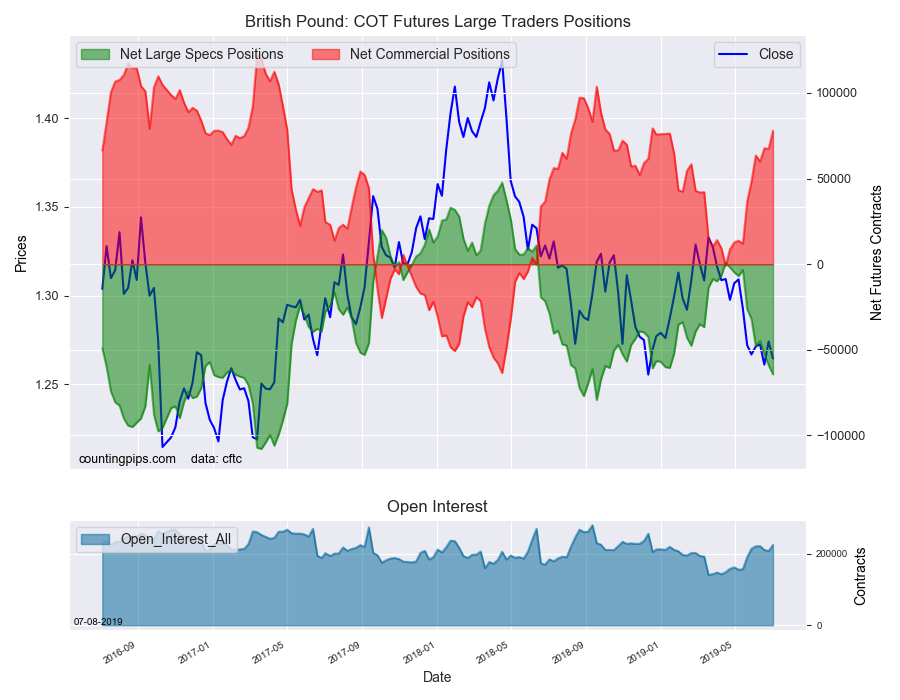
The large British pound sterling speculator level was a net position of -64,244 contracts in the data reported this week. This was a weekly decline of -5,307 contracts from the previous week which had a total of -58,937 net contracts.


Japanese Yen:

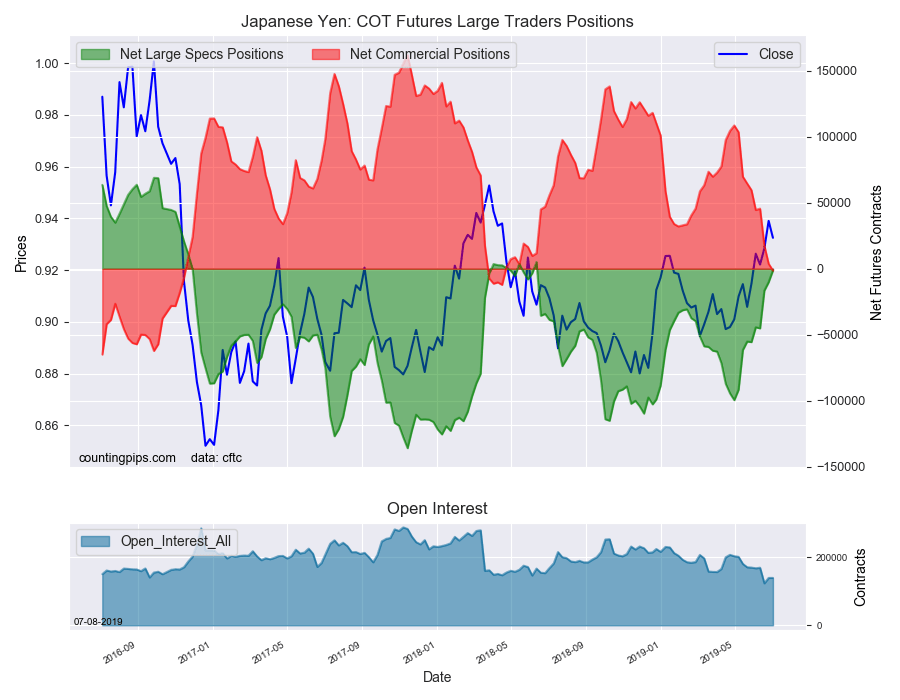
Large Japanese yen speculators totaled a net position of -1,227 contracts in this week’s data. This was a weekly rise of 8,920 contracts from the previous week which had a total of -10,147 net contracts.


Swiss Franc:

The Swiss franc speculator standing this week reached a net position of -10,742 contracts in the data through Tuesday. This was a weekly lift of 5,739 contracts from the previous week which had a total of -16,481 net contracts.


Canadian Dollar:

Canadian dollar speculators came in at a net position of 6,293 contracts this week. This was a lift of 21,083 contracts from the previous week which had a total of -14,790 net contracts.


Australian Dollar:

The large speculator positions in Australian dollar futures equaled a net position of -58,735 contracts this week in the data ending Tuesday. This was a weekly boost of 7,585 contracts from the previous week which had a total of -66,320 net contracts.


New Zealand Dollar:

The New Zealand dollar speculative standing reached a net position of -24,032 contracts this week in the latest COT data. This was a weekly advance of 21 contracts from the previous week which had a total of -24,053 net contracts.


Mexican Peso:

Mexican peso speculators totaled a net position of 108,267 contracts this week. This was a weekly lowering of -6,768 contracts from the previous week which had a total of 115,035 net contracts.


Article By CountingPips.comReceive our weekly COT Reports by Email

*COT Report: The COT data, released weekly to the public each Friday, is updated through the most recent Tuesday (data is 3 days old) and shows a quick view of how large speculators or non-commercials (for-profit traders) were positioned in the futures markets.

The CFTC categorizes trader positions according to commercial hedgers (traders who use futures contracts for hedging as part of the business), non-commercials (large traders who speculate to realize trading profits) and nonreportable traders (usually small traders/speculators).

Find CFTC criteria here: (http://www.cftc.gov/MarketReports/CommitmentsofTraders/ExplanatoryNotes/index.htm).

WTI Crude Oil Speculators upped their bullish positions for 3rd week

July 8th – By CountingPips.comReceive our weekly COT Reports by Email

WTI Crude Oil Non-Commercial Speculator Positions:

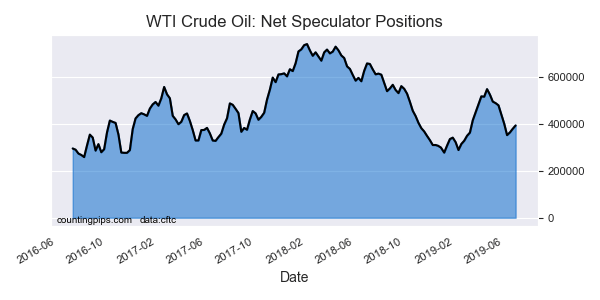
Large energy speculators raised their bullish net positions in the WTI Crude Oil futures markets last week, according to the latest Commitment of Traders (COT) data released by the Commodity Futures Trading Commission (CFTC) on Monday (delayed due to July 4th holiday).

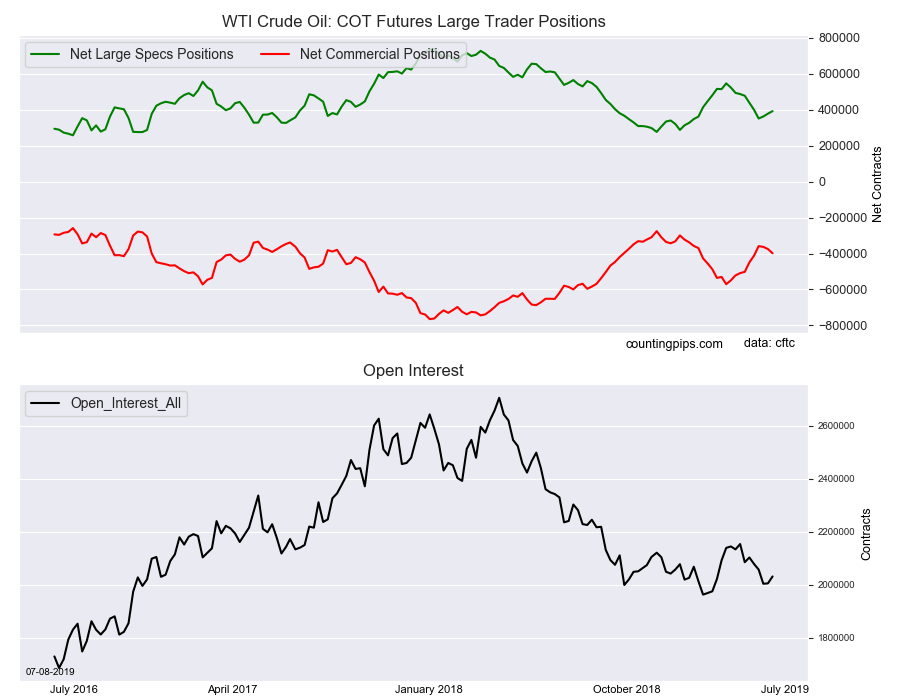
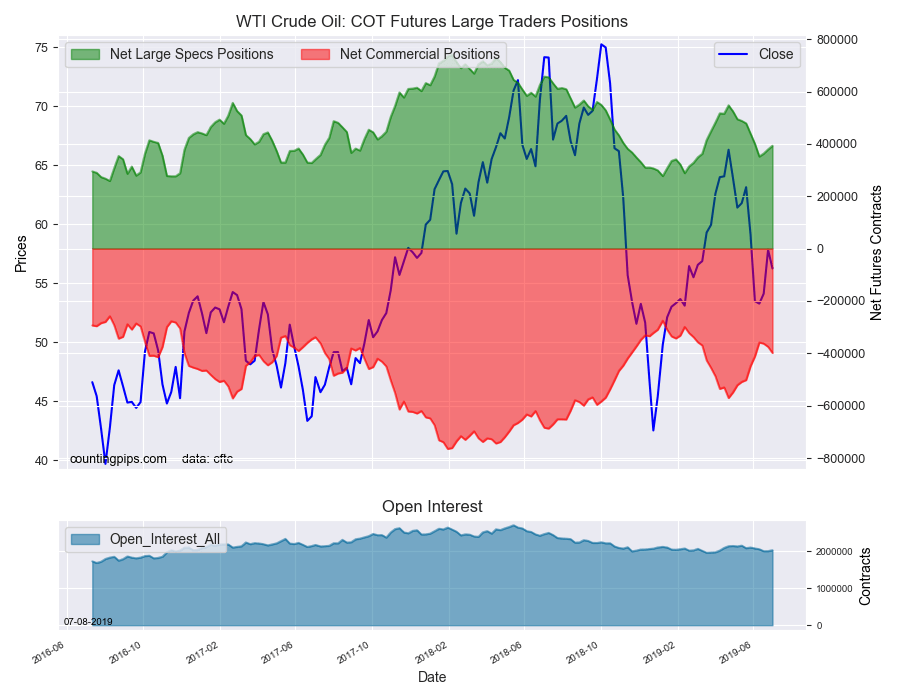
The non-commercial futures contracts of WTI Crude Oil futures, traded by large speculators and hedge funds, totaled a net position of 392,810 contracts in the data reported through Tuesday July 2nd. This was a weekly boost of 14,007 net contracts from the previous week which had a total of 378,803 net contracts.

The week’s net position was the result of the gross bullish position (longs) growing by 16,239 contracts (to a weekly total of 513,180 contracts) while the gross bearish position (shorts) rose by just 2,232 contracts on the week (to a total of 120,370 contracts).

The large speculators boosted their bullish bets for a third consecutive week last week and by a total of +41,155 contracts over that period. This follows a streak of seven weekly declines from April 30th to June 11th. Overall, the spec position remains firmly in bullish territory but has now been under the +400,000 net contract level for four straight weeks.

WTI Crude Oil Commercial Positions:

The commercial traders position, hedgers or traders engaged in buying and selling for business purposes, totaled a net position of -398,231 contracts on the week. This was a weekly loss of -23,323 contracts from the total net of -374,908 contracts reported the previous week.

WTI Crude Oil Futures:

Over the same weekly reporting time-frame, from Tuesday to Tuesday, the WTI Crude Oil Futures (Front Month) closed at approximately $56.25 which was a decrease of $-1.58 from the previous close of $57.83, according to unofficial market data.

*COT Report: The COT data, released weekly to the public each Friday, is updated through the most recent Tuesday (data is 3 days old) and shows a quick view of how large speculators or non-commercials (for-profit traders) as well as the commercial traders (hedgers & traders for business purposes) were positioned in the futures markets.

The CFTC categorizes trader positions according to commercial hedgers (traders who use futures contracts for hedging as part of the business), non-commercials (large traders who speculate to realize trading profits) and nonreportable traders (usually small traders/speculators).

Find CFTC criteria here: (http://www.cftc.gov/MarketReports/CommitmentsofTraders/ExplanatoryNotes/index.htm).

Article By CountingPips.comReceive our weekly COT Reports by Email

10-Year Note Speculators pushed their bearish bets slightly higher

July 8th – By CountingPips.comReceive our weekly COT Reports by Email

10-Year Note Non-Commercial Speculator Positions:

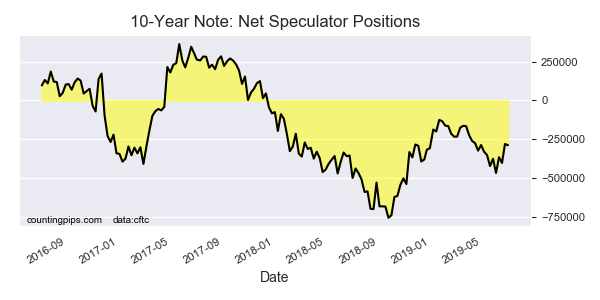
Large bond speculators increased their bearish net positions in the 10-Year Note futures markets last week, according to the latest Commitment of Traders (COT) data released by the Commodity Futures Trading Commission (CFTC) on Monday (delayed due to July 4th holiday).

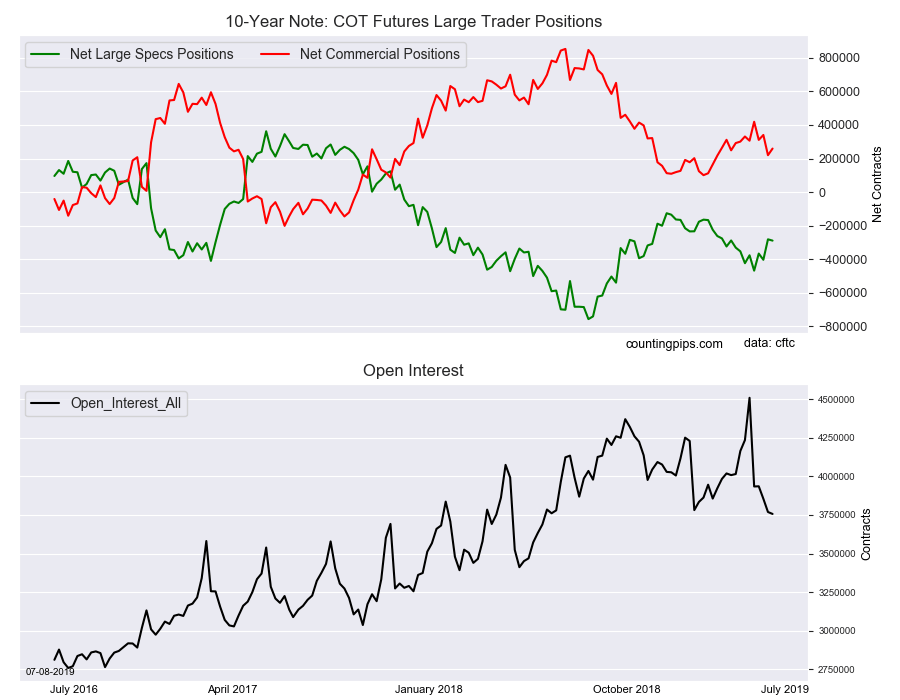
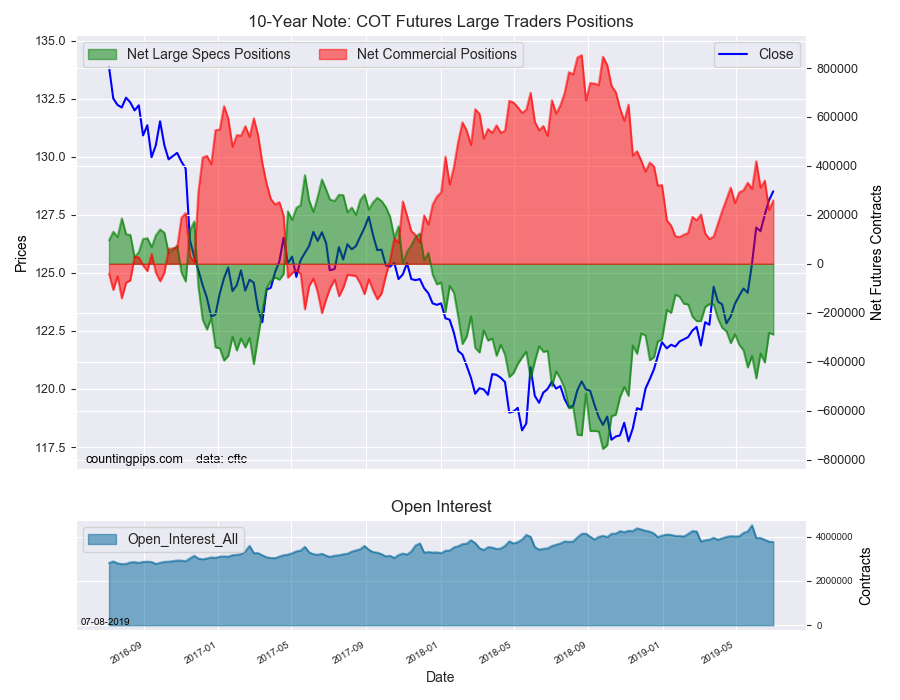
The non-commercial futures contracts of 10-Year Note futures, traded by large speculators and hedge funds, totaled a net position of -288,884 contracts in the data reported through Tuesday July 2nd. This was a weekly change of -7,785 net contracts from the previous week which had a total of -281,099 net contracts.

The week’s net position was the result of the gross bullish position (longs) decreasing by -33,998 contracts (to a weekly total of 638,138 contracts) while the gross bearish position (shorts) fell by -26,213 contracts for the week (to a total of 927,022 contracts).

The large speculators slightly added to their existing bearish positions after large pull backs in two out of the previous three weeks (+101,714 on June 11th and +121,885 on June 25th). The overall speculator sentiment remains bearish although the bearish position is now under the -300,000 net contract level for a second week.

10-Year Note Commercial Positions:

The commercial traders position, hedgers or traders engaged in buying and selling for business purposes, totaled a net position of 259,443 contracts on the week. This was a weekly rise of 39,531 contracts from the total net of 219,912 contracts reported the previous week.

10-Year Note Futures:

Over the same weekly reporting time-frame, from Tuesday to Tuesday, the 10-Year Note Futures (Front Month) closed at approximately $128.51 which was a rise of $0.39 from the previous close of $128.12, according to unofficial market data.

*COT Report: The COT data, released weekly to the public each Friday, is updated through the most recent Tuesday (data is 3 days old) and shows a quick view of how large speculators or non-commercials (for-profit traders) as well as the commercial traders (hedgers & traders for business purposes) were positioned in the futures markets.

The CFTC categorizes trader positions according to commercial hedgers (traders who use futures contracts for hedging as part of the business), non-commercials (large traders who speculate to realize trading profits) and nonreportable traders (usually small traders/speculators).

Find CFTC criteria here: (http://www.cftc.gov/MarketReports/CommitmentsofTraders/ExplanatoryNotes/index.htm).

Article By CountingPips.comReceive our weekly COT Reports by Email

Gold Speculators increased their bullish bets to highest since 2016

July 8th – By CountingPips.comReceive our weekly COT Reports by Email

Gold Non-Commercial Speculator Positions:

Large precious metals speculators continued to increase their bullish net positions in the Gold futures markets last week, according to the latest Commitment of Traders (COT) data released by the Commodity Futures Trading Commission (CFTC) on Monday (delayed due to July 4th holiday).

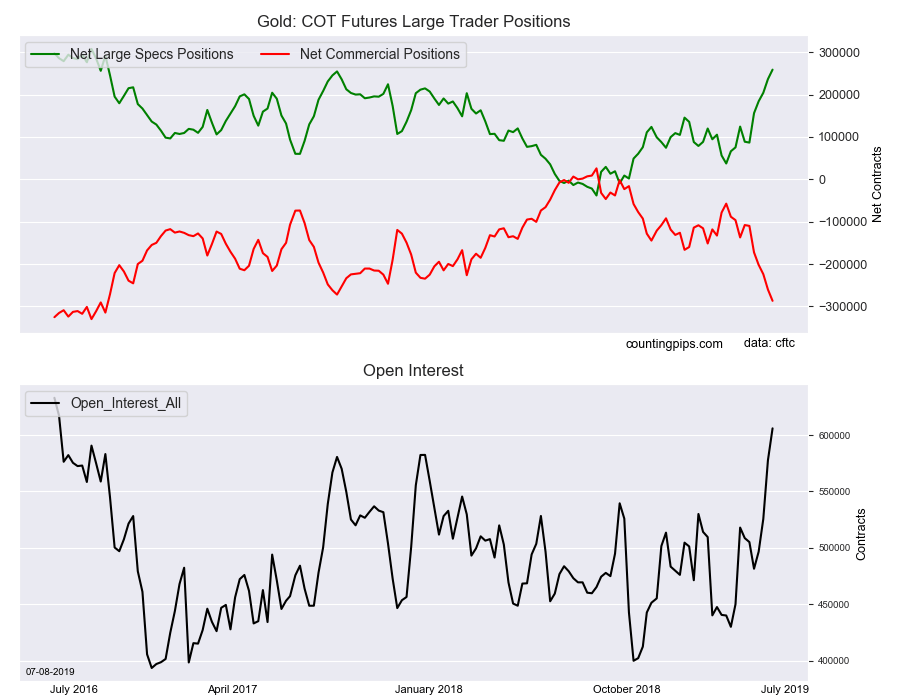
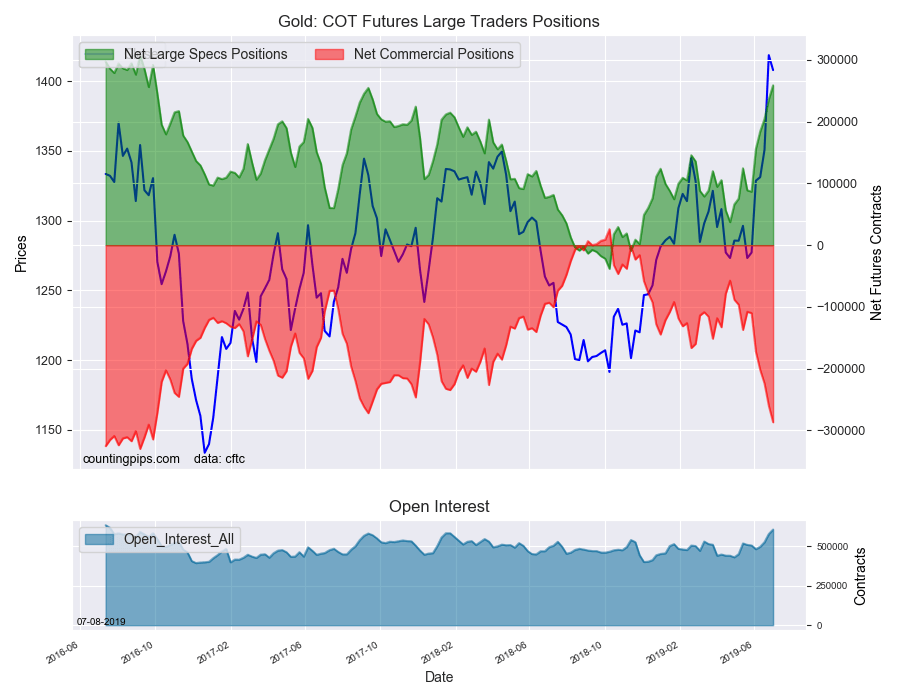
The non-commercial futures contracts of Gold futures, traded by large speculators and hedge funds, totaled a net position of 258,946 contracts in the data reported through Tuesday July 2nd. This was a weekly lift of 22,392 net contracts from the previous week which had a total of 236,554 net contracts.

The week’s net position was the result of the gross bullish position (longs) going up by 14,594 contracts (to a weekly total of 312,702 contracts) while the gross bearish position (shorts) reduction by -7,798 contracts for the week (to a total of 53,756 contracts).

The large speculators boosted their gold bullish bets higher for a fifth straight week and by a total of +172,258 contracts over that period. Bullish bets have risen by at least +20,000 contracts in each of the last five weeks.

The speculative gold standing is now at the highest level since September 13th of 2016 when the net position totaled +285,413 contracts.

Gold Commercial Positions:

The commercial traders position, hedgers or traders engaged in buying and selling for business purposes, totaled a net position of -286,822 contracts on the week. This was a weekly fall of -26,672 contracts from the total net of -260,150 contracts reported the previous week.

Gold Futures:

Over the same weekly reporting time-frame, from Tuesday to Tuesday, the Gold Futures (Front Month) closed at approximately $1408.00 which was a loss of $-10.70 from the previous close of $1418.70, according to unofficial market data.

*COT Report: The COT data, released weekly to the public each Friday, is updated through the most recent Tuesday (data is 3 days old) and shows a quick view of how large speculators or non-commercials (for-profit traders) as well as the commercial traders (hedgers & traders for business purposes) were positioned in the futures markets.

The CFTC categorizes trader positions according to commercial hedgers (traders who use futures contracts for hedging as part of the business), non-commercials (large traders who speculate to realize trading profits) and nonreportable traders (usually small traders/speculators).

Find CFTC criteria here: (http://www.cftc.gov/MarketReports/CommitmentsofTraders/ExplanatoryNotes/index.htm).

Article By CountingPips.comReceive our weekly COT Reports by Email

VIX Speculators raised their bearish bets for 4th straight week

July 8th – By CountingPips.comReceive our weekly COT Reports by Email

VIX Non-Commercial Speculator Positions:

Large volatility speculators continued to raise their bearish net positions in the VIX futures markets again last week, according to the latest Commitment of Traders (COT) data released by the Commodity Futures Trading Commission (CFTC) on Monday (delayed due to July 4th holiday).

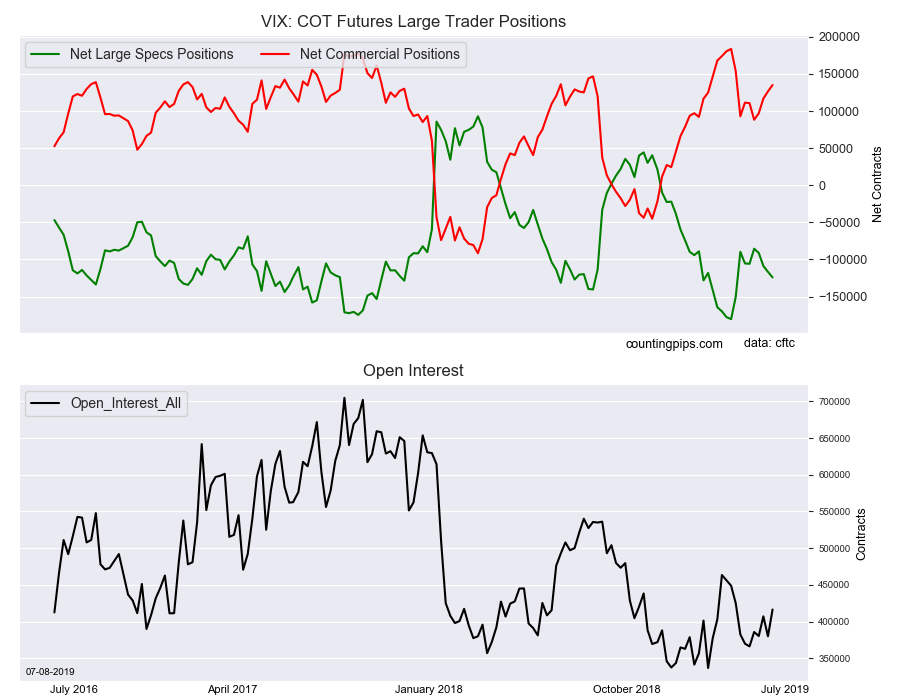
The non-commercial futures contracts of VIX futures, traded by large speculators and hedge funds, totaled a net position of -124,224 contracts in the data reported through Tuesday July 2nd. This was a weekly change of -7,530 net contracts from the previous week which had a total of -116,694 net contracts.

The week’s net position was the result of the gross bullish position (longs) ascending by 15,977 contracts (to a weekly total of 97,928 contracts) but was overcome by the gross bearish position (shorts) which gained by 23,507 contracts for the week (to a total of 222,152 contracts).

Large speculators increased their bearish bets for the VIX for a fourth straight week and for the fifth time in the past six weeks. The bearish sentiment has now risen to the highest level since May 7th which was one week after reaching an all-time record high position of -180,359 contracts on April 30th.

VIX Commercial Positions:

The commercial traders position, hedgers or traders engaged in buying and selling for business purposes, totaled a net position of 135,094 contracts on the week. This was a weekly boost of 8,585 contracts from the total net of 126,509 contracts reported the previous week.

VIX Futures:

Over the same weekly reporting time-frame, from Tuesday to Tuesday, the VIX Futures (Front Month) closed at approximately $14.22 which was a loss of $-2.45 from the previous close of $16.67, according to unofficial market data.

*COT Report: The COT data, released weekly to the public each Friday, is updated through the most recent Tuesday (data is 3 days old) and shows a quick view of how large speculators or non-commercials (for-profit traders) as well as the commercial traders (hedgers & traders for business purposes) were positioned in the futures markets.

The CFTC categorizes trader positions according to commercial hedgers (traders who use futures contracts for hedging as part of the business), non-commercials (large traders who speculate to realize trading profits) and nonreportable traders (usually small traders/speculators).

Find CFTC criteria here: (http://www.cftc.gov/MarketReports/CommitmentsofTraders/ExplanatoryNotes/index.htm).

Article By CountingPips.comReceive our weekly COT Reports by Email