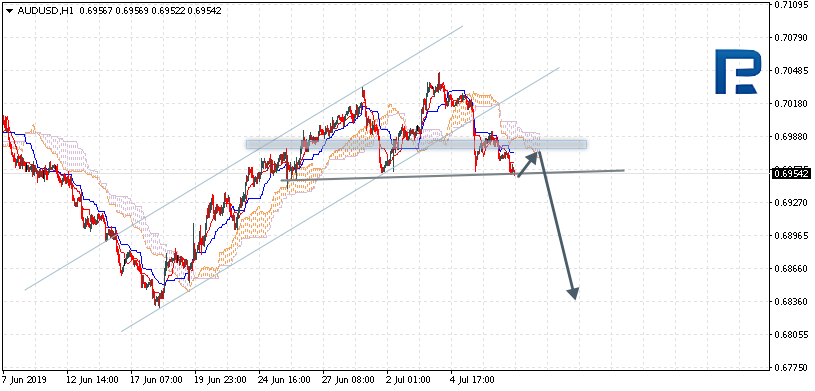
AUDUSD is trading at 0.6954; the instrument is moving below Ichimoku Cloud, thus indicating a descending tendency. The markets could indicate that the price may test the cloud’s downside border at 0.6960 and then resume moving downwards to reach 0.6835. Another signal to confirm further descending movement is the price’s rebounding from the resistance level. However, the scenario that implies further decline may be cancelled if the price breaks the cloud’s upside border and fixes above 0.7015. In this case, the pair may continue growing towards 0.7095. After breaking the support level and fixing below 0.6945, the price may continue moving downwards and complete Head & Shoulders reversal pattern.
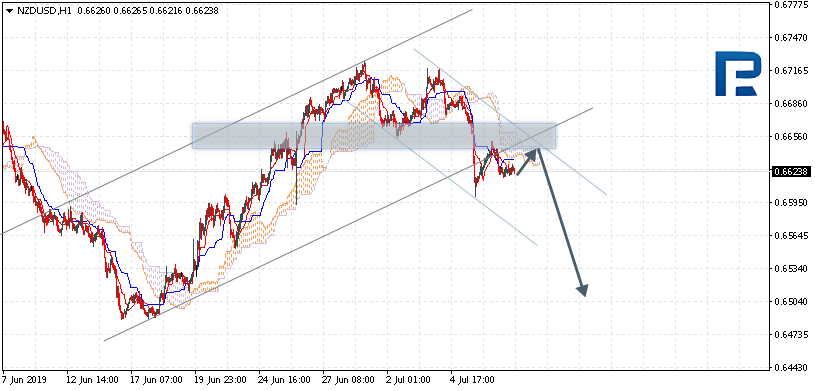
NZDUSD, “New Zealand Dollar vs US Dollar”
NZDUSD is trading at 0.6623; the instrument is moving below Ichimoku Cloud, thus indicating a descending tendency. The markets could indicate that the price may test the cloud’s upside border at 0.6640 and then resume moving downwards to reach 0.6505. Another signal to confirm further descending movement is the price’s rebounding from the descending channel’s upside border. However, the scenario that implies further decline may be cancelled if the price breaks the cloud’s upside border and fixes above 0.6665. In this case, the pair may continue growing towards 0.6785.
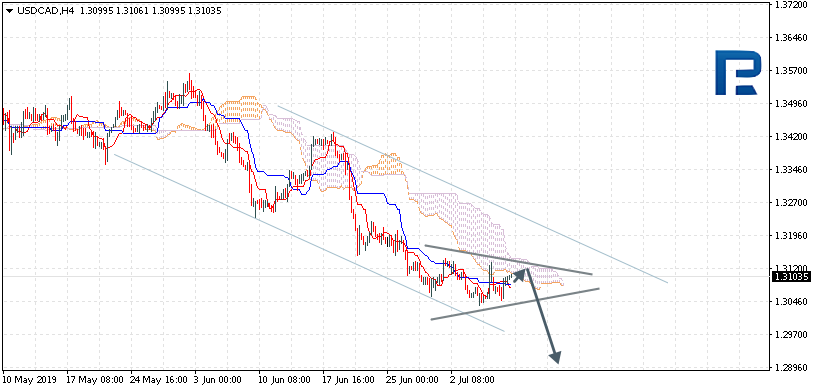
USDCAD, “US Dollar vs Canadian Dollar”
USDCAD is trading at 1.3103; the instrument is moving below Ichimoku Cloud, thus indicating a descending tendency. The markets could indicate that the price may test the cloud’s upside border at 1.3115 and then resume moving downwards to reach 1.2900. Another signal to confirm further descending movement is the price’s rebounding from the descending channel’s upside border. However, the scenario that implies further decline may be cancelled if the price breaks the cloud’s upside border and fixes above 1.3145. In this case, the pair may continue growing towards 1.3225. After breaking Triangle’s downside border and fixing below 1.3025, the price may continue moving downwards.
Attention! Forecasts presented in this section only reflect the author’s private opinion and should not be considered as guidance for trading. RoboForex LP bears no responsibility for trading results based on trading recommendations described in these analytical reviews.
USD has traded higher over the European morning on Tuesday with the index breaking back above the 97.10 level. The greenback has been well supported following the recent meeting between Trump and Xi which saw the pair agreeing to re-commit to trade talks. With little on the data sheet today, focus remains on the FOMC meeting minutes tomorrow as traders try and gauge the likelihood of a July rate cut.
EUR Heads Lower
EURUSD has been lower again today in the wake of the ongoing USD recovery. EURUSD is now trading firmly below the 1.1217 level support, which was broken overnight following several attempts over sessions. Recent eurozone data weakness is keeping the pressure on the ECB with expectations of forthcoming easing continuing to build.
Brexit Woes Weigh on GBP
GBPUSD has been sharply lower today. This is despite news that the former attorney general Dominic Grieve is planning to block Boris Johnson’s plans for a no deal Brexit. Grieve plans to do this through a special amendment to the Northern Ireland Bill which will stop Johnson from proroguing parliament.GBPUSD trades 1.2465 last.
SPX500 Retreats
Risk assets have been lower today also with the SPX500 printing its third consecutive losing day so far.Price is now trading 2959.93, sitting back under the recent 2963.89 level. Despite optimism around US-China trade negotiations as well as the prospect of the Fed easing, a stronger USD seems to be running the show for the time being. SPX500 broke out to fresh all-time highs last week on the back of the Trump/Xi meeting, though gains have lost momentum for now.
JPY Higher, Gold lower
Safe havens have had a mixed day today so far. Gold has traded lower against the US Dollar. Meanwhile, JPY has seen stronger safe-haven inflows, linked to weakness in equities prices, keeping it supported.USDJPY trades 108.90 last, having recently broken back above the 108.78 level, though USD has conceded earlier gains on the day. XAUUSD trades 1388.50 last, with price having moved back under the 1391.61 support. However, it is still above the recent 1382.06 lows for now.
Crude Testing Resistance
Oil prices have had a very subdued morning so far with price roughly unchanged on the session following moves higher overnight. Crude is still grappling with the 57.85 level for now. Later today we have the API inventories report. This will give the market the first look at US industry levels over the prior week, ahead of tomorrow’s main EIA report, which could give oil some upside if a further drawdown is reported.
Commodity Currencies Lower Again
USDCAD is trading a little lower this morning with price retreating from the latest test of the 1.3136 level. Subdued oil prices and a stronger US dollar have helped keep USDCAD above the 1.3070 level. USDCAD has been under pressure over recent weeks following the rally in oil prices. However, the recent dip lower in oil prices has stalled the decline for now. The BOC meets tomorrow which could add further support for CAD if the bank maintains a resilient tone.
AUDUSD is trading back below the .6940 this morning, disappointingly for bulls. The recovery in USD,along with the pullback in gold prices and equities, has hit AUD hard. Focus remains on a further push lower for now.
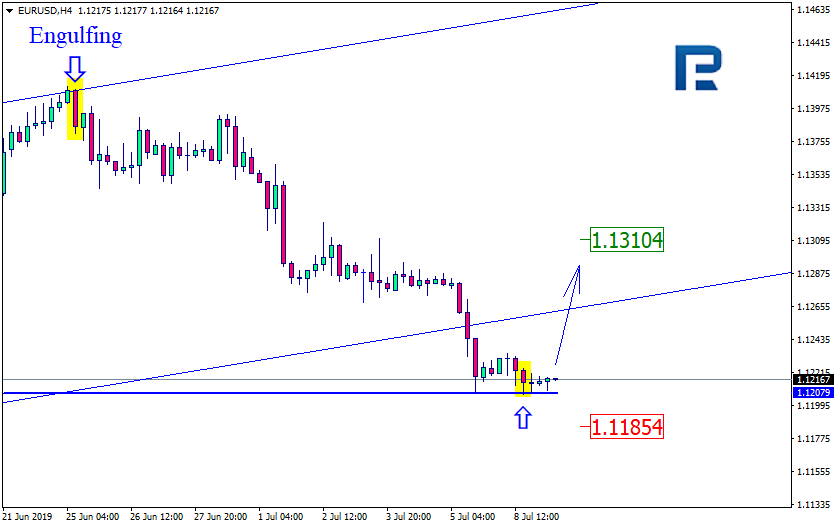
As we can see in the H4 chart, after breaking the rising channel’s downside border, EURUSD is trading sideways at the support level and has already formed several reversal patterns, including Hammer, which indicate a strong reversal signal. The possible upside target may be at 1.1310. However, one shouldn’t exclude a possibility that the price may break the support level and continue falling towards 1.1185.
USDJPY, “US Dollar vs. Japanese Yen”
As we can see in the H4 chart, the descending tendency continues. Earlier, USDJPY formed Harami pattern close to the resistance level. Right now, the pair is starting to reverse. Judging by the previous movements, it may be assumed that the price may trade downwards to reach 107.65. However, we shouldn’t ignore a possibility that the instrument may update its highs and continue its growth to reach 109.15.
Attention! Forecasts presented in this section only reflect the author’s private opinion and should not be considered as guidance for trading. RoboForex LP bears no responsibility for trading results based on trading recommendations described in these analytical reviews.
Everything in the world goes through cycles including investors level of fear, and stock prices. In this report, I want to show you how you can identify short-term and longer-term market tops and bottoms using technical analysis that focuses on the most active time cycles in the stock market today.
Before we get into the details here I would like to touch on two myths that you as a trader need to know in terms of average profit per trade and the number of trades needed to be highly profitable. It’s not what you may think.
Myth #1: You Must Always Be In A Trade and Trading You don’t need to trade every week, or need to always be in a position. This is a huge misconception and something that most traders struggle with grasping. The reality is, the fewer the trades you make less likely you are to lose money. For example, over the past 17 months, I have placed 53 trades which works out to only 3 trades a month, not many. With those 53 trades, our entire portfolio is up 74.9%. Ya, a whopping 75% with only a few simple trades a month and if you calculate what the average percent return is then you get a taste of trading reality, which brings us to the topic 2.
Myth #2: You Need 8%-25%+ Profit Per Trade to Make Big Profits Average percent return per trade is another thing most traders have completely backward. If you take 74.9% divided by 53 trades you get 1.41% average return per trade. WOW, that’s low, right? Ya, it seems low, but that’s the reality of trading. The markets wiggle up and down 1-5% regularly and you cant perfectly nail every top or bottom, and sometimes a nice trend trade is completely wiped out in 1-3 days from a flash crash type of sell-off and we have seen a few of those in the past year. What you are left with is the safe middle 1%-3% each trade, and these trades are the norm. But with that said we still have some 5-10% losing trades, and some 20-45% winners pickled in there which is always exciting.
My point on these two topics is for everyone to stop thinking you always need to be trading and think every trade should make 10-20% profit or it’s not worth your time and money.
I get emails all the time from traders who demand 5+ trades a week, expect big gains on every trade, and they usually have a story to share about how they recently lost a boatload money trading some 3X ETF with nearly their entire portfolio in one position and they need my help for some big trades to make it all back.
Yes, I can help, Yes it’s possible we get a couple of big trades that could do this, it happens, but we don’t know exactly when or which trade it will be. You must put in our time, trade cautiously and the big wins will happen over time.
Traders like this most definitely need some help because if they don’t start trading properly soon enough they will take a big loss, give back months/years of hard work, or blow up their account altogether. Trust me I have been there done that three times when starting out. Losing everything three times is a very sobering experience but sometimes it is the only way to learn if you don’t find the right mentor or trading newsletter to follow. Focus on building your account and wealth over time, not in a few fast-moving stocks/ETF trades.
SP500 DAILY CHART & CYCLE ANALYSIS
This chart is a little cluttered but if you look at the bottom of the chart where my cycle tool is located you will see how different cycles have different strengths and form short term tops and bottoms.
They key focus should be on the three larger RED shaded areas, and the one large GREEN shaded area. Those are what I call Cycle Clusters. When all three cycles are in the overbought or oversold zone we should expect weakness for 3-6 days.
The light blue cycle when trading in the overbought or oversold zone can be used for re-entry or adding to positions in favor of the overall trend (up or down).
By having this technical trading tool we are able to scale in and out of the market for increased profits while reducing our portfolio risk. This cycle tool is something subscribers to my Wealth Building Newsletter will have access to in the very near future including my complete entry, targets, and stop alerts. By following all the key markets we will have a steady stream of trades each month for increased profits.
DAILY VIX CHART AT SUPPORT & CYCLE CLUSTER
I decided to pull some VIX analysis into this research simply because the VIX recently tagged a critical support level as shown on the chart below, along with a cycle low cluster. Both of these things occurring could mean stocks are set up for a deeper than normal correction in the very near future.
The VIX at times can act as a crystal ball during times of extreme fear or complacency. Currently, complacency is the signal with traders and investors having no fear of falling prices.
The VIX is a contrarian indicator with the old saying “When the VIX is high its time to buy, with the VIX is low its time to go”.
Based on the options market for VIX puts and calls traders are expecting the VIX rise over than a couple of days and even a month from now.
30 MINUTE CHART & CYCLE PREDICTION
If we take the analysis one step further, we can zero in on the 30-minute regular trading hours only chart (9:30 am ET – 4 pm ET) with our blended cycles price bias for a better feeling of where the price is wanting to go over the next 3-6 days.
Based on the SP500 index cycles, coupled with the VIX cycles and test of support the intraday analysis looking forward 3 days looks to be in line with the other trading tools.
FUN FACTS FIFTEEN 5% WINNERS COMPOUNDED = 107% ROI $500 PROFIT PER/MONTH = 30% ROI WITH $20K ANNUALLY POSITION SIZING = TRADING SUCCESS
While there are hundreds technical indicators and thousands of ways to try and read, time, and trade the stock indexes I have developed my own way to spot stock index tops and bottoms using this special cycle tool. I should note that this works exceptionally well with gold, gold miners, silver, and oil.
IN CONCLUSION:
In short, expect stocks to trade sideways or lower this week and for the VIX to work is way higher.
We’ll keep you informed as this plays out with Wealth Building & Global Financial Reset Newsletter if you like what I offer, join me with the 1 or 2-year subscription to lock in the lowest rate possible and ride my coattails as I navigate these financial market and build wealth while others lose nearly everything they own during the next financial crisis. Join Now and Get a Free 1oz Silver Round or Gold Bar Shipped To You!
I can tell you that huge moves are about to start unfolding not only in metals, or stocks but globally and some of these super cycles are going to last years. A gentleman by the name of Brad Matheny goes into great detail with his simple to understand charts and guide about this. His financial market research is one of a kind and a real eye-opener. 2020 Cycles – The Greatest Opportunity Of Your Lifetime
As a technical analysis and trader since 1997, I have been through a few bull/bear market cycles. I believe I have a good pulse on the market and timing key turning points for both short-term swing trading and long-term investment capital. The opportunities are massive/life-changing if handled properly.
IM GIVING THEM AWAY WITH 2-YEAR MEMBERSHIPS
So kill two birds with one stone and subscribe for two years to get your FREE GOLD BAR and enough trades to profit through the next metals bull market and financial crisis!
The EUR/USD has stabilized after a sharp decline since the beginning of this month. The trading instrument is consolidating. Investors expect additional drivers. Local levels of support and resistance are 1.12100 and 1.12400. Demand for USD remains at a fairly high level after the release of optimistic statistics on the US labor market in June. Quoteshave the can decline further. Today we recommend to pay attention to the Fed and open positions must be opened from key levels.
The Economic News Feed for 09.07.2019:
– Job Openings and Labor Turnover Survey – 17:00 (GMT+3:00).
The price has fixed below 50 MA and 100 MA, which indicates the strength of the sellers.
Еhe MACD histogram is in the negative zone, but above the signal line, which gives a weak signal to sell EUR/USD.
The Stochastic Oscillator is in the neutral zone, the %K line crossed the %D line. There are no signals at the moment.
Trading recommendations
Support levels: 1.12100, 1.11600
Resistance levels: 1.12400, 1.12750, 1.13100
If the price consolidates below the local support of 1.12100, it will drop further to 1.11700-1.11500.
Alternatively, the quotes can recover to 1.12700-1.13000.
The GBP/USD currency pair
Technical indicators of the currency pair:
Prev Open: 1.25248
Open: 1.25164
% chg. over the last day: -0.07
Day’s range: 1.25023 – 1.25219
52 wk range: 1.2438 – 1.3631
The GBP/USD is in lateral movement. The technical picture is ambiguous. Currently, local support and resistance levels are 1.24900 and 1.25350. GBP still remains under pressure amid uncertainty around Brexit. Earlier, Boris Johnson, who is likely to take the post of Prime Minister of Great Britain, said that the country will probably withdraw from the EU without a deal by October 31. Open positions from key levels.
The Economic News Feed for 09.07.2019 is calm.
The price has fixed below 50 MA and 100 MA, which indicates the strength of the sellers.
The MACD histogram is in the negative zone and continues to decline, which gives a strong signal to sell GBP/USD.
The Stochastic Oscillator is in the neutral zone, the %K line crossed the %D line. There are no signals at the moment.
Trading recommendations
Support levels: 1.24900, 1.24500
Resistance levels: 1.25350, 1.25600, 1.26000
If the price consolidates below 1.24900, the price will fall toward 1.24600-1.24400.
Alternatively, the quotes can correct toward 1.25600-1.25800.
The USD/CAD currency pair
Technical indicators of the currency pair:
Prev Open: 1.30660
Open: 1.30888
% chg. over the last day: +0.20
Day’s range: 1.30887 – 1.31103
52 wk range: 1.2727 – 1.3664
The USD/CAD currency pair has once again shifted to growth. During yesterday’s and today’s trading, the growth exceeded 45 points. The local support and resistance levels are 1.30850 and 1.31150. The trading instrument can correct further. We recommend to pay attention to the dynamics of oil prices. Positions must be opened from key levels.
The Economic News Feed for 09.07.2019:
– statistics on the real estate market – 15:15 (GMT+3:00) and 15:30 (GMT+3:00).
The price has fixed above 50 MA and 100 MA, which indicates the power of buyers.
The MACD histogram is in the positive zone and continues to rise, indicating bullish sentiment.
The Stochastic Oscillator is in the neutral zone, the %K line crossed the %D line. There are no signals at the moment.
Trading recommendations
Support levels: 1.30850, 1.30550, 1.30400
Resistance levels: 1.31150, 1.31350, 1.31650
If the price consolidates above the level of 1.31150, expect growth towards to 1.31350-1.31500.
Alternatively, the quotes could fall toward 1.30600-1.30400.
The USD/JPY currency pair
Technical indicators of the currency pair:
Prev Open: 108.435
Open: 108.720
% chg. over the last day: +0.21
Day’s range: 108.677 – 108.895
52 wk range: 104.97 – 114.56
The USD/JPY currency pair continues to show a positive trend. Trading instrument again updated local maxima. At the moment, the USD/JPY quotes are consolidating. The key support and resistance levels are 108.500 and 108.900, respectively. We do not exclude the further growth of the USD/JPY currency pair. We recommend to pay attention to the dynamics of the yield of US government bonds. Positions must be opened from key levels.
The Economic News Feed for 09.07.2019 is calm.
The price has fixed above 50 MA and 100 MA, which indicates the strength of buyers.
The MACD histogram is in the positive zone, but below the signal line, which gives a weak signal to buy USD/JPY.
The Stochastic Oscillator is in the neutral zone, the %K line is below the %D line, which indicates bearish moods.
Trading recommendations
Support levels: 108.500, 108.300, 108.150
Resistance levels: 108.900, 109.400, 109.600
If the price consolidates above the level of 108.900, the quotes can grow to 109.300-109.500.
Alternatively, the quotes can descend to 108.300-108.100
On Monday the 8th of July, trading on the EURUSD pair closed slightly down. The “Monday vs Friday” scenario didn’t work out. The greenback spent the day trading up against the majors as it enjoyed continued support from Friday’s positive jobs data. Friday’s figured lowered expectations that the Fed will sharply reduce interest rates by 50 base points at the end of July. Yesterday’s movements all took place within Friday’s range, without any breakouts.
Day’s news (GMT+3):
15:15 Canada: housing starts (Jun).
15:30 Canada: building permits (May).
15:45 US: Fed’s Chair Powell speech.
17:00 US: JOLTS job openings (May).
17:10 US: Fed’s Bullard speech.
21:00 US: Fed’s Quarles speech.
23:30 US: API weekly crude oil stock (5 Jul).
Current situation:
Expectations of a correction to the balance line failed to materialise. Growth on the pair stalled at 1.1234, with the bulls missing out on their target by 6 pips. It wasn’t reaching the 1.1240 mark itself that was important, but the pair recovering to the balance line.
The pair has been consolidating for 38 hours. All eyes are now on Fed Chair Jerome Powell’s speech scheduled for today. Minutes from the FOMC’s June meeting will be released on Wednesday. Markets aren’t expecting Powell to mention interest rates, but doing so may bring about some sharp fluctuations.
I’m still expecting to see a bounce to the LB, except this time, the following drop could gather momentum and break through the 1.12 support. This week could see trade talks recommence between the US and China. Investors will be paying particular attention to any developments on this front.
The US dollar continues to hold positions against a basket of major currencies. Yesterday, the US dollar index (#DX) closed trading session with a slight increase (+0.10%). After the publication of positive data on the US labor market last week, investors expect the Fed to be less aggressive concerning further interest rate lowering. Today, the speech by the Fed Chairman J. Powell on monetary policy in the House Committee on Financial Services is in the focus of attention. According to the monetary policy report, the regulator is open to lowering the base interest rate to stimulate economic growth. According to CME FedWatch Tool, more than 95% of financial market participants believe that the Central Bank will reduce the range of key interest rate by 25 basis points to 2.00% -2.25% at a meeting in July.
UK Brexit Minister Stephen Barclay said that in order to avoid the “hard” Brexit, the withdrawal agreement should be renegotiated. The official believes that Brexit will be disruptive, first of all, not for the UK, but for the whole European Union, especially for Ireland.
The “black gold” prices are moving in different directions. At the moment, futures for the WTI crude oil are testing $57.80 per barrel. At 23:30 (GMT+3:00) API weekly crude oil stock will be published.
Market Indicators
Yesterday, there was the bearish sentiment in the US stock markets: #SPY (-0.55%), #DIA (-0.45%), #QQQ (-0.70%).
The 10-year US government bonds yield has been recovering. Currently, the indicator is at the level of 2.04-2.05%.
The US dollar index was trading higher on Monday. This comes following last Friday’s payrolls report. Investor expectations for a larger rate cut in July fell after a strong payrolls report showed a rebound in the labor market.
The Fed Chair, Jerome Powell is due to speak later today and tomorrow. Investors await further cues from him as the economic calendar remains largely quiet for the most part today.
Euro Muted to German Industrial Production
Germany’s industrial production data released on Monday saw a 0.3% increase on the month. However, construction output offset the gains in the manufacturing sector. On a year over year basis, Germany’s industrial output is down 3.2%. Meanwhile, the eurozone’s Sentix investor confidence report showed a decline to -5.8 from -3.3 earlier.
EURUSD Likely to Extend Declines
The currency pair is likely to continue its downside. The minor support level at 1.1188 will be tested in the near term. If the support level holds, then we could expect to see a modest rebound in the currency pair. However, the EURUSD will still maintain a sideways range above 1.1188. To the downside, a break down below 1.1188 support will see the EURUSD extending losses to 1.1140.
Sterling Hovers Near 6-Month Low
The pound sterling was seen staying flat, hovering near a 6-month low on Tuesday. The pair was flat amid lack of any economic data to go by. The UK is set to elect a new Prime Minister and Boris Johnson remains the frontrunner. The currency pair could remain near the current lows, awaiting further catalysts.
Will GBPUSD Bounce Back?
The currency pair remains steady near the 6-month low. The declines have invalidated the evolving inverse head and shoulders pattern. However, we could expect to see a modest bounce off this level in the near term. At the time of writing GBPUSD is trading near 1.2125. Following a break down below this level, the next lower support is seen at 1.2481.
Gold Declines for 4 Consecutive Sessions
The precious metal was seen maintaining its bearish momentum on Monday, although price action was relatively subdued. Gold prices fell 0.24% on the day. Economic data on the day was sparse with most of the technical trading coming out from Friday’s payrolls report.
Will Gold Extend Further Losses?
Price action in the precious metal currently indicates that there could be further downside. Following the breach of the rising trend line, gold briefly retested the breakout level before easing back lower. The immediate support at 1383.60 remains the key level of interest. If this support gives way, gold prices could extend further declines.
Asian stocks are eking out slight gains after the S&P 500 continued easing off its record high, as investors await fresh reasons to significantly move markets in either direction. The Dollar index is holding steady around the 97.37 mark, with Asian currencies mostly lower against the Greenback. With scarce developments out of the US-China trade talks, Fed chair Jerome Powell’s speeches are set to be the pick of the week in terms of potential market catalysts.
The better-than-expected June non-farm payrolls data shows that the US jobs market remains resilient, which could prompt the central bank to use a smaller knife when slashing interest rates. Markets appear to have out-doved Powell, leaving the Fed chair with the task of managing market expectations ahead of the FOMC at the end of July. This week’s Fedspeak could have an outsized impact on market sentiment over the coming days, as investors try to satiate their hunger for any further clues on the US monetary policy outlook.
Given the latest NFP print, doubts are creeping into the minds of investors as to how the Fed will move, if at all, later this month. As things stand, Fed Funds Futures still point to a 25-basis point cut to US interest rates in July, as investors dial back expectations for a more drastic 50-basis point reduction to benchmark interest rates.
Gold prices on a wild ride to nowhere
Gold traders are undecided about keeping prices sustainably above $1400, even as Bullion endures its steepest moves since 2016. Safe haven assets are expected to hold less appeal should the Federal Reserve step back from its easing stance.
With scant signs of an immediate deterioration on the US-China trade front, investors are seizing the opportunity to ease off on the risk-aversion pedal. At the time of writing, Gold is trading below $1394, US 10-year Treasury yields are below 2.04 percent, and the Japanese Yen is closing in on the 108.9 level. Yet, markets cannot discount the possibility of an unexpected surge in trade tensions, which means that markets have to remain fleet-footed or risk falling behind in the ensuing selloff from risk assets.
Pound to remain politically-sensitive as hunt for new UK PM enters final weeks
The Pound could see further bouts of politics-induced volatility in the near-term, as the hunt for a new UK Prime Minister enters its final weeks. At the time of writing, GBPUSD remains rooted near its lowest levels since December, barring the flash crash in January, as the currency pair hovers just above the 1.25 level.
Sterling’s politically-sensitive nature won’t end once the next UK PM is installed, as markets will still have to contend with Brexit uncertainties until the October 31 deadline. While a significant measure of Brexit risks have already been priced, the Pound may still have more of its downside exposed, should the prospects of a no-deal Brexit ramp up meaningfully over the coming months.
Disclaimer: The content in this article comprises personal opinions and should not be construed as containing personal and/or other investment advice and/or an offer of and/or solicitation for any transactions in financial instruments and/or a guarantee and/or prediction of future performance. ForexTime (FXTM), its affiliates, agents, directors, officers or employees do not guarantee the accuracy, validity, timeliness or completeness, of any information or data made available and assume no liability as to any loss arising from any investment based on the same.
Brexit is once again back in the spotlight. Former attorney general Dominic Grieve has outlined his plan to prevent Boris Johnson from forcing a “no deal” Brexit by shutting down parliament.
Grieve has tabled an amendment to the Northern Ireland Bill which would require MPs to sit in parliament on September 4th, October 9th and then every two weeks until December 18th.
Second Attempt
Grieve made a previous attempt last week at foiling plans to force a no deal Brexit. However, it was undone when the speaker of the House of Commons John Bercow didn’t select an amendment put forward by Labour’s ex-Foreign Secretary Dame Margaret Beckett. This would have blocked capital supply to government departments in the event of a no deal Brexit.
Although Johnson has made it clear that he isn’t “attracted” to the idea of proroguing parliament to make certain that the UK leaves on time, he has yet to rule it out
Grieve Stands Up For Democracy
However, if passed, Grieve’s amendment would effectively block Johnson from making such a move.
This is because it would ensure that parliament continues to meet in the run-up to the Brexit deadline.Speaking with UK Radio 4, Grieve said:
“If you decide that Parliament is an inconvenience, when in fact it is the place where democratic legitimacy lies in our constitution and therefore it’s acceptable to get rid of it for a period because it might otherwise prevent you from doing something which Parliament would prevent, then it’s the end of democracy.”
Grieve Putting Focus on Northern Ireland
The devolved Northern Ireland government at Stormont is currently suspended, and the amendment “would require fortnightly reports to be after the conference recess until an Executive was formed, or until the December recess”.
The amendment is based on a specific section of the2004 Civil Contingencies Act. This commands the Commons and Lords to sit at times of national emergency. The Times newspaper in the UK has reported that a group of roughly 30 MPs is currently planning to block Johnson’s plans for a no-deal Brexit.
BOE Warns of Growing No Deal Brexit Risks
At its last meeting, the Bank of England noted that the risks of a no deal Brexit have increased substantially. It indicated that, in such a case, the bank would likely need to cut rates in a bid to backstop the economy.
GBP has been sharply lower since the last BOE meeting. And as the October 31st deadline looms and uncertainty builds, further downside is likely.
Technical Perspective
After failing at 1.2750, GBPUSD has turned sharply lower, breaking down through the 1.2531 support. It is currently challenging the 1.2481 support. Below here, the 1.2438 2018 low is the next key level. A break of this would be a powerfully bearish technical development for GBPUSD. It’s worth noting that we are seeing strong bullish divergence on the RSI indicator, warning of the potential for a squeeze higher. However, bulls will need to quickly see a break back above the 1.2750 level to negate the near term bearish bias.