The Analytical Overview of the Main Currency Pairs on 2019.07.10

by JustForex

The EUR/USD currency pair

Technical indicators of the currency pair:
  • Prev Open: 1.12141
  • Open: 1.12069
  • % chg. over the last day: -0.09
  • Day’s range: 1.12019 – 1.12106
  • 52 wk range: 1.1111 – 1.2009

EUR/USD continues to consolidate. There is no defined trend. Local levels of support and resistance are: 1.11950 and 1.12300. At the moment, participants in financial markets have taken a wait-and-see attitude before publishing the FOMC Minutes, which may indicate further rates for adjusting the monetary policy of the regulator. We also recommend to pay attention to the speech of the Fed. Positions must be opened from key levels.

At 21:00 (GMT+3:00) the US will publish the FOMC protocols.

EUR/USD

Indicators do not give accurate signals: the price is testing 50 MA, which at the moment is a strong dynamic resistance.

The MACD histogram is in the negative zone, but above the signal line, which gives a weak signal to sell EUR / USD.

The Stochastic Oscillator is in the neutral zone, the% K line crossed the% D line. There are no signals at the moment.

Trading recommendations
  • Support levels: 1.11950, 1.11600
  • Resistance levels: 1.12300, 1.12750, 1.13100

If the price consolidates below the local support of 1.11950 the quotes may fall toward 1.11600-1.11400.

Alternatively, the quotes may recover toward 1.12600-1.12800.

The GBP/USD currency pair

Technical indicators of the currency pair:
  • Prev Open: 1.25164
  • Open: 1.24577
  • % chg. over the last day: -0.44
  • Day’s range: 1.24479 – 1.24642
  • 52 wk range: 1.2438 – 1.3631

On the GBP / USD currency pair, bearish sentiment still prevails. The trading instrument again updated local minima. At the moment, the key support and resistance levels are: 1.24400 and 1.24900, respectively. The pound remains under pressure due to the uncertainty around Brexit. The main contenders for the post of leader of the Conservative Party have announced that they are ready for the UK to leave the block on a “tough” Brexit basis. Today, investors will be evaluating important economic releases from the UK. We recommend to open positions from key levels.

The Economic News Feed for 10.07.2019:

  • – GDP report – 11:30 (GMT+3:00);
  • – The volume of production in the UK manufacturing industry – 11:30 (GMT+3:00).
GBP/USD

The price has fixed below 50 MA and 100 MA, which indicates the strength of the sellers.

The MACD histogram is in the negative zone, but above the signal line, which gives a weak signal to sell GBP / USD.

The Stochastic Oscillator is in the neutral zone, the %K line crossed the %D line. There are no signals at the moment.

Trading recommendations
  • Support levels: 1.24400, 1.24000
  • Resistance levels: 1.24900, 1.25350, 1.25600

If the price consolidates below 1.24400, the quotes can fall toward 1.24000.

Alternatively, the quotes can correct to 1.25200-1.25400.

The USD/CAD currency pair

Technical indicators of the currency pair:
  • Prev Open: 1.30888
  • Open: 1.31232
  • % chg. over the last day: +0.26
  • Day’s range: 1.31232 – 1.31362
  • 52 wk range: 1.2727 – 1.3664

The USD/CAD continues to recover after a prolonged fall. CAD has reached key extremums and .is consolidating in the range of 1.31150-1.31400. The quotes can correct further. Today the focus is on the meeting o the Bank of Canada. It is expected that the regulator will keep the basic parameters of monetary policy at the same level. We recommend to pay attention to the comments and rhetoric of the representatives of the Central Bank. Positions must be opened from key levels.

At 17:00 (GMT+3: 00), the Bank of Canada will announce its decision on a key interest rate.

USD/CAD

The price has fixed above 50 MA and 100 MA, which indicates the power of buyers.

The MACD histogram is in the positive zone and continues to rise, indicating bullish sentiments.

The Stochastic Oscillator is in the neutral zone, the %K line is above the %D line, which also indicates bullish moods.

Trading recommendations
  • Support levels: 1.31150, 1.30850, 1.30550
  • Resistance levels: 1.31400, 1.32000

If the price consolidates above the level of 1.31400, the quotes can rise to 1.32000.

Alternatively, the quotes can fall toward 1.30900-1.30700.

The USD/JPY currency pair

Technical indicators of the currency pair:
  • Prev Open: 108.720
  • Open: 108.856
  • % chg. over the last day: +0.20
  • Day’s range: 108.829 – 108.991
  • 52 wk range: 104.97 – 114.56

On the USD/JPY currency pair the buyers still prevail. At the moment, the trading instrument is consolidating near the round level of 109.000. Local support is at the 108.700 mark. In the near future, technical correction of the USD/JPY quotes is expected. Investors are awaiting the publication of FOMC protocols. We also recommend paying attention to the dynamics of US government bond yields. Positions must be opened from key levels.

The Economic News Feed for 10.07.2019 is calm.

USD/JPY

The price has fixed above 50 MA and 100 MA, which indicates the strength of buyers.

The MACD histogram is in the positive zone, but below the signal line, which gives a weak signal to buy USD/JPY.

The Stochastic Oscillator is in the oversold zone, the% K line crossed the% D line. There are no signals at the moment.

Trading recommendations
  • Support levels: 108.700, 108.500, 108.300
  • Resistance levels: 109.000, 109.400, 109.600

If the price consolidates above the round level of 109.000, the quotes can grow to 109.300-109.500.

Alternatively, the quotes can decline to 108.500-108.300.

by JustForex

Markets turn cautious and vigilant as Powell seizes centre stage

By Lukman Otunuga, Research Analyst, ForexTime

An air of caution is lingering across financial markets as investors huddle on the sidelines ahead of Fed Chair Jerome Powell’s highly anticipated testimony on Capitol Hill later in the day.

Equities across the globe are likely to hold their breath as markets ponder whether Powell would confirm or downplay expectations for a potential US rate cut this month. Given how financial markets remain extremely sensitive to rate cut speculation, there is a lot at stake today with Powell handed the mammoth task of pleasing investors without overpromising. Although last Friday’s strong US jobs report has certainly thrown a monkey wrench into rate cut hopes, the Fed is likely to move ahead with an insurance 25 bps rate cut this month. To prevent markets getting ahead of themselves beyond July, Powell may articulate that future US policy easing will be dependent on US economic fundamentals and ongoing trade developments.

The Dollar was practically drowning in rate cut speculation a few days back before the latest jobs report offered a lifeline. This week, King Dollar is trampling against every single G10 currency excluding the Swiss Franc while treating most emerging market currencies without mercy. Should Powell sound less dovish than expected during his testimony, the Dollar Index could push higher with 97.80 acting as a level of interest.

Sterling becomes the sick man in G10 space as Brexit stings sentiment

This has been a sad week for the British Pound which has weakened against every single G10 currency excluding the Australian Dollar thanks to persistent fears of a no-deal Brexit.

According to the British Retail Consortium (BRC), UK retail sales experienced their “worst June on record” as total sales fell 2.3% year-on-year in June compared with the increase of 2.3% in June 2018. With Brexit uncertainty negatively impacting consumption which is an engine for growth in the United Kingdom, this is certainly bad news for the British Pound.

On a brighter note, official reports this morning have confirmed that the UK economy rebounded in May as GDP rose 0.3% after a decline in the previous month. Manufacturing production which nosedived 4.2% in April rose 1.4% in May slightly easing concerns over the UK economy.

While the Pound may ride higher on the positive report, it does not change the fact that other risks in the form of heighten political risk in Westminster and Brexit uncertainty have left the Pound vulnerable against its G10 counterparts.

Focusing on the technical picture, the GBPUSD is bearish with prices trading around 1.2470 as of writing. Sustained weakness below 1.2500 should encourage a decline back towards 1.2420.

Commodity spotlight – Gold

A broadly stronger Dollar has repeatedly sabotaged Gold’s effort to reclaim the psychological $1400 level this week.

The precious metal has made an effort to push back above the $1400 level but this was cut short by investors re-evaluating whether the Federal Reserve will cut interest rates this month. While Gold may face some obstacles in the near term, bulls are unlikely to lose any sleep in the medium to longer term given how global growth concerns, ongoing trade developments and geopolitical tensions remain core market themes. Where Gold concludes the trading week, will be influenced by Powell’s testimony and the FOMC meeting minutes later this evening.

For bulls to jump back into the game, Gold needs to secure a daily close back above $1400.

Disclaimer: The content in this article comprises personal opinions and should not be construed as containing personal and/or other investment advice and/or an offer of and/or solicitation for any transactions in financial instruments and/or a guarantee and/or prediction of future performance. ForexTime (FXTM), its affiliates, agents, directors, officers or employees do not guarantee the accuracy, validity, timeliness or completeness, of any information or data made available and assume no liability as to any loss arising from any investment based on the same.


Forex-Time-LogoArticle by ForexTime

ForexTime Ltd (FXTM) is an award winning international online forex broker regulated by CySEC 185/12 www.forextime.com

The US and China Had a “Constructive” Dialogue. FOMC Minutes and Bank of Canada Meeting Are in the Focus of Attention

by JustForex

The US dollar continues to keep positions against a basket of major currencies. Yesterday, the US dollar index (#DX) closed trading session in the positive zone (+0.11%). Investors expect the publication of the FOMC meeting minutes, as well as the speech by Fed Chairman Jerome Powell with a semi-annual monetary report in the House Committee on Financial Services. The official is expected to give insight into how the next Fed meeting will be held and what to expect from it.

White House Economic Advisor, Larry Kudlow, said that US Trade Representative, Robert Lighthizer, and Treasury Secretary, Steven Mnuchin, had “constructive” phone talks with Chinese Vice Premier, Liu He, and Commerce Minister, Zhong Shan, yesterday. Both parties continue to make efforts to resolve the trade conflict. Kudlow said the talks “went well.” It is also reported that the parties plan a personal meeting, but Kudlow believes that there is no easy way to reach a trade deal.

The Bank of Canada meeting will also take place today. It is expected that the regulator will keep the key marks of monetary policy at the same level. We recommend paying attention to the comments by the Central Bank representatives.

The “black gold” prices have been growing. At the moment, futures for the WTI crude oil are testing the mark of $59.00 per barrel. At 17:30 (GMT+3:00) crude oil inventories will be published in the US.

Market Indicators

Yesterday, there was a variety of trends in the US stock markets: #SPY (+0.12%), #DIA (-0.07%), #QQQ (+0.50%).

The 10-year US government bonds yield is growing. Currently, the indicator is at the level of 2.09-2.10%.

The News Feed on 2019.07.10:

– Data on UK GDP at 11:30 (GMT+3:00);
– Manufacturing production in the UK at 11:30 (GMT+3:00);
– The Bank of Canada interest rate decision at 17:00 (GMT+3:00);
– FOMC meeting minutes at 21:00 (GMT+3:00).

by JustForex

Euro pressured by rampant Dollar as Fed rate cut bets fade

By Lukman Otunuga, Research Analyst, ForexTime

The Euro was trampled by the Dollar today as investors re-evaluated whether the Federal Reserve will cut interest rates in July.

Prices dipped below $1.12 to a three-week low on rising expectations for more aggressive ECB easing following the nomination of IMF Chairwoman Christine Lagarde as the new European Central Bank head. With the EURUSD struggling to keep above $1.12, sellers are likely to exploit this weakness to send the currency pair towards $1.11 in the near term. This bearish setup remains valid for as long as $1.13 proves to be a reliable resistance.

Sterling crumbles to a two-year low as Brexit fears sting sentiment 

Sterling has tumbled to its lowest level in six months against both the Dollar and Euro thanks to mounting fears of a no-deal Brexit and repeated signals of slowing economic growth.

Retail sales in the United Kingdom have risen at the slowest pace over the past year as Brexit uncertainty limits consumption. Other risks in the form of political risk and external developments have made the Pound the sick man in the G10 space. The technical picture illustrates a bearish setup with prices trading towards 1.2420. Should this level prove to be strong support, the GBPUSD may end up rebounding back towards 1.2500.

Australian Dollar wins title as weakest G10 currency 

The Australian Dollar weakened against the Dollar and every single 10 currency today thanks to disappointing domestic data from Australia.

Appetite towards the Australian Dollar is set to weaken further given how the Reserve Bank of Australia has cut interest rates to a historic low of 1%. Focusing on the technical picture, prices are under pressure on the daily charts. The recent breakdown below 0.6950 signals further downside with the next key level of interest around 0.6900. Should the AUDUSD dip below this point, bears are likely to attack 0.6800.

Gold fights to reclaim $1400….

Gold’s passionate effort to reclaim the $1400 level was sabotaged by a stronger Dollar this afternoon.

The precious metal rebounded towards the $1400 level but failed to push higher as investors re-accessed Fed cut bets. While Gold may face headwinds in the short term, the metal has nothing to worry about in the medium to longer term given the unfavourable global conditions. For bulls to jump back into the game, Gold needs to secure a daily close above $1400.


Disclaimer: The content in this article comprises personal opinions and should not be construed as containing personal and/or other investment advice and/or an offer of and/or solicitation for any transactions in financial instruments and/or a guarantee and/or prediction of future performance. ForexTime (FXTM), its affiliates, agents, directors, officers or employees do not guarantee the accuracy, validity, timeliness or completeness, of any information or data made available and assume no liability as to any loss arising from any investment based on the same.


Forex-Time-LogoArticle by ForexTime

ForexTime Ltd (FXTM) is an award winning international online forex broker regulated by CySEC 185/12 www.forextime.com

EURUSD: euro and pound weakened

By Alpari.com

Previous:

On Tuesday the 9th of July, trading on the euro closed slightly down. All the majors were trading down against the US dollar, which rose sharply following a positive jobs report in the US on the 5th of July.

Growth on the euro saved the EURGBP cross from decline. Here, bulls bought up the euro amid Brexit uncertainty and expectations that there could be a decline in British GDP for Q2.

Day’s news (GMT+3):

  • 11:30 UK: GDP (May), industrial production (May), manufacturing production (May), trade balance (May).
  • 17:00 Canada: BoC interest rate decision and rate statement.
  • 17:00 US: wholesale inventories (May), Fed’s Chair Powell speech.
  • 17:15 Canada: BoC press conference.
  • 17:30 US: EIA crude oil stocks change (5 Jul).
  • 21:00 US: FOMC minutes.

EURUSD H1Current situation:

The first half of my forecast went as planned. The second didn’t go as smoothly, as the bulls were chipping away at the euro crosses. At the time of writing, the euro is trading at 1.1217. The pair is trading around the LB balance line.

I reckon that the bears will go on the attack once the bulls on the euro crosses run out of steam. Judging by the channel and the three lows shown on the chart, my target for today is at 1.1180, with yesterday’s target of 1.1175 also still in play.

Traders will have their eyes on Fed Chair Jerome Powell’s speech. Today, he will testify before the House Financial Services Committee, and on Thursday before the Senate Banking Committee. Traders will be listening out for hints on how big a rate slash to expect at the end of July: 25 or 50 base points.

By Alpari.com

Markets calm ahead of Powell testimony

By IFCMarkets

SP500 ticked up while Dow slipped ahead of Powell testimony

US stock market ended mostly higher on Tuesday ahead of Powell’s two-day testimony to Congress starting today. The S&P 500 advanced 0.1% to 2979.63. Dow Jones industrial however slipped 0.1% to 26783.49. The Nasdaq rose 0.5% to 8141.73. The dollar strengthening continued at previous pace as investor anticipate an indication from Fed chair Powell the Federal Reserve still plans to implement a 25 basis point rate cut at July 30-31 meeting while a bigger cut is seen unlikely after stronger than expected June jobs re[port last Friday: the live dollar index data show the ICE US Dollar index, a measure of the dollar’s strength against a basket of six rival currencies, added 0.1% to 97.49 and is higher currently. Stock index futures point to lower market openings today

DAX 30 still loss leader among European indexes

European stocks retreat deepened on Tuesday weighed by a warning of an autos slowdown from German chemicals giant BASF. The GBP/USD and EUR/USD slump continued with both pairs lower currently. The Stoxx Europe 600 ended 0.5% lower led by resources shares. The German DAX 30 fell 0.9% to 12436.55 dragged by more than 3% drop in BASF. France’s CAC 40 slid 0.3%. UK’s FTSE 100 slipped 0.2% to 7536.47 as average retail sales growth weakened to 0.6% in the 12 months to June, the slowest increase since 1995.

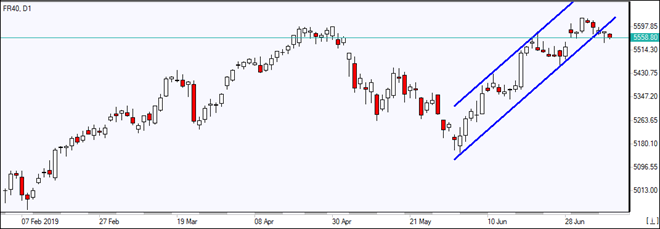
FR40 breaching down from uptrend channel   07/10/2019 Market Overview IFC Markets chart

Australia’s All Ordinaries Index gains while other Asian indexes fall

Asian stock indices are mixed today. Nikkei fell 0.2% to 21533.48 despite yen continuing slide against the dollar. Chinese stocks are mixed after report China’s consumer inflation held steady last month as slowing non-food prices offset faster gains in food prices: the Shanghai Composite Index is down 0.5% while Hong Kong’s Hang Seng index is 0.2% higher. Australia’s All Ordinaries Index however turned 0.4% higher with Australian dollar sliding further against the greenback as Australian consumer confidence fell to a two-year low.

Brent advances

Brent futures prices are extending gains today. The American Petroleum Institute late Tuesday report indicated US crude inventories fell by 8.1 million barrels last week. Prices inched up yesterday: September Brent added 0.1% to $64.16 a barrel on Tuesday. Today at 16:30 CET the Energy Information Administration will release US Crude Oil Inventories.

Market Analysis provided by IFCMarkets

Note:
This overview has an informative and tutorial character and is published for free. All the data, included in the overview, are received from public sources, recognized as more or less reliable. Moreover, there is no guarantee that the indicated information is full and precise. Overviews are not updated. The whole information in each overview, including opinion, indicators, charts and anything else, is provided only for familiarization purposes and is not financial advice or а recommendation. The whole text and its any part, as well as the charts cannot be considered as an offer to make a deal with any asset. IFC Markets and its employees under any circumstances are not liable for any action taken by someone else during or after reading the overview.

Dollar sentiment soured after weak inflation data

By IFCMarkets

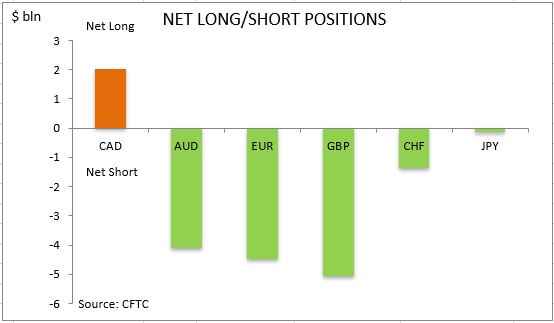
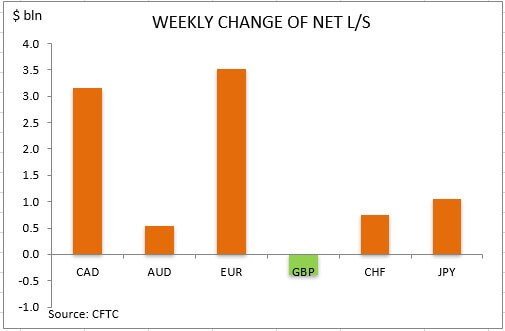
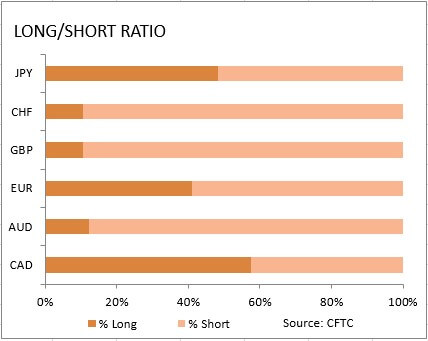
US dollar net long bets dropped dramatically to $ 13.12 billion from $21.75 against the major currencies during the one week period, according to the report of the Commodity Futures Trading Commission (CFTC) covering data up to July 2 and released on Monday July 8. The dollar sentiment deteriorated as Federal Reserve’s preferred gauge for inflation – the personal consumption expenditure index, declined from 1.6% over year in April to 1.5% in May while durable goods orders dropped 1.3% over month with trade deficit widening 5.1% .


CFTC Sentiment vs Exchange Rate

July 02 2019BiasEx RateTrendPosition $ mlnWeekly Change
CADbearishnegative20273150
AUDbearishnegative-4107547
EURbearishnegative-44783522
GBPbearishnegative-5056-383
CHFbearishnegative-1362751
JPYbearishnegative-1421042
Total-13117


commitment of traders net long short
commitment of traders weekly change
market sentiment ratio long short positions

Market Analysis provided by IFCMarkets

Note:
This overview has an informative and tutorial character and is published for free. All the data, included in the overview, are received from public sources, recognized as more or less reliable. Moreover, there is no guarantee that the indicated information is full and precise. Overviews are not updated. The whole information in each overview, including opinion, indicators, charts and anything else, is provided only for familiarization purposes and is not financial advice or а recommendation. The whole text and its any part, as well as the charts cannot be considered as an offer to make a deal with any asset. IFC Markets and its employees under any circumstances are not liable for any action taken by someone else during or after reading the overview.

US Dollar Strength Will Drive Markets Higher

By TheTechnicalTraders.com

Almost counter to current institutional thinking, the strength in the US Dollar will likely continue to push the US stock market higher over the next few weeks/months and act as a supporting price bias in any event of a short term global/us stock market price collapse.  Many traders/investors fail to understand the capacity of the US Dollar to wreak havoc on foreign markets as well as to act as a support level for US equities and US investments.

The support level near $96 is currently acting as a solid price floor.  Our researchers believe an attempt to breach the $99 level will happen soon and this continued strength will put further pressures on foreign currencies, commodities, metals and trade issues.

These shifting dynamics of the currency markets are presenting very clear evidence that investors believe stronger, more mature economies are going to continue to perform over the future months that weaker, more at-risk economies.  The Japanese Yen, Canadian Dollar, Swiss Franc, and US Dollar are all performing quite well in this Year-To-Date comparison graph (below).  The New Zealand Dollar, Euro, British Pound, and Australian Dollar are all dramatically weaker.

Our research team put this comparison chart together to further illustrate the weakness of Asian currencies in relation to the relative strength of the US and major global currencies.  This chart attempt to compare currency strength by grouping relative currency pairs and comparing them as an Asian Currency Group vs a Global Major Currency Group.  As price advances, the Asian Currency Group is relatively stronger overall.  As price declines, the Asian Currency Group is weakening and the Global Major Currency Group is strengthening.

Currently, this chart shows the fragility of the Asian Currency Group.  Any break of the lower price channel level and we enter a new downside price trend that may attempt to establish a much lower price support channel for Asian Currencies, Asian Stock Markets, and the overall global markets.

Our researchers believe the continued strength of the US Dollar and the US stock market are pushing historical normal price ranges beyond expected boundaries.  As gold increases because of fear and greed, countries with larger gold reserves can attempt to offset certain losses from currency and economic weakness.  Yet companies and governments that attempted to leverage the “Dollar Carry Trade” environment from years ago may find themselves in very dangerous territory as Asian currencies continue to weaken.

A stronger US Dollar will attempt to mute the upside price activity of Gold and Silver while pushing these currencies into deeper and deeper valuation declines.  See our recent charts and short term dollar/gold forecast here. A continued shifting of capital away from “at-risk” economies/nations could push these currencies into a death spiral type of free-fall over time.

We believe the US Dollar will continue to move moderately higher over the next 4+ weeks and likely attempt to move towards the $99 price level.  This move will somewhat mute the advance of Gold and Silver, yet we believe the weakness that is likely to unfold in the foreign currency markets will prompt renewed fear and greed – pushing Gold prices much higher – even as the US Dollar continues to strengthen.

Once the XAUUSD level breaks the $1440 level – it should rally up to the $1615 to $1625 level very quickly.  This would likely be the breaking point for the Asian currencies as well.  A move like that would likely push these Asian currencies below historical price envelopes and create a panic-type of a capital shift away from risk.

Our research team believes this move will likely happen sometime between Mid-August and early September 2019.  This means we are only about 35 to 45 days away from an incredibly volatile price swing in the global markets.  This is something that most traders/investors have failed to even begin to comprehend or consider.

What would happen if the Asian capital markets and currencies collapsed on broad weakness and a major credit/debt crisis event?  An event where currencies devalue to a level that suggests forward operations are severely threatened, the rising price of Gold is not offsetting losses and commodity prices collapse pushing even further pressures on commodity/currency backed loans/debt?

Be prepared for these incredible price swings before they happen and learn how you can identify and trade these fantastic trading opportunities in 2019, 2020, and beyond with our  Wealth Building & Global Financial Reset Newsletter.  You won’t want to miss this big move, folks.  As you can see from our research, everything has been setting up for this move for many months – most traders/investors have simply not been looking for it.

Join me with a 1 or 2-year subscription to lock in the lowest rate possible and ride my coattails as I navigate these financial market and build wealth while others lose nearly everything they own during the next financial crisis. Join Now and Get a 1oz Silver Round or Gold Bar Shipped To You Free.

I can tell you that huge moves are about to start unfolding not only in currencies, metals, or stocks but globally and some of these supercycles are going to last years. A gentleman by the name of Brad Matheny goes into great detail with his simple to understand charts and guide about this. His financial market research is one of a kind and a real eye-opener. 2020 Cycles – The Greatest Opportunity Of Your Lifetime

As a technical analysis and trader since 1997, I have been through a few bull/bear market cycles. I believe I have a good pulse on the market and timing key turning points for both short-term swing trading and long-term investment capital. The opportunities are massive/life-changing if handled properly.

I’M GIVING THIS GOLD BAR AWAY WITH 2-YEAR MEMBERSHIPS
AND 1OZ SILVER ROUND TO 1 YEAR SUBSCRIBERS

So kill two birds with one stone and subscribe for two years to get your
FREE GOLD BAR and enough trades to profit through the next metals
bull market and financial crisis!

SUBSCRIBE -> STACK GOLD BAR -> GET WINNING TRADES

Chris Vermeulen – TheTechnicalTraders.com


RICE Analysis: Bad weather can reduce rice harvest

By IFCMarkets

Bad weather can reduce rice harvest

Drought in India and worsening weather conditions in China can reduce yields. Will the rice quotation growth continue ?

According to the Indian Ministry of Agriculture & Farmers’ Welfare as of July 5, 2019, the area of summer rice crops in the country was 5.2 million hectares. This is almost a quarter less than last year’s level for the same date. In India, the rainy season began because of the monsoons. It is usually observed from June to September. Already the 5th week in a row there is a lack of rain. Moreover, their number for the week ended July 3 was 6% lower than the average for the last 50 years. Lack of moisture can be a major factor in reducing the yield of rice and other crops in India. In China, there is increased heat, but precipitation is still common for midsummer. Note that the main global rice exporters are located in one region – in Asia: India, Thailand, Vietnam and Pakistan. China is the world’s largest importer of rice.

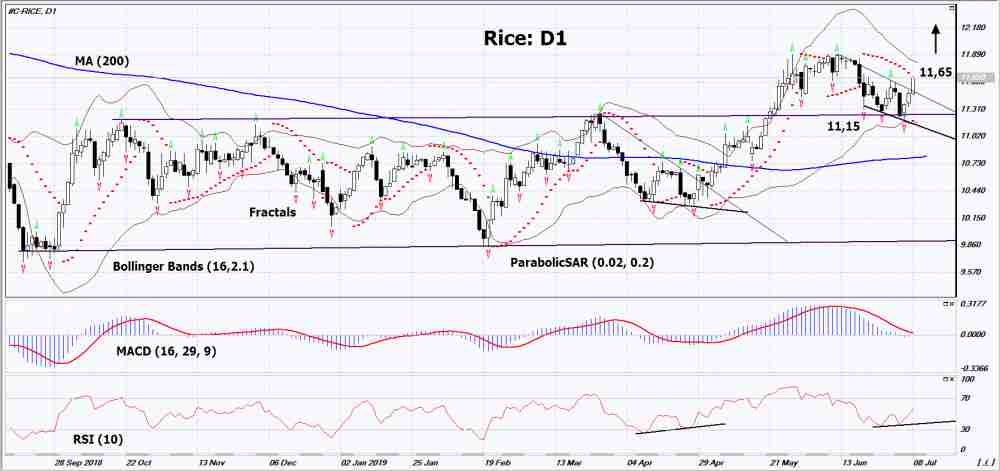
Rice

On the daily timeframe Rice: D1 is in the mid-term uptrend. The line of the previous neutral trend has now become a support level that was not broken down during the price correction.
Various technical analysis indicators have generated an uptrend signals. Further growth of quotations is possible in case of a further reduction in world yield.

  • The Parabolic indicator shows an uptrend signal.
  • The Bolinger bands have narrowed, indicating a volatility decrease. The bottom line of Bollinger has a slope up.
  • The RSI indicator is above the 50 mark. It has formed a divergence to increase.
  • The MACD indicator shows a signal to increase.

The bullish momentum may develop in case if Rice exceeds its last maximum: 11.65. This level can be used as an entry point. The initial stop loss can be placed below the Parabolic signal, the last 2 lower fractal and the bottom Bollinger line: 11.15. After placing the pending order, the stop loss shall be moved following the signals of Bollinger and Parabolic to the next fractal minimum. Thus, we are changing the potential profit/loss to the breakeven point. More risk-averse traders may switch to the 4-hour chart after the trade and place a stop loss moving it in the direction of the trade. If the price meets the stop level (11,15) without reaching the order (11,65), we recommend to cancel the order: the market sustains internal changes that were not taken into account.

Technical Analysis Summary

PositionBuy
Buy stopAbove 11,65
Stop lossBelow 11,15

Market Analysis provided by IFCMarkets

Using ISM PMI To Predict The NFP

By Orbex

Among many things, one of the most closely watched reports when it comes to forex trading is the ISM’s PMI. PMI stands for Purchasing Manager’s Index and the ISM report indicates business conditions in two main sectors.

The ISM PMI survey is conducted by the US-based Institute for Supply Management (ISM for short). ISM is a non-profit organization. These surveys are leading indicators and they give traders a glimpse into various aspects of the economy.

The ISM’s PMI reports are an important market moving indicator. Not only do these surveys predict the short-term outlook, but the reports are also widely used elsewhere. One of the most common uses of the ISM’s PMI reports is in predicting the non-farm payrolls report.

The NFP report is a monthly employment report which is released by the Bureau of Labor Statistics. Besides serving as a tool to predict payrolls, the ISM reports also show how businesses are faring.

What Does the ISM PMI Comprise of?

The ISM surveys cover the manufacturing and non-manufacturing sectors. The non-manufacturing sectors are also called the services sectors.

They are conducted based on a survey of various participating firms. Any firm can sign up to receive the survey questions and report to ISM accordingly.

Officially, the ISM’s reports are called as:

  • Manufacturing ISMÓ Report on Business
  • Non-Manufacturing ISMÓ Report on Business

They are both released during the first week of the month with the results for the previous month.

In the survey, firms are asked to report on a number of factors as listed below:

  • Business Activity/Production
  • New orders
  • Employment
  • Supplier Deliveries
  • Inventories
  • Prices
  • Backlog of orders
  • New export orders
  • Imports
  • Inventory Sentiment
  • Customer Inventories

Within each of these sections, the firms report on the direction e.g: growing, slowing, increasing. They also report on the rate of change as slower, faster, same (or unchanged) and N/A.

Within the non-manufacturing and manufacturing sectors, there are also sub-industries. In the non-manufacturing sector, there are a total of 16 sub-industries while the manufacturing sector has a total of 18 sub-industries.

How to Read the Employment Survey

As you already know, the ISM survey covers a wide aspect of the business. Among these, the employment section is quite useful in predicting the official payroll reports. The firms participating in the survey are asked to report whether they are experiencing faster or slower business growth.

One of these components reflects on employment or hiring trends. While there is no concrete evidence, many economists believe the employment sector in the surveys has a close relationship with the payrolls report.

The ISM releases their findings in a PDF or an online format. You can find a brief summary of the employment section of the survey. The Employment activity index is expressed as a percentage.

Typically, a rising or a positive print from the previous month (for both manufacturing and non-manufacturing surveys) is a good indicator for the official payrolls report. Other aspects that can influence the payrolls report are the backlog of orders and new orders.

When these components rise, firms tend to expand their hiring in order to meet the demand for the fulfillment of the orders.

Predicting the NFP Figures

While the ISM PMI reports are a good indicator, traders should not solely rely on just the ISM figures. This is because there are a number of other reports to which traders should also pay attention.

Some of the important leading economic indicators that you can also use in forecasting the payrolls are:

  • Challenger Job Cuts
  • Initial and continuing weekly jobless claims
  • ISM NMI and Manufacturing PMI
  • UoM Consumer Confidence Report
  • Conference Board’s Consumer Sentiment Report
  • ADP Private Payrolls Report

Remember that there is no proven methodology that can accurately predict the payrolls report. When trading NFP, you should consider the relationship between the forecast and actual numbers.

The payrolls also feature revisions to previous monthly data that can influence the market reaction. Besides the NFP numbers, wages and the unemployment rate are also important.

Thus, in conclusion, ISM PMI reports can give you some insight into how businesses are faring. When you combine the information with other reports, you can get a fair idea of how the economy is doing as a whole. This can help you get a basic idea of what to expect from the most anticipated event for forex traders, the NFP.

By Orbex