It’s been a volatile week for the Mexican peso. The currency cratered lower yesterday in response to the shocking resignation of the country’s finance minister Carlos Manuel Urzua Marcias.
In a story similar to that of Turkish president Erdogan firing the head of the CBRT, the finance minister had reportedly clashed with Mexico’s left-leaning president Andres Manuel Lopez Obrador. The dispute was over “economic discrepancies” as well as the “imposition of officials that have no knowledge of public finance”.
Urzua Notes “Discrepancies”
In his resignation letter, Urzua wrote:
“There were many discrepancies in economic matters… I am convinced that all economic policy should be carried out based on evidence, taking care of the different effects it can have and free from all extremism, be it from the right or left.”
Mexican Fiscal Credibility in Question
This episode could prove a sharp blow to MXN capital inflows.Banxico credibility and high implied yields of over 8% have been attracting increased levels of foreign capital recently with investors looking to take on MXN exposure. However, the resignation has cast heavy doubts over the credibility of Mexico’s fiscal management.
MXN Recovers as Herrera Appointed as Replacement
The Mexican administration looked to soften the blow by appointing deputy finance minister Arturo Herrera as Urzua’s replacement. Herrera is known for his technical capacity and market-friendly views.
In his first news conference as finance minister, he told reporters that he does not see an impending recession in Mexico. This is despite economic growth having contracted 0.2% in Q1 2019.
Herrera’s appointment worked to offset some of the concern in the market. USDMXN conceded around one-third of its prior gains.
Moody’s Concerned Over Mexican Economy
However, despite Herrera’s appointment, ratings agency Moody’s has expressed concerns over the Mexican economy.
Moody’s stated:
“We expect investor uncertainty with regards to economic policy management to persist. This is in line with the views that led us to assign a negative outlook on Mexico’s sovereign rating earlier this year,”
Technical Perspective
The H1 chart shows the scale and severity of the move lower in MXN. USDMXN moves from sub 18.9112 to well above the 19.2731 resistance level. Price has since retraced somewhat and has now settled below the level. However, it remains above the 19.0788 broken highs. Therefore, focus is now on a further grind higher.
After Columbus discovered the New World in 1492 and the Spanish began to extract vast amounts of gold and silver from Mexico and South America during the 16th century, the global production of precious metals would grow considerably over the following centuries. However, the rise of gold production during this period still pales in comparison to what is taking place in the modern gold mining industry today.
Before Spain discovered the New World (as history suggests), most of the gold production in the world took place in Europe and Africa. Yes, there was also some gold production in India and Asia, but the majority came from Europe and Africa. And, of the total gold production in Europe, 80% came from the Austria-Hungary region. So, it’s no surprise that the rise of the infamous Habsburg Empire of Europe began in and around the Austria-Hungary area.
Furthermore, when Spain conquered Mexico and South America (including Central America), the riches they received from the discovery and production of gold and silver gave them the power to lead the Habsburg Empire of Europe for the 16th and 17th Centuries. Thus, there was no coincidence that Spain became the World Super Power for centuries due to the huge discovery of new gold and silver mines (and gold looting) in Mexico and South America.
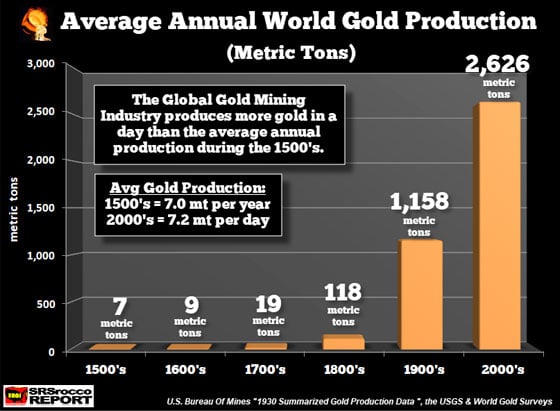
According to several sources, the world was producing approximately 7 metric tons (mt) of gold per year during the 1500’s (16th century). From 1493-1600, total world gold production was estimated to be 22.9 million oz (Moz), or a little more than 200,000 oz per year. However, gold production in 2018 was 3,332 mt or 107 Moz. So, what it took to produce 7 metric tons in one year during the 16th century, the current gold mining industry can supply that in a day:
Here we can see that global gold production increased exponentially in the 1800-1900’s. While part of the reason for the massive increase in global gold production during this period was due to new large gold deposits found in the United States, Australia, and South Africa, another factor was the introduction of fossil fuels as a much higher power source, including advanced extraction and processing technology.
Basically, the gold mining industry transitioned from human and animal labor digging up and transporting gold from narrow high-ore grade veins to massive open-pit low-grade mines using liquid petroleum as an energy source powering enormous haul trucks that can remove 300-400 tons of ore in a single trip while utilizing coal and natural gas generated electricity for processing.
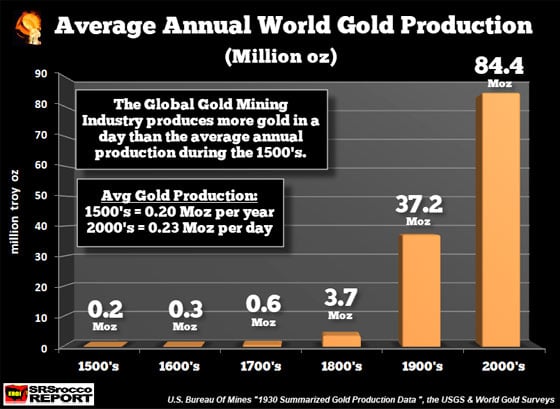
Here is the same chart above, but shown in a million troy ozs:
If we divide the average of 84.4 Moz of annual gold production during the 2000’s by 365 days, it equals 231,000 oz per day or 0.23 Moz versus 0.2 Moz a year during the 1500’s. However, this is the average for the past 18 years. If we considered the 107 Moz of gold production last year, the global gold mining industry produced nearly 300,000 oz of gold per day in 2018.
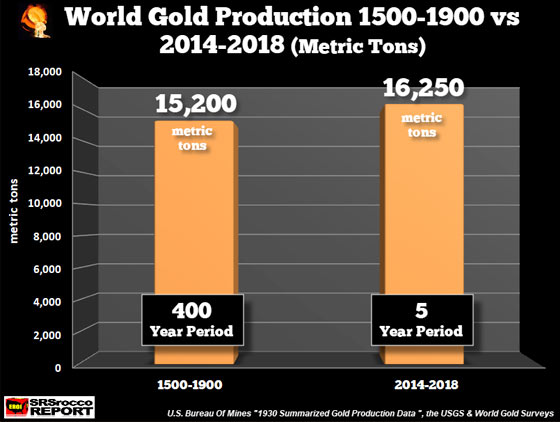
While this is a fascinating statistic, let’s look at the next chart. In just the past five years, the gold mining industry produced more gold than what the world mines supplied for 400 years, from 1500-1900:
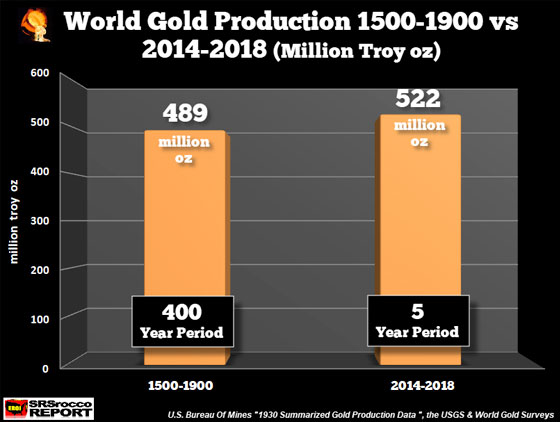
And in a million troy ozs:
Thus, the world was producing an average of 1.2 Moz per year from 1500-1900 (489 Moz divided by 400 years) versus 104 Moz per year (522 Moz divided by 5) for the past five years. It’s truly amazing the amount of condensed energy that fossil fuels provide, especially oil. As I have mentioned in previous articles, the energy content in one barrel of oil equals 10,000-20,000 hours of human labor. If we take the average of 15,000 human labor hours per barrel of oil, that would also equal the manpower of 150 mine employees working 10 hours a day for two weeks (10 work days).
So, with just one barrel of oil, the modern mining industry has replaced the energy-labor of 150 workers for two weeks of work. Just think about the immense amount of oil the top gold miners consume each year. According to Newmont and Barrick (two largest gold miners) Sustainability Reports, their combined diesel and heavy oil consumption in 2017 was a stunning 80 million barrels of oil equivalent.
Now, let’s convert the human energy content in 80 million barrels of oil equivalent:
80 million barrels X 15,000 human labor hours = 1.2 trillion human labor hours.
1.2 trillion human labor hours divided by 365 days = 3.3 billion human labor hours per day
3.3 billion human labor hours per day divided by 24 hours = 137 million workers per year
By Newmont and Barrick consuming 80 million barrels of oil to produce gold in 2017, they utilized the manpower of 137 million laborers working 24 hours a day for 365 days a year. We must remember, most of these gold mines are running 24 hours a day. However, if we look at the employee data from Newmont and Barrick Sustainability Reports, their total global workforce was only 48,700 in 2017.
Gold mining analysts and precious metals investors seemingly have no clue the tremendous amount of energy that comes from a barrel of oil. We have taken for granted, the energy that oil provides the foundation for our high-tech world today. When oil production peaks and declines, gold production will be negatively impacted. It will no longer be economically feasible to extract gold in large open pit mines with ore grades in the 1-2 gram per ton range (or even higher).
Lastly, if we have to return to mining high-quality narrow vein gold, then global production will drop like a rock. Investors will then be forced to buy mostly the only above-ground inventories of gold. At that point, physical gold buying will destroy the Paper Comex manipulation policy controlled by the Fed and member Bullion Banks.
So… it’s extremely wise for precious metals investors to PAY ATTENTION to what happens to GLOBAL OIL PRODUCTION.
The Money Metals News Service provides market news and crisp commentary for investors following the precious metals markets.
High-net-worth individuals will increasingly be seeking to Corbyn-proof their finances, says the CEO of one of the world’s largest independent financial advisory organizations.
The assessment from Nigel Green, chief executive and founder of deVere Group, which has $12bn under advisement, comes as Jeremy Corbyn, the leader of the UK’s official opposition party, Labour, confirms his party would campaign to remain in the EU should there be a second Brexit referendum under a Conservative government.
Mr Green affirms: “Although Mr Corbyn has still not confirmed what his party would do with Brexit should he become British Prime Minister, there seems to be a gradual transition towards Labour becoming an out-and-out Remain party.
“This will prove to be a popular step in the right direction for huge swathes of the UK electorate. As such, Mr Corbyn’s chance of sweeping into government in the – likely – event of a general election is greater.”
This, says the deVere CEO, will put wealthy Britons ‘on notice.’
In May, he noted: “Since the beginning of the year a large and growing number of clients are telling our advisers that for their wealth, they fear the damaging impact of a Jeremy Corbyn-led government more than Brexit.
“Should the Brexit turmoil continue, and the Conservatives keep losing ground to Corbyn’s Labour, it can be reasonably expected that a considerable amount of our clients will move their assets outside of the UK.”
Now, this trend will pick up pace.
He says: “Following Jeremy Corbyn’s apparent shift towards Labour becoming a full-blown Remain party – and therefore the perception that he is now more likely to secure the keys to Number 10 – an increasing number of high net worth clients will seek to Corbyn-proof their finances.
“There are real concerns from these individuals that a Corbyn-led government would increase inheritance taxes, income taxes, stamp duty and capital gains taxes, potentially even roll out capital controls, and slash other areas, such as pensions tax relief.
“To counteract the damaging effects of these policies on their wealth, I believe that over the next few months, more and more of them will be actively considering established, legitimate overseas opportunities to create, build, and importantly, protect their wealth.”
Mr Green concludes: “Rightly or wrongly, Mr Corbyn is seen as a bigger threat to high net worth individuals’ wealth and the UK’s economic outlook than even Brexit.
“And they can be expected to seek alternatives in greater and greater numbers as his shifts towards Remain develop.”
About:
deVere Group is one of the world’s largest independent advisors of specialist global financial solutions to international, local mass affluent, and high-net-worth clients. It has a network of more than 70 offices across the world, over 80,000 clients and $12bn under advisement.
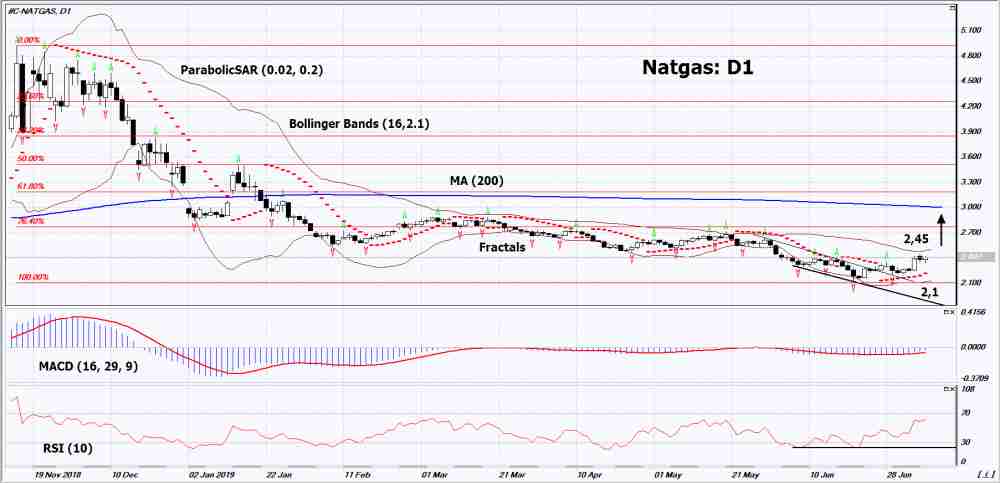
The United States Energy Information Administration (EIA) raised its forecast for US natural gas consumption for 2019 and 2020. Will the NATGAS quotations growth continue ?
EIA published the Energy Overview (Short-Term Energy Overview) for July. Compared to the June overview, gas consumption in the United States is expected to increase by 0.42 billion cubic feet per day to 84.59 billion cubic meters in 2019 and by 0.16 billion cubic feet per day to 2020 to 84.54 billion. In other words, gas consumption should be reduced in the United States next year. It is difficult to say whether this is possible. This EIA forecast assumes the recovery of US natural gas reserves. For a long time (from September 2017) they are below their 5-year average. And in March of the current year they were one third lower than this average. Large-scale plans to increase the export of American liquefied natural gas (LNG) can help reduce reserves and increase quotes for ordinary natural gas. In this and next years, several large LNG terminals will be launched in the USA. Note that, according to U.S. The Commodity Futures Trading Commission for the past week, the number of positions for the sale of natural gas (net short) reached a maximum since November 2015, and the number of positions for purchase (net longs) has been at a minimum since December 2011. If speculators are forced to close short positions, the upward movement of gas quotations may receive an additional impetus.
On a daily timeframe Natgas: D1 broke up the downtrend resistance line and adjusted upward. Various technical analysis indicators have generated an uptrend signals. Further growth of quotations is possible in case of an increase in demand in the USA and a massive closure of short positions.
The Parabolic indicator shows a signal to increase.
The Bolinger bands narrowed, indicating a volatility decrease. Both Bollinger lines are sloping up.
the RSI indicator is above the 50 mark. It formed a weak divergence to increase.
The bullish momentum may develop if Natgas exceeds its last maximum: 2.45. This level can be used as an entry point. The initial stop lose may be placed below the two last lower fractals, the bottom Bollinger line, the minimum since May 2016 and the Parabolic signal: 2.1. After opening the pending order stop shall be moved folowing the signals of Bollinger and Parabolic to the next fractal minimum.Thus, we are changing the potential profit/loss to the breakeven point. More risk-averse traders may switch to the 4-hour chart after the trade and place a stop loss moving it in the direction of the trade. If the price meets the stop level (2,1) without reaching the order (2,45), we recommend to cancel the order: the market sustains internal changes that were not taken into account.
The US dollar has weakened over early European trading on Wednesday as the market awaits the release of the June FOMC meeting minutes. The minutes are expected to give further insights into the likelihood of the bank cutting rates at the upcoming July meeting later this month. The market is currently pricing in a .25% cut. USD index trades 97.02 last with price trading back below the 97.10 level.
USD Weighs on EUR
EURUSD has broken firmly higher today with price surging back above the 1.1217, taking advantage of USD weakness. A set of dovish FOMC minutes later today could add further fuel to the recovery which is likely to remain USD focusedin the absence of any tier-one domestic data.
GBP Rises on GDP data
GBPUSD has enjoyed better trading again today with price recovering further off the 1.2438 lows to trade 1.2489 last. The latest UK data, released today, has given further support. Monthly GDP was seen rising 0.3% over the 3 months to May, well above the expected 0.11% increase the market was looking for.Trade balance data also showed a narrowing of the deficit in May while construction output was seen jumping 1.7%, again, well above the projected 0.9% rise.
SPX500 Lower
Risk assets have been lower today also, failing to take advantage of USD weakness. Expectations of Fed easing have kept SPX500 well supported over recent weeks. If we see a dovish set of FOMC minutes later today, we could see a return to the rally. However, should the minutes cast any doubt over the prospect of a July hike, we could see the market coming off further. SPX500 trades 2973.73 last, still above the 2963.89 level for now.
Safe Havens Weaken
Safe havens have added to the incongruity of the moves we have seen so far today with both JPY and gold down, despite USD weakness and softer equities prices. XAUUSD remains above the 1382.06 support for now, trading 1392.40 last. USDJPY trades 108.94 last as price continues to hold above the recently broken 108.78 level, keeping focus on further upside in the near term.
Crude Rises On Further Inventories Drawdown
Oil has had a much stronger week so far, following the sell-off last week. Yesterday, the API reported a heavy drawdown in US crude stores, which has supported price. If the move is confirmed by the EIA’s report later today, this could be strongly bullish for oil. Crude trades 59.06 last, with price having broken above the 57.85 level and now heading back up towards the 60.00 region.
BOC in Focus
USDCAD has had a subdued morning with price remaining capped by the 1.3136 level so far. A weaker USD, as well as stronger oil prices, have quashed the recovery for now. The main focus for CAD traders today will be the BOC meeting. The bank is not expected to adjust policy though there are upside risks in terms of the outlook and forward guidance in light of recent positive economic developments.
AUDUSD has traded higher over the European session so far on Wednesday, taking advantage of a lower USD. RBA cuts, as well as the recent move lower in gold, have weighed on AUD over recent weeks though optimism around a potential US/China trade deal is keeping the pair underpinned. For now, AUDUSD remains below the .6940 support having reversed sharply from highs above .70 last week.
The markets were trading mostly flat on the day on Tuesday thanks to a lack of economic data. Investors are now waiting for Fed Chair Jerome Powell’s testimony today.
Powell will be making prepared remarks later today. Following the somewhat better than expected payrolls report in June, investors are scaling back their bets for a rate cut. The Bank of Canada will also be holding its monetary policy meeting later today.
Euro Continues to Weaken
The common currency remained weak as it extended declines even further on Tuesday. Economic data from the eurozone was confined to Italy’s retail sales. Retail sales were down 0.7% on the month. Meanwhile, the election in Greece has brought out the populist right-wing party as the leader. The euro did not react much to the news.
EURUSD to Continue to Drift Lower
The currency pair has pushed lower since the start of the week. We expect the declines to eventually conclude lower to the 1.1188 level. If the support level here holds, there is scope for the EURUSD to rebound in the short term. But if price breaks past this level, the currency pair is likely to test the previous lows near 1.1140.
Crude Oil Gains on API Inventory
WTI Crude oil prices posted modest gains on Tuesday. The gains came on the back of the American Petroleum Institute’s weekly inventory report. API reported a drawdown of 8.129 million barrels for the week ending July 4th. This was a bigger than expected draw. WTI Crude oil prices jumped 1.35% on Tuesday.
Will Oil Prices Trend Higher?
As oil prices reclaimed the support/resistance area of 57.50, the bias is looking to the upside. The bearish flag pattern is starting to be invalidated on the evolving price action. The upside target is now back to the 60.00 handle that was previously tested. Oil prices will need to break past this level to continue maintaining the upside trend.
Gold Stays Muted as it Maintains Range
Gold prices were trading flat on the day, posting some modest gains. Price action was confined within the range of 1404 and 1383 for the most part of the week. A lack of clear economic data and a flat market sentiment kept the price of the precious metal unchanged.
Will Gold Continue to Trade Flat?
The current sideways price action has been maintained since late last week. With the range being formed, a breakout is evident. The bias remains balanced at the moment. An upside breakout could push gold prices higher, testing the previous highs. However, given the break of the rising trendline, there is scope for the lower end of the range at 1383 to be breached.
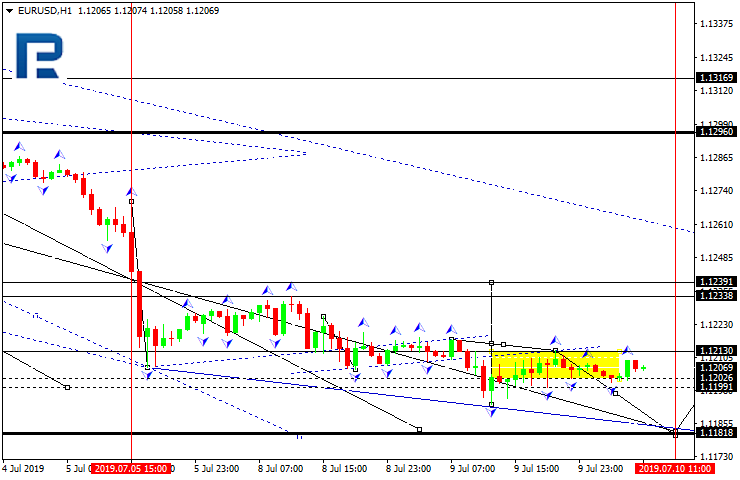
After finishing another descending structure, EURUSD has completed the ascending impulse along with the correction, thus forming a new consolidation range between 1.1213 and 1.1199. If later the price breaks the range to the downside, the instrument may continue trading downwards to reach 1.1181; if to the upside – start a new correction with the target at 1.1239.
GBPUSD, “Great Britain Pound vs US Dollar”
GBPUSD has reached the downside target; right now, it is consolidating near the lows. Possibly, the pair may expand the range towards 1.2430 and then grow to reach 1.2475. If later the price breaks this range to the upside, the instrument may be corrected towards 1.2615; if to the downside – resume trading inside the downtrend with the target at 1.2413.
USDCHF, “US Dollar vs Swiss Franc”
USDCHF is consolidating around 0.9922. If later the price breaks this range to the upside, the instrument may resume trading inside the uptrend towards 0.9999; if to the downside – start another correction with the target at 0.9850.
USDJPY, “US Dollar vs Japanese Yen”
USDJPY is still consolidating around 108.85. Possibly, today the pair may form one more ascending structure to reach 109.05 and then start a new decline with the target at 108.55.
AUDUSD, “Australian Dollar vs US Dollar”
AUDUSD has finished the downside target; right now, it is consolidating around 0.6930. If later the price breaks this range to the downside, the instrument may resume trading inside the downtrend with the short-term target at 0.6868; if to the upside – start another to reach 0.6960.
USDRUB, “US Dollar vs Russian Ruble”
USDRUB is still consolidating around 63.43 without any particular direction. Today, the pair may break the range to the upside to reach the short-term target at 64.06 and then form a new descending structure to return to 63.43. Later, the market may start a new growth towards 64.40 and then continue trading downwards with the target at 60.00.
XAUUSD, “Gold vs US Dollar”
Gold is consolidating around 1390.30. Possibly, today the pair may form a new descending structure with the first target at 1372.50 and then start another growth to test 1405.20 from below. After that, the instrument may resume trading inside the downtrend with the short-term target at 1350.00.
BRENT
Brent is trading to break 64.90 upwards. Possibly, the pair may grow with the short-term target at 66.70 and then start a new correction towards 65.00. Later, the market may continue trading upwards with the first target at 67.50.
Attention! Forecasts presented in this section only reflect the author’s private opinion and should not be considered as guidance for trading. RoboForex LP bears no responsibility for trading results based on trading recommendations described in these analytical reviews.
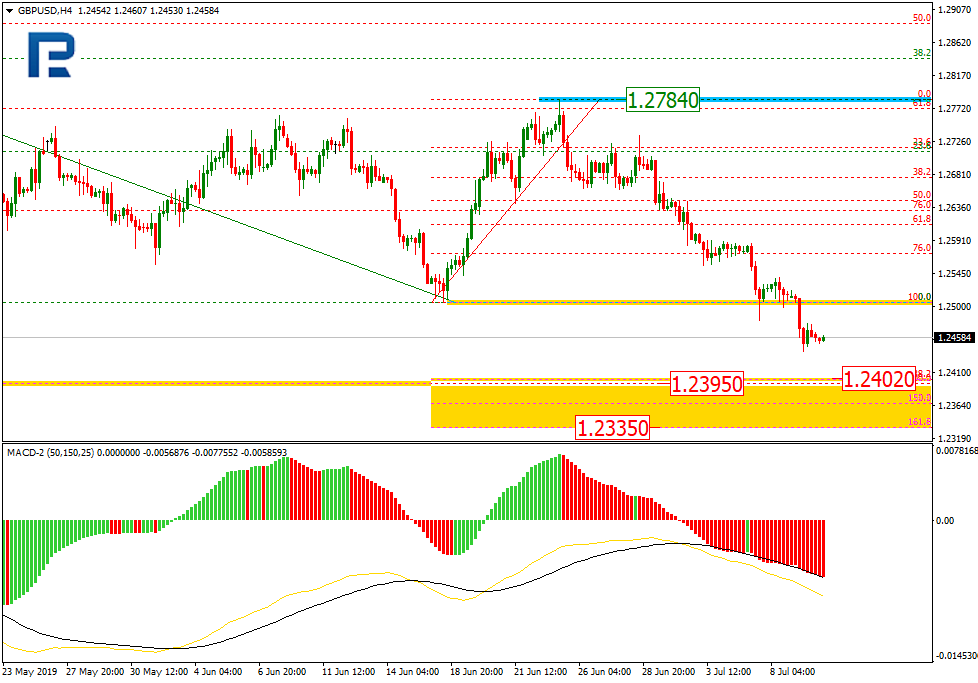
As we can see in the H4 chart, the current downtrend is moving towards the long-term low at 1.2395. However, the key targets are inside the post-correctional extension area between 138.2% and 161.8% fibo at 1.2402 and 1.2335 respectively. The resistance is the current fractal high at 1.2784.
In the H1 chart, the pair is trading downwards. At the same time, there is a convergence on MACD, which indicates a new pullback after the price reaches its closest target at 1.2402. The targets of this pullback may be 23.6%, 38.2%, and 50.0% fibo at 1.2492, 1.2548, and 1.2593).
EURJPY, “Euro vs. Japanese Yen”
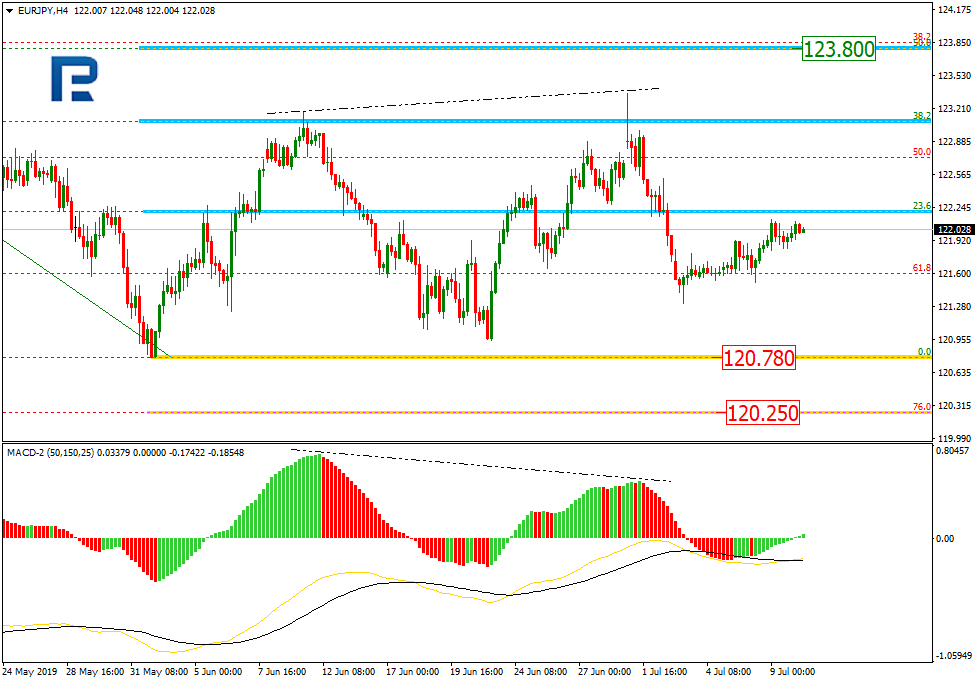
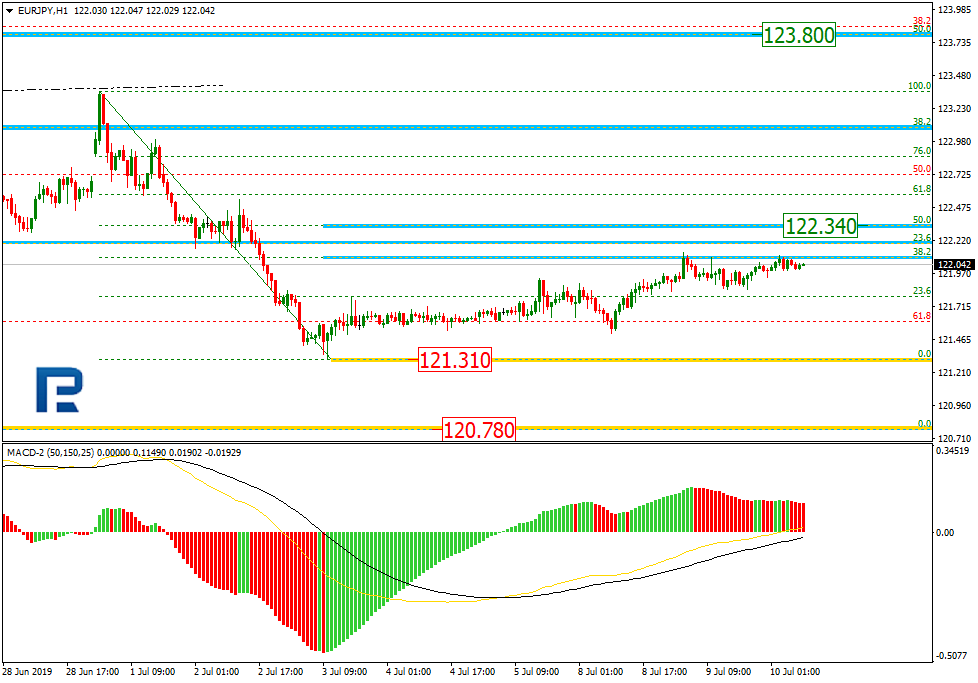
As we can see in the H4 chart, the correction continues. There is a possibility that the price may start a new correctional uptrend towards 50.0% fibo at 123.80, but this possibility is very unlikely. According to the main scenario, the instrument may fall to break the low at 120.78 and then mid-term 76.0% fibo at 120.25.
In the H1 chart, the pair completed the descending wave and started a new correction, which has already reached 38.2% fibo. Later, the correction may reach 50.0% at 122.34. After completing it, the instrument may start a new descending wave towards the local low at 121.31 and the key one at 120.78.
Attention! Forecasts presented in this section only reflect the author’s private opinion and should not be considered as guidance for trading. RoboForex LP bears no responsibility for trading results based on trading recommendations described in these analytical reviews.
The Bank of Canada will be holding its monetary policy meeting this week on Wednesday. The bank has left interest rates unchanged at 1.75% for the past five monetary policy meetings.
While the central bank’s forward guidance has turned dovish previously, we expect that this could change. However, it could still remain cautious. The central bank was proved right when it deemed the soft economic patch in Canada temporary.
Bank of Canada – Interest Rates, 1.75%
Various measures of economic data show that there is a strong chance for the economy to bounce back. This included the better than expected inflation data. GDP has also been ticking higher since April after declining in the months before.
Canada Inflation Hits BoC’s Target Rate
Inflation data from Canada for May saw consumer prices rising to the BoC’s inflation target rate of 2.0%. The core inflation measures were one of the highest since 2012.
Headline inflation in May rose 2.4% on the year, coming out stronger than expected
The BoC core measures of inflation have been at 2.1% on average
The uptick in inflation came on higher prices in food and transportation, pushing the yearly inflation rate higher
The May inflation report was no doubt stronger than expected. Following the report, the expectations for the BoC to cut rates fell. The markets are expecting less than a 50% chance of a rate cut from the BoC this year.
The uptick in inflation is likely to see the pressure easing on the Bank of Canada. However, the central bank is unlikely to react to the inflation report with a rate hike. At best, the higher prices in food and transportation will keep the BoC in a wait-and-see mode.
Despite the positive inflation data, major headwinds still remain for the BoC which will result in the central bank treading cautiously. But the likelihood of a rate cut remains low at the moment.
Canada’s Unemployment Rate Ticks Higher
The latest jobs report, however, was a tad disappointing with the data seen to be unlikely to shift the BoC’s view on interest rates. Data from Statistics Canada showed last Friday that the jobless rate ticked higher.
Canada’s unemployment rate rose to 5.5% while the economy was seen shedding 2,200 jobs during the month in June. But, despite the weaker than expected jobs report, economists shrug aside data following two months of solid gains on the jobs sector.
But given the weakness in the jobs report, the optimism drawn from the inflation and rising GDP numbers could be offset.
Will the BoC Signal Rate Hikes Again?
Policymakers at the Bank of Canada are likely to see diverging paths, especially comparing to the Fed and the ECB. Both the central banks have been preparing the markets for a possible rate cut.
While the Fed remains on the sidelines, for now, the recent declines across various sectors add to the downside view. The markets remain hopeful for at least two rate cuts from the Fed.
The ECB, on the other hand, has sent across the message that interest rates could be lowered further. It also opened up the possibility of restarting its QE program. In contrast, the BoC remains one of the few central banks that could either see rates remain on hold or perhaps even a rate hike.
Given the global headwinds and the trade uncertainty, it is unlikely that the BoC will hastily raise rates. As a result, we expect the Bank of Canada to strike a cautious tone in the markets this week.
There is scope for the BoC to do away with the dovish forward guidance, it could be replaced with a hint of hawkishness while remaining cautious of the incoming economic data.
That was shortly before the G20 summit in Osaka, and initially, the USD/JPY was again sold against the upper trendline. But the bearish momentum which was taken on wasn’t strong enough to push the currency pair towards and below new yearly lows around 106.70.
Instead, the USD/JPY broke out of the downtrend channel and is now eyeing 109.00 again, mainly driven by a very solid NFP reading last Friday. The reason that is noteworthy is that, as a result, the probability of a 50bp rate cut from the Fed coming on the July 31 was completely priced out and drove 10-year US yields higher, and thus the USD/JPY.
With that in mind, today’s FOMC Minutes will be carefully reviewed for any signs noting if a 50bp rate cut is still an option with a small probability, even after a strong job report.
If yes, the USD/JPY has a serious chance of another aggressive push lower, and 106.70 could be on the table again into the second half of the week.
If no, in our opinion there seems to be no reason not see the USD/JPY make it back above 109.00, even though we stay mid-term sceptical for the long-side in the currency pair.
Source: Admiral Markets MT5 with MT5-SE Add-on USD/JPY Daily chart (between April 20, 2018, to July 9, 2019). Accessed: July 9, 2019, at 10:00pm GMT – Please note: Past performance is not a reliable indicator of future results, or future performance.
In 2014, the value of USD/JPY increased by 13.7%, in 2015, it increased by 0.5%, in 2016, it fell by 2.8%, in 2017, it fell by 3.6%, in 2018, it fell by 2.7%, meaning that after five years, it was up by 4.1%.
Investing in Forex with Admiral Markets
Admiral Markets offers professional traders the ability to trade with a custom, upgraded version of MetaTrader 5, allowing you to experience trading at a significantly higher, more rewarding level. Experience benefits such as the addition of the Market Heat Map, so you can compare various currency pairs to see which ones might be lucrative investments, access real-time trading data, and so much more. Click the banner below to start your FREE download of MT5 Supreme Edition!
Disclaimer: The given data provides additional information regarding all analysis, estimates, prognosis, forecasts or other similar assessments or information (hereinafter “Analysis”) published on the website of Admiral Markets. Before making any investment decisions please pay close attention to the following:
This is a marketing communication. The analysis is published for informative purposes only and are in no way to be construed as investment advice or recommendation. It has not been prepared in accordance with legal requirements designed to promote the independence of investment research, and that it is not subject to any prohibition on dealing ahead of the dissemination of investment research.
Any investment decision is made by each client alone whereas Admiral Markets shall not be responsible for any loss or damage arising from any such decision, whether or not based on the Analysis.
Each of the Analysis is prepared by an independent analyst (Jens Klatt, Professional Trader and Analyst, hereinafter “Author”) based on the Author’s personal estimations.
To ensure that the interests of the clients would be protected and objectivity of the Analysis would not be damaged Admiral Markets has established relevant internal procedures for prevention and management of conflicts of interest.
Whilst every reasonable effort is taken to ensure that all sources of the Analysis are reliable and that all information is presented, as much as possible, in an understandable, timely, precise and complete manner, Admiral Markets does not guarantee the accuracy or completeness of any information contained within the Analysis. The presented figures refer that refer to any past performance is not a reliable indicator of future results.
The contents of the Analysis should not be construed as an express or implied promise, guarantee or implication by Admiral Markets that the client shall profit from the strategies therein or that losses in connection therewith may or shall be limited.
Any kind of previous or modeled performance of financial instruments indicated within the Publication should not be construed as an express or implied promise, guarantee or implication by Admiral Markets for any future performance. The value of the financial instrument may both increase and decrease and the preservation of the asset value is not guaranteed.
The projections included in the Analysis may be subject to additional fees, taxes or other charges, depending on the subject of the Publication. The price list applicable to the services provided by Admiral Markets is publicly available from the website of Admiral Markets.
Leveraged products (including contracts for difference) are speculative in nature and may result in losses or profit. Before you start trading, you should make sure that you understand all the risks.