Royalty Company Focuses on Project Generation

By The Gold Report

Source: Maurice Jackson for Streetwise Reports   07/24/2019

In this interview with Maurice Jackson of Proven and Probable, the president and CEO of this royalty generator describes the business model and outlook for his firm.

Maurice Jackson: Joining us for a conversation is David Cole of EMX Royalty Corp. (EMX:TSX.V; EMX:NYSE.American), the royalty generator. Mr. Cole, welcome to the show.

David Cole: Thank you, Maurice, always my pleasure.

Maurice Jackson: Always a delight to have EMX Royalty back on our program. Mr. Cole, we have a number of topics to address today, but before we begin, please introduce us to EMX Royalty, and the opportunity you present to the market.
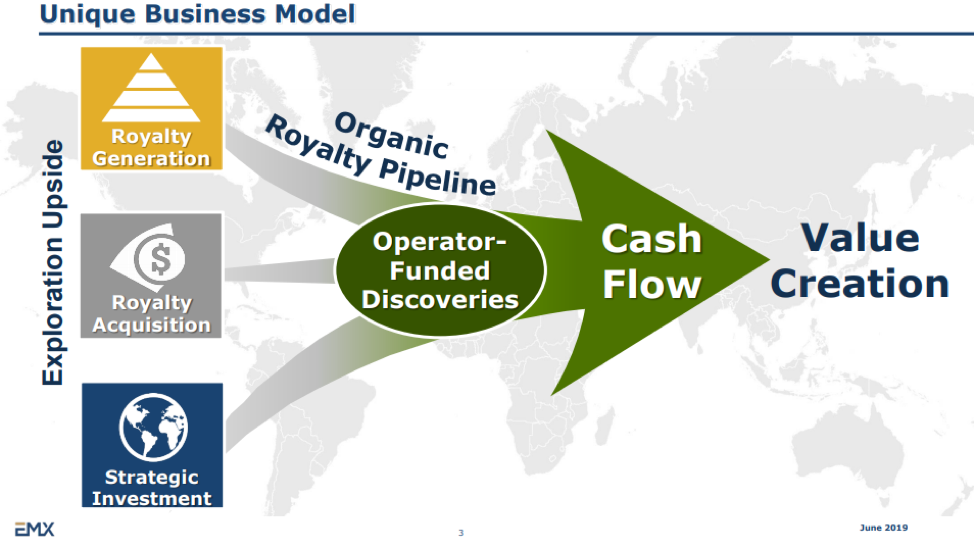
David Cole: You know what, Maurice? It really boils down to the fact that royalties are phenomenal financial instruments that provide optionality of commodity products movements into the future, as well as discovery optionality as those projects are advanced with counterparty funding. And the royalty holder benefits from that without experiencing the risks and the financial burden of investing in those assets.

So we’d love to own royalties, and at EMX Royalty, we accumulate royalties. We do that through the prospect generation process, by acquiring prospective mineral rights and selling them on, and keeping royalties on those assets, in addition to outright buying royalties and royalty portfolios. We’ve been doing this for a decade and a half. We have royalties around the world.

Maurice Jackson: Let’s begin today’s discussion on the EMX Property Bank. In the past 18 months, EMX has sold or partnered off an unprecedented 30 properties, which is far more than any other company in the sector during this time period. How has EMX been able to accomplish this when so many other companies have a hard time partnering any of their properties at all?
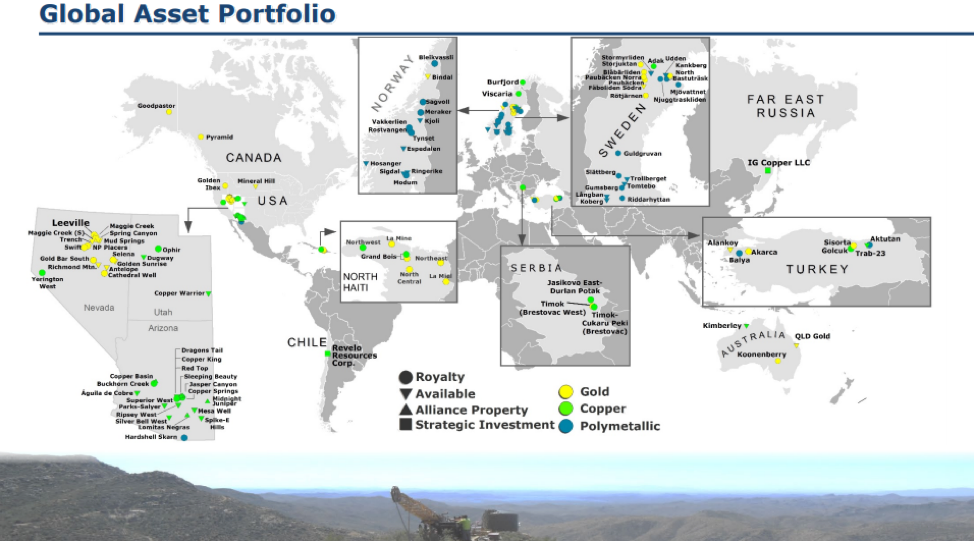
David Cole: I believe that is an excellent number: We’re very proud of that number. The number of projects that we sell in a year is a key performance indicator (KPI) that we track here. It’s one of the things that drives us. It’s an indicator of our success in the organic growth of the company.

I would attribute the success to the quality of the team, but specifically to their entrepreneurial spirit and to their geological acumen. It’s just entrepreneurial juice combined with geological acumen. These guys are top-notch economic geologists who know how to go out and find and acquire prospective mineral rights, [and] add value by building economic geologic models.

[They can also] present that to an industry that’s hungry for prospect of mineral rights, and get those projects sold. We focus on everything from the early-stage generative work to paper in the final deal and negotiating the terms, and everything in between. We’ve been doing this for a long time, and it’s a good business.

Maurice Jackson: Last year, EMX hit a grand slam with the sale of the project in Russia. How does EMX Royalty expect to allocate the cash realized from the sale of the Malmyzh project? I want to know, specifically, how much cash will be allocated to property acquisition; how much to royalty acquisition? And how much is going to be applied to general and administrative (G&A) expense?

David Cole: Yeah, I get asked this question often. The bulk of our G&A includes the salary for the smart geologists around the world doing the generative work. And the bulk of the funding for the generative work all comes from current income coming in from advanced minimum royalty payments, production royalty payments, lease payments, share payments tied to property deals—all the different ways that we generate income.

The super majority of the money that we have in the bank that’s resulted from the success in Russia is intended to be allocated toward cash-flowing royalties or streams. That’s a key focus of ours right now. We’re in an enviable position to have a substantial treasury. It’s over CA$70 million in the bank, no debt.

We’re being shown a plethora of opportunities, and we have the fail-fast team. [A] team of engineers and geologists and finance people and a great attorney are working through the opportunities that we’re being shown and quickly failing the ones that don’t meet our filter. It’s all about astute allocation of capital.

So, to specifically answer your question, the bulk of our ongoing business expanse in the organic growth that built this company is paid through the ongoing income streams that we have. And the money in the bank is earmarked for purchase of additional new cash flowing royalties and streams.

Maurice Jackson: How many projects are in the Property Bank?
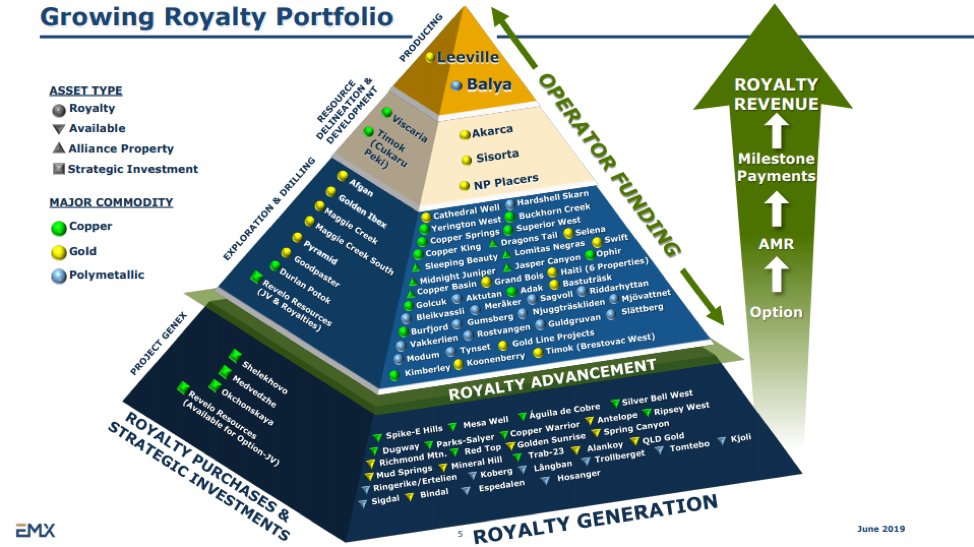
David Cole: We have over 90. It’s got to be getting close to 100.

Maurice Jackson: How many active royalties does EMX have?

David Cole: Sixty-five.

Maurice Jackson: Let’s look at some numbers. Mr. Cole, please provide us with the current capital structure for EMX Royalty.
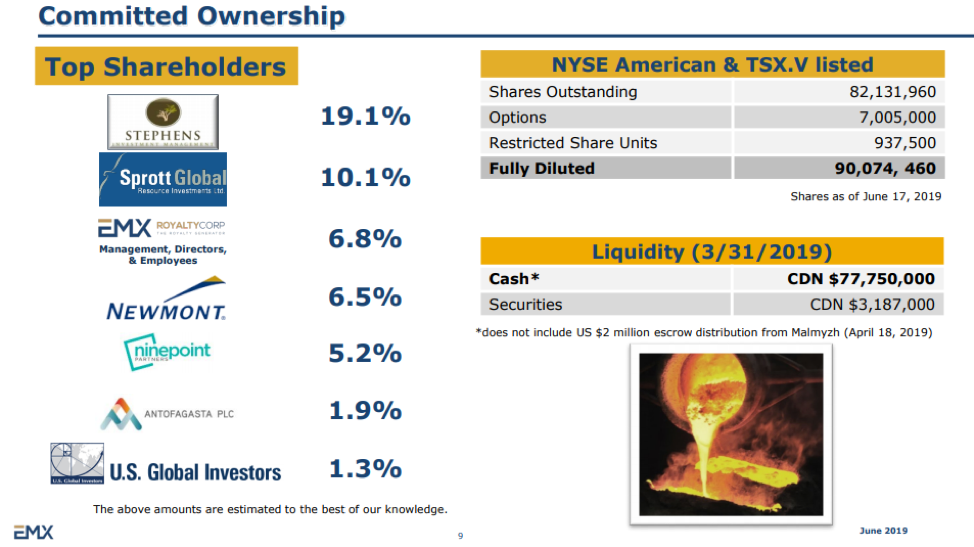
David Cole: We’ve been able to keep it quite tight over the years. It’s been a business for a decade and a half, 82 million shares issued and outstanding, 90 million fully diluted. Over CA$70 million in the bank, no debt.

Maurice Jackson: I’ve also noticed here, in the last a week or two, increased volume activity. What do you attribute that to?

David Cole: Smart money buying the stock.

Maurice Jackson: Couldn’t agree with you more than on that one, sir.

David Cole: Yeah, we know that to be the case.

Maurice Jackson: Multilayered question: Looking forward, what is the next unanswered question for EMX Royalty? When can we expect a response, and what determines success?

David Cole: Success is continued cash-flow growth, and that’s going to come from two places, Maurice. It’s going to come from organic growth of the existing portfolio as these assets move forward and continue to increase their cash flow. I’m very bullish about the existing portfolio. And it will come from the purchase of new cash-flowing assets from our treasury.

Maurice Jackson: Where do you see EMX Royalty in one year and in five years?

David Cole: Within five years, we should be half a billion to a billion-dollar company. And with substantial cash flow that will justify that market capitalization. I don’t intend for that to happen simply by willy-nilly issuing shares. We intend for that to happen through astute allocation of the capital that we have in the bank and continued growth emanating from the optionality of our existing portfolio.

Maurice Jackson: Does a sustained gold price of $1,400/ounce or above $1,400, I should say, change any strategies for EMX?

David Cole: For the most part, within the metal space we’re commodity agnostic, and we try not to get caught up in short-term moves in metal price. This is a long-term game. We believe that in the long-haul prospective, mineral rights go up in value. And we think that copper and gold are great commodities.

We’re happy to be in lead, zinc and silver as well. We’re happy to have exposure to cobalt and nickel—all good metals to have. But we don’t substantially change our strategy based upon a small or a large move in metal price.

We stay the course, acquire prospective mineral rights, add value by building economic geologic models, [and then] sell those on to an industry that’s hungry to acquire prospective mineral rights. And we always keep a royalty.

Maurice Jackson: Last question, sir. What did I forget to ask?

David Cole: It’s always fun to talk about one of the key projects that’s advanced in the portfolio. We could talk about the royalty on the Timok Project, which we’ve talked about before. That’s a company maker that’s embedded in the portfolio.
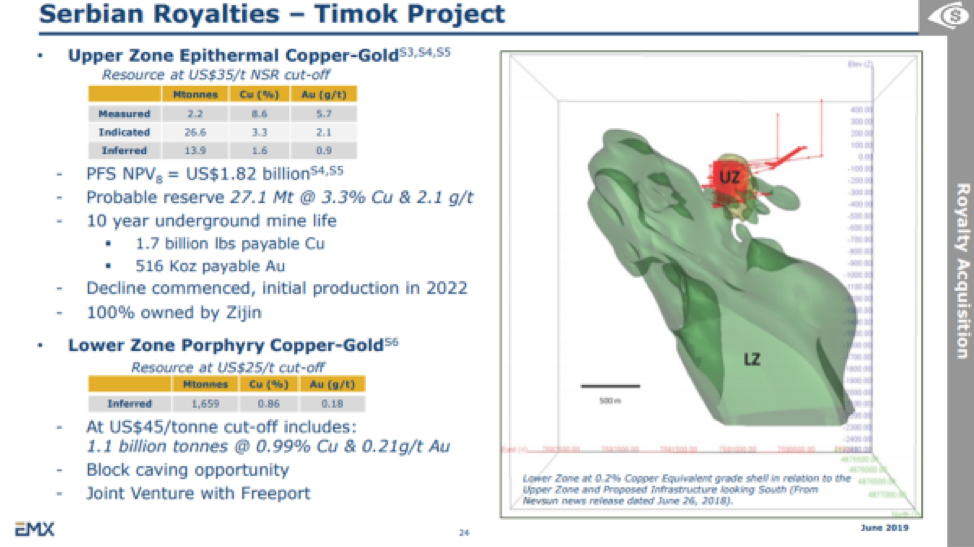
We’re very excited as that one continues to produce great results. They’re advancing the decline to develop the underground infrastructure to start production on that property in 2022. We’ve heard some rumors that they’re talking about actually bringing that into 2021, but let’s say 2022 for now.

Another property that we’re very excited about is one [where] the counterparty is South32 Ltd. (S32:ASX) and it’s advancing the big Taylor lead/zinc/silver discovery in Arizona. We have a 2% royalty on a nice claim block that is the full extension. And the mineralization, high-grade mineralization, is completely open-ended onto our property and we’re very bullish about that one.
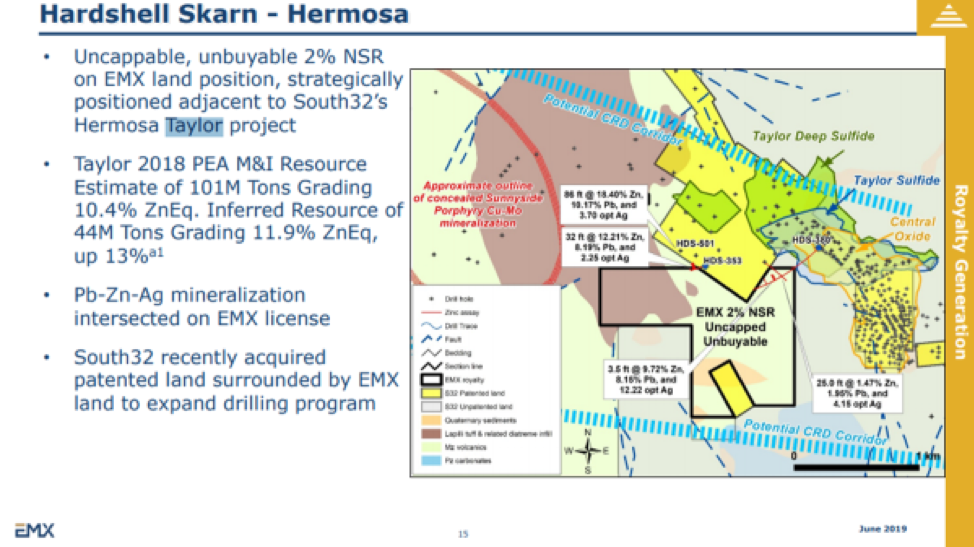
I’m hoping that we’ll see some strong drill results emanating from that project in the near future. South32 is a great operator, happy to have a key asset developing from our portfolio. It’s just a great example of the optionality embedded in our royalty portfolio, with dozens of counterparties out there working and spending money on our assets, not to our account, only to our benefit. The discovery that’s eminent on the Taylor extension property is a great example of that.

Maurice Jackson: Mr. Cole, if investors want to get more information on EMX Royalty, please share the website address.

David Cole: Emxroyalty.com.

Maurice Jackson: For direct inquiries, contact Scott Close at (303) 973-8585or you may e-mail [email protected]. EMX Royalty trades on the TSX.V: EMX|NYSE: EMX.

Just for the record, for every bullion purchase I make this year, I’m matching with shares in EMX Royalty. EMX Royalty is a sponsor of Proven and Probable, and we are proud shareholders for the virtues conveyed in today’s message.

As a reminder, I’m a licensed representative for Miles Franklin Precious Metals Investments. But we provide a number of options to expand your precious metals portfolio from physical delivery, off shore depositories, precious metal IRAs, and private blockchain-distributed ledger technology.

Call me directly at (855) 505-1900 or you may email [email protected]. Finally, we invite you to visit provenandprobable.com, where we provide Mining Insights and Bullion Sales.

David Cole of EMX Royalty, thank you for joining us today on Proven and Probable.

Maurice Jackson is the founder of Proven and Probable, a site that aims to enrich its subscribers through education in precious metals and junior mining companies that will enrich the world.

Sign up for our FREE newsletter at: www.streetwisereports.com/get-news

Disclosure:
1) Maurice Jackson: I, or members of my immediate household or family, own shares of the following companies mentioned in this article: EMX Royalty. I personally am, or members of my immediate household or family are, paid by the following companies mentioned in this article: None. My company has a financial relationship with the following companies mentioned in this article: EMX Royalty is a sponsor of Proven and Probable. Proven and Probable disclosures are listed below.
2) The following companies mentioned in this article are billboard sponsors of Streetwise Reports: None. Click here for important disclosures about sponsor fees.
3) Statements and opinions expressed are the opinions of the author and not of Streetwise Reports or its officers. The author is wholly responsible for the validity of the statements. The author was not paid by Streetwise Reports for this article. Streetwise Reports was not paid by the author to publish or syndicate this article. The information provided above is for informational purposes only and is not a recommendation to buy or sell any security. Streetwise Reports requires contributing authors to disclose any shareholdings in, or economic relationships with, companies that they write about. Streetwise Reports relies upon the authors to accurately provide this information and Streetwise Reports has no means of verifying its accuracy.
4) This article does not constitute investment advice. Each reader is encouraged to consult with his or her individual financial professional and any action a reader takes as a result of information presented here is his or her own responsibility. By opening this page, each reader accepts and agrees to Streetwise Reports’ terms of use and full legal disclaimer. This article is not a solicitation for investment. Streetwise Reports does not render general or specific investment advice and the information on Streetwise Reports should not be considered a recommendation to buy or sell any security. Streetwise Reports does not endorse or recommend the business, products, services or securities of any company mentioned on Streetwise Reports.
5) From time to time, Streetwise Reports LLC and its directors, officers, employees or members of their families, as well as persons interviewed for articles and interviews on the site, may have a long or short position in securities mentioned. Directors, officers, employees or members of their immediate families are prohibited from making purchases and/or sales of those securities in the open market or otherwise from the time of the interview or the decision to write an article until three business days after the publication of the interview or article. The foregoing prohibition does not apply to articles that in substance only restate previously published company releases. As of the date of this article, officers and/or employees of Streetwise Reports LLC (including members of their household) own securities of Millrock Resources and EMX Royalty, companies mentioned in this article.

Proven and Probable LLC receives financial compensation from its sponsors. The compensation is used is to fund both sponsor-specific activities and general report activities, website, and general and administrative costs. Sponsor-specific activities may include aggregating content and publishing that content on the Proven and Probable website, creating and maintaining company landing pages, interviewing key management, posting a banner/billboard, and/or issuing press releases. The fees also cover the costs for Proven and Probable to publish sector-specific information on our site, and also to create content by interviewing experts in the sector. Monthly sponsorship fees range from $1,000 to $4,000 per month. Proven and Probable LLC does accept stock for payment of sponsorship fees. Sponsor pages may be considered advertising for the purposes of 18 U.S.C. 1734.

The Information presented in Proven and Probable is provided for educational and informational purposes only, without any express or implied warranty of any kind, including warranties of accuracy, completeness, or fitness for any particular purpose. The Information contained in or provided from or through this forum is not intended to be and does not constitute financial advice, investment advice, trading advice or any other advice. The Information on this forum and provided from or through this forum is general in nature and is not specific to you the User or anyone else. You should not make any decision, financial, investments, trading or otherwise, based on any of the information presented on this forum without undertaking independent due diligence and consultation with a professional broker or competent financial advisor. You understand that you are using any and all Information available on or through this forum at your own risk.

Images provided by the author.

( Companies Mentioned: EMX:TSX.V; EMX:NYSE.American,
)

Technical analysis 26.07.2019 (EURUSD, GBPUSD, USDCHF, USDJPY, AUDUSD, USDRUB, GOLD, BRENT)

Article By RoboForex.com

EURUSD

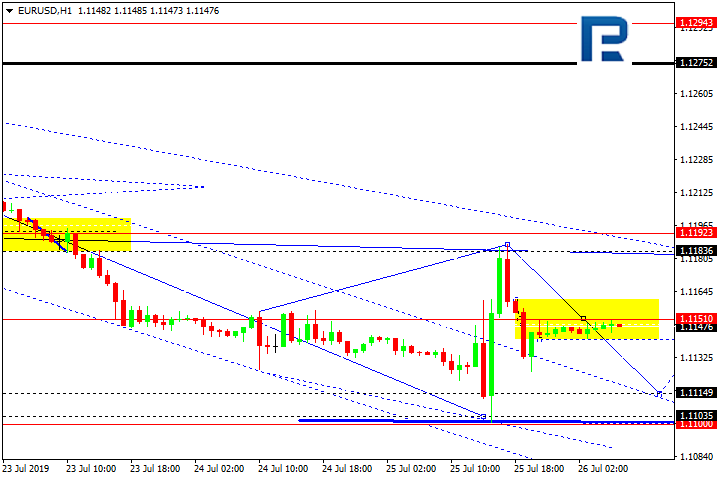
The pair has reached the goal of the declining matrix at 1.1104 and performed a correction, returning to 1.1184. At the moment the market is trading in another declining wave. Today hitting 1.1115 looks possible. Then a correction to 1.1150 may follow, then – a decline to 1.1104. Upon breaking this level, the trend may continue to 1.1072.

EURUSD
Risk Warning: the result of previous trading operations do not guarantee the same results in the future

GBPUSD

The instrument has broken 1.2463 downwards. There is potential for declining to 1.2430.Then growth to 1.2463 is expected, followed by a decline to 1.2406.

GBPUSD
Risk Warning: the result of previous trading operations do not guarantee the same results in the future

USDCHF

The pair has gone through a growing matrix and its correction. The market is trading under pressure for growth today. A consolidation range has formed around 0.9905. Upon breaking it upwards, a rise to 0.9942 may become possible. The goal is local.

USDCHF
Risk Warning: the result of previous trading operations do not guarantee the same results in the future

USDJPY

The instrument has undergone growth and extension to 108.67. At the moment the market is trading inside the consolidation range. Today the price may decline, break through the ascending channel and start another declining wave, aiming at 107.94. The goal is first.

USDJPY
Risk Warning: the result of previous trading operations do not guarantee the same results in the future

AUDUSD

The pair has reached the main goal of the declining wave. Keeping in mind the breakaway of the matrix channel, practically, today it may keep declining along the trend to 0.6911. The goal is local.

AUDUSD
Risk Warning: the result of previous trading operations do not guarantee the same results in the future

USDRUB

The pair has completed two impulses of decline. Today we are considering the possibility of development of a third impulse of decline to 62.72, followed by growth to 63.15, then a decline to 62.25.

USDRUB
Risk Warning: the result of previous trading operations do not guarantee the same results in the future

GOLD

Gold is trading under pressure for decline. The market has broken through 1416.83 top down. At the breakaway a consolidation range has formed. This scenario confirms the development of the third wave of growth. The goal is at 1400.00. After that a correction to 1416.80 is possible.

GOLD
Risk Warning: the result of previous trading operations do not guarantee the same results in the future

BRENT

Oil has formed a consolidation range above 62.95. Upon breaking it downwards, a decline to 61.70 seems possible. The goal is local. Upon escaping upwards, the trend may continue to 65.60.

BRENT

Article By RoboForex.com

Attention!
Forecasts presented in this section only reflect the author’s private opinion and should not be considered as guidance for trading. RoboForex LP bears no responsibility for trading results based on trading recommendations described in these analytical reviews.

Energy Sets Up Two New Trades – Here They Are

By TheTechnicalTraders.com

Before we discuss these incredible trade setups in the Energy sector, we have to discuss the continued shifting global economy and how that relates to these setups.  Nearly three weeks ago, we posted a research article suggesting Crude Oil would call to levels near $50 over the next 30+ days, then stall for about 45 days before falling further and potentially attempting new lows near $40 ppb.  It is important to understand certain aspects of the global economy, economic demand and how it relates to seasonal patterns for Energy.

We believe the move lower is Crude Oil is related to a supply glut that continues to plague the global markets while global economic trade, shipping, and activity continue to weaken.  Too much oil supply with weakening global economic activity means Crude Oil will likely waffle lower until this dynamic changes.

Please read our recent research post to know where Crude Oil is likely to head next. Also this crude oil, prediction uses our oil price DNA algorithm to show us the future price range of oil.

Other energy-related symbols, like Natural Gas and ERY, are set up for a different type of price move.

The reality of the situation is that once Crude Oil reaches to levels near $50 ppb, it is very likely that a support level will push Crude back higher (as we suggest in our research) which will align with a seasonal pattern for Natural Gas and early Winter demand for heating oil.  September, October, and November are typically a ramp-up period for winter demand and end of year holiday travel.  People tend to take advantage of the last bit of Summer to seek out vacation spots, prepare for winter and push the cold back as long as possible.

Future contracts may move higher, in preparation of this seasonal trend, many months before the season actually starts.  This is the reason we believe the energy sector is setting up some incredible opportunities for skilled technical traders.

The weekly chart of Natural Gas

This first Weekly chart of Natural Gas highlights a basing pattern that we’ve been following for months.  We believe any move below $2.30 is a strong bottoming/basing setup for skilled traders and our predictive modeling systems suggest we are just weeks (3 to 5+) away from a big upside move in NG.

We believe natural gas will continue to fall and base. Once a bottom has been made the upside potential for NG over the next 60+ days is quite substantial.  We believe an in initial upside move after it bottoms will be to levels above $3.15 will take place before October 10 and that potential for an extreme breakout upside move above $4.00 is quite likely before the end of November 2019.

Please read this article to learn more about our research into NG and the opportunities that are setting up now.  Also, this post we shared Natural Gas Moves Into Basing Zone.

ERY – Bear Energy Sector Chart

Keeping in mind that the setup within the energy sector is two-fold.  First, Oil and NG will continue to fall and base/bottom (moving slightly lower over the next few weeks).  This is why ERY is such a great setup right now.  Any breakdown in energy commodity prices over the next 3~5 weeks will push ERY 15% to 25% higher from current levels – which is exactly what we are expecting to happen.

Then, as Crude Oil and Natural Gas base in their support zones, ERY will peak which is when we want to pull profits from ERY and watch other bullish energy ETFs for long side setups.

From current levels, we believe ERY will target $50 to $52.50 fairly quickly as Crude Oil and NG continue to move lower and setup a momentum base within the basing zone/support range.  Remember Crude Oil should move to levels near $50 (a full 10% lower than current price levels) before basing.

Concluding Thoughts:

As we’ve been suggesting for months, 2019 and 2020 are setting up to be incredible years for skilled technical traders.  These moves in commodities, energy, and metals are providing us with trade after trade of 10%, 20% or more.  Almost every month, the markets are setting up 10 to 15+ incredible trading opportunities and all we have to do is time our entries and run these trades as we do any other trade. Not all trade setups are the kind we like and we only enter the ones that we think have the highest opportunity and lowest risk.

Get ready because these incredible setups in Metals and Energy should keep you busy pulling the trigger to create profits over the next 5+ months or longer with my  Wealth Building & Global Financial Reset Newsletter

Join me with a 1 or 2-year subscription to lock in the lowest rate possible and ride my coattails as I navigate these financial market and build wealth while others lose nearly everything they own during the next financial crisis.

Join Now and Get a 1oz Silver Round or Gold Bar Shipped To You Free. Follow our research and visit www.TheTechnicalTraders.com to learn how we can help you find and execute better trades.

Chris Vermeulen
Technical Traders Ltd.


Fibonacci Retracements Analysis 26.07.2019 (Bitcoin, Ethereum)

Article By RoboForex.com

Bitcoin

On H4 the currency is completing a short-term pullback and starting a new wave of decline. If the quotations manage to break through the local minimum 9098.90, further decline may be aimed at 50.0% (8600.00) and 61.8% (7370.00) Fibo. The resistance is at 23.6% (11380.00).

BTCUSD
Risk Warning: the result of previous trading operations do not guarantee the same results in the future

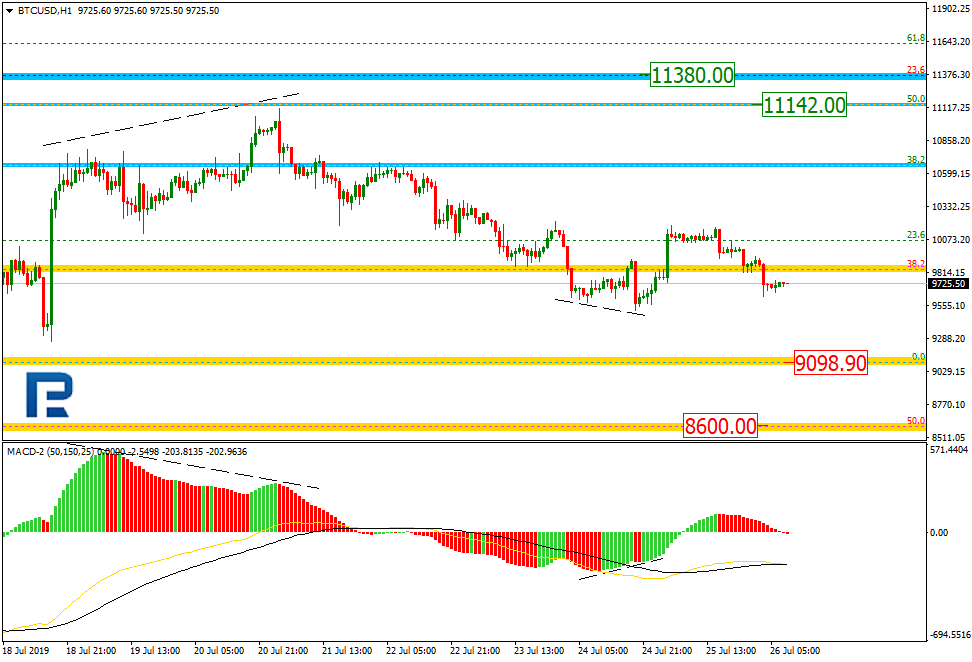
On H1 we can see that after a convergence the market is trying to develop a wave of growth towards 50.0% (11142.00) Fibo. However, the main trend is still descending.

BITCOIN
Risk Warning: the result of previous trading operations do not guarantee the same results in the future

Эфириум (Ethereum)

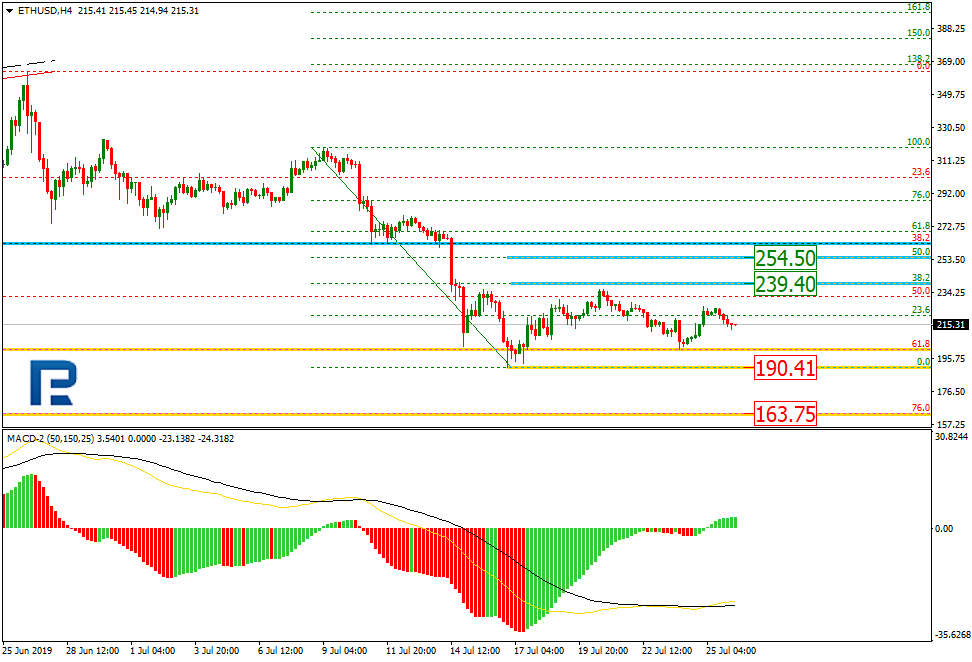
On H4 the ETH demonstrates a correction period upon reaching 61.8% Fibo. The correcting wave of growth failed to reach 38.2% (239.40) Fibo However, the next wave of growth may do it and rise to 50.0% (254.50). Upon completing the correction a breakaway of the minimum and a decline to 76.0% (163.75) may follow.

ETHUSD
Risk Warning: the result of previous trading operations do not guarantee the same results in the future

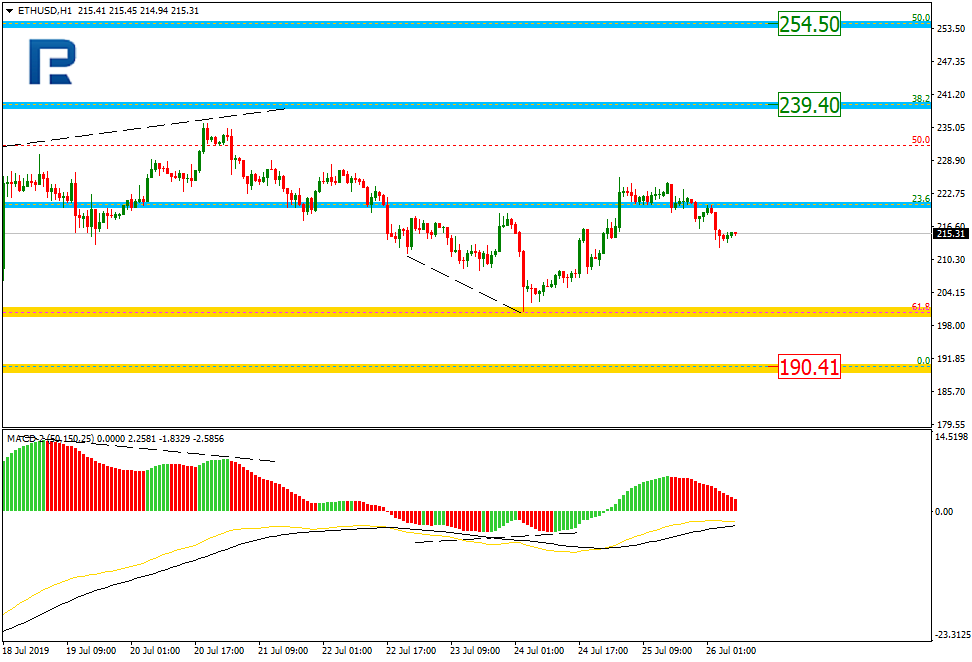
On H1 we may see that, after a convergence, an impulse of growth has formed, which may develop into an uptrend to the target levels.

ETHEREUM
Risk Warning: the result of previous trading operations do not guarantee the same results in the future

Article By RoboForex.com

Attention!
Forecasts presented in this section only reflect the author’s private opinion and should not be considered as guidance for trading. RoboForex LP bears no responsibility for trading results based on trading recommendations described in these analytical reviews.

Investors Assess the ECB Meeting Results

by JustForex

The US dollar is changing slightly against a basket of major currencies. The US dollar index (#DX) closed with a slight increase (+0.07%). Yesterday, optimistic economic data from the US were published. Thus, core durable goods orders rose by 1.2% in June instead of the forecasted growth by 0.2%. Initial jobless claims decreased to 206K instead of 220K.

At the same time, the euro strengthened against the US currency after the ECB decided on the interest rate. Thus, the regulator left the key marks of monetary policy unchanged. In addition, the ECB has changed its forecast for the further course of rate. It is expected that key rates will remain at the same level or will be lower at least until the end of the first half of 2020, or until inflation in the Eurozone returns to the 2% level.

The “black gold” prices continue to rise. At the moment, futures for the WTI crude oil are testing the mark of $56.30 per barrel.

Market Indicators

Yesterday, aggressive sales were observed in the US stock markets: #SPY (-0.48%), #DIA (-0.45%), #QQQ (-0.95%).

The 10-year US government bonds yield has been growing. Currently, the indicator is at the level of 2.07-2.08%.

The news feed for 2019.07.26:

– GDP data in the US at 15:30 (GMT+3:00).

by JustForex

EUR/USD bears find new fuel thanks to the ECB – 1.1100 in focus

By Admiral Markets

Source: Economic Events July 26, 2019 – Admiral Markets’ Forex Calendar

After the ECB rate decision yesterday, and the Fed rate decision coming up next Wednesday, we want to focus today on the EUR/USD.

The currency pair saw a drop over the last few days, and went for a test of its current yearly lows after the ECB statement was released.

While the ECB kept interest rates unchanged, it adjusted its forward guidance in a way which allows rate cuts, but also rate tiering (to relieve pressure on European banks resulting out of a collapse in yields) and QE in the near-term.

In addition to that, the mentioning of inflationary pressures which have been persistently below levels that are in line with the central bank’s aim (note: 2%), and as long as that’s the case, the ECB will adjust all of its instruments as appropriate.

With that said, further monetary stimulus should be expected, coming probably in September, with the European Central Bank lowering interest rates into negative territory. So, the already expected rate cut from the Fed next Wednesday will most likely not trigger a sharp reversal in the EUR/USD.

This is especially true if today’s US GDP Growth Rate data comes in better than the expected 1.8%. After the solid Retail Sales data on July 16 (which saw a print of 0.4% against the expected 0.1%), and knowing that Retail Sales account for around 30% of the GDP, a better-than-expected US GDP print is a serious option and could trigger some USD strength if it results in an “out-pricing” of a fourth rate cut in 2019 in the Fed Watch Tool.

Technically, we carefully watch the region around 1.1180/1200 as a potential Short-trigger, against which a sustainable break below 1.1100 could be anticipated. The outlook on H4 stays clearly bearish as long as we trade below 1.1280/1300:

Source: Admiral Markets MT5 with MT5-SE Add-on EUR/USD 4-hour chart (between June 11, 2018, to July 25, 2019). Accessed: July 25, 2019, at 10:00pm GMT – Please note: Past performance is not a reliable indicator of future results, or future performance.

Source: Admiral Markets MT5 with MT5-SE Add-on EUR/USD Daily chart (between April 20, 2018, to July 19, 2019). Accessed: July 19, 2019, at 10:00pm GMT – Please note: Past performance is not a reliable indicator of future results, or future performance.

In 2014, the value of the EUR/USD fell by 11.9%, in 2015, it fell by 10.2%, in 2016, it fell by 3.2%, in 2017, it increased by 13.92%, 2018, it fell by 4.4%, meaning that after five years, it was down by 16.5%.

Investing in Forex with Admiral Markets

Admiral Markets offers professional traders the ability to trade with a custom, upgraded version of MetaTrader 5, allowing you to experience trading at a significantly higher, more rewarding level. Experience benefits such as the addition of the Market Heat Map, so you can compare various currency pairs to see which ones might be lucrative investments, access real-time trading data, and so much more. Click the banner below to start your FREE download of MT5 Supreme Edition!

Download MetaTrader 5 and begin trading today!

Disclaimer: The given data provides additional information regarding all analysis, estimates, prognosis, forecasts or other similar assessments or information (hereinafter “Analysis”) published on the website of Admiral Markets. Before making any investment decisions please pay close attention to the following:

  1. This is a marketing communication. The analysis is published for informative purposes only and are in no way to be construed as investment advice or recommendation. It has not been prepared in accordance with legal requirements designed to promote the independence of investment research, and that it is not subject to any prohibition on dealing ahead of the dissemination of investment research.
  2. Any investment decision is made by each client alone whereas Admiral Markets shall not be responsible for any loss or damage arising from any such decision, whether or not based on the Analysis.
  3. Each of the Analysis is prepared by an independent analyst (Jens Klatt, Professional Trader and Analyst, hereinafter “Author”) based on the Author’s personal estimations.
  4. To ensure that the interests of the clients would be protected and objectivity of the Analysis would not be damaged Admiral Markets has established relevant internal procedures for prevention and management of conflicts of interest.
  5. Whilst every reasonable effort is taken to ensure that all sources of the Analysis are reliable and that all information is presented, as much as possible, in an understandable, timely, precise and complete manner, Admiral Markets does not guarantee the accuracy or completeness of any information contained within the Analysis. The presented figures refer that refer to any past performance is not a reliable indicator of future results.
  6. The contents of the Analysis should not be construed as an express or implied promise, guarantee or implication by Admiral Markets that the client shall profit from the strategies therein or that losses in connection therewith may or shall be limited.
  7. Any kind of previous or modeled performance of financial instruments indicated within the Publication should not be construed as an express or implied promise, guarantee or implication by Admiral Markets for any future performance. The value of the financial instrument may both increase and decrease and the preservation of the asset value is not guaranteed.
  8. The projections included in the Analysis may be subject to additional fees, taxes or other charges, depending on the subject of the Publication. The price list applicable to the services provided by Admiral Markets is publicly available from the website of Admiral Markets.
  9. Leveraged products (including contracts for difference) are speculative in nature and may result in losses or profit. Before you start trading, you should make sure that you understand all the risks.

By Admiral Markets

EUR Stabilizes After Wild Session Yesterday

By Orbex

US GDP Due Today

USD has softened slightly following yesterday’s rally with the index currently sitting just below yesterday’s highs. Looking ahead to the final US session of the week, traders are waiting on the release of the Q2 GDP. This is forecast to have ticked down to 1.8% from the prior 3.1%. With traders widely expecting the Fed to cut rates next week, a print in this region will likely be bearish for USD.

ECB Signals Rate Cuts To Come

EURUSD has had a much more subdued session today following a bout of extreme volatility yesterday in response to the ECB meeting. We had expected the central bank to announce fresh easing measures, in line with recent commentary.

However, bears were left disappointed as the bank kept policy unchanged at current levels. The ECB did, however, signal that a rate cut would likely be necessary in the coming months. They also noted that the staff is discussing the use of other options. EURUSD trades 1.1136 last, sitting just above the 1.1130 support which was broken yesterday.

GBP Down Again

GBPUSD has been under pressure again this morning as the fallout from the announcement of Boris Johnson as the new UK PM continues. With Johnson’s appointment comes the increased risk of a no-deal Brexit which is weighing on GBP. GBPUSD trades 1.2431 last, having broken slightly below the 1.2439 support.

SPX500 Recovers Yesterday’s Losses

Risk assets have been firmer today. SPX500 is trading back up to 3015.43 last following yesterday’s meltdown which saw price breaking below the 2999.98 level briefly. The potential for easing in Europe along with expectations of easing next week by the Fed is keeping equities well supported. This theme is likely to continue in the near term given the dire outlooks from both the Fed and the ECB.

Gold & JPY Down

Safe havens have had a softer session so far. Both gold and JPY are down against USD as equities continue to recover. XAUUSD trades 1418.67 last as the latest rejection from the 1433.04 level continues. USDJPY trades 108.64 last with price remaining capped by the 108.77 level for now.

Crude Still Supported

Oil prices remain supported on the final trading day of the week. The EIA reported a further drawdown in US crude stores last week with inventories declining by 10.8 million barrels. This marks the sixth consecutive weekly drawdown in US crude stores. And, with US crude production having also dropped, this is helping assuage concerns over the demand outlook. Crude trades 56.51 last with price remaining supported by the 55.79 level.

High Betas Beaten Down

USDCAD continues to rally hard today. Yesterday, price broke out above the 1.3145 level which has been capping price over recent weeks. Despite firmer oil price, CAD has been under pressure. However, there is the risk of a reversal next week depending on the actions and outlook of the Fed.

AUDUSD has sold off sharply again today, marking its sixth consecutive day of losses as the reversal from the test of the bearish trend line continues. Price is now back firmly below the .70 level putting focus on a reversal back down to the .6865 level next.

By Orbex


The Analytical Overview of the Main Currency Pairs on 2019.07.26

by JustForex

The EUR/USD currency pair

Technical indicators of the currency pair:
  • Prev Open: 1.11408
  • Open: 1.11461
  • % chg. over the last day: +0.04
  • Day’s range: 1.11424 – 1.11509
  • 52 wk range: 1.1111 – 1.2009

Yesterday, EUR/USD had high trading activity and volatility were observed. The ECB, as expected, kept the main parameters of monetary policy at the same level. The trading instrument retreated from two-month lows, disappointing some market participants who made a weakening bet. The head of the Central Bank, Mario Draghi, said that the interest rates would remain at or below the level until at least the end of the first half of 2020. At the moment, the EUR/USD quotes are consolidating in the range of 1.11300-1.11550. Today, investors will evaluate important statistics from the United States. Positions must be opened from these marks.

At 15:30 (GMT+3:00) the US will publish a GDP report.

EUR/USD

Indicators do not give accurate signals: the price crossed 50 MA and 100 MA.

The MACD histogram is near 0.

The Stochastic Oscillator is in the neutral zone, the %K line crossed the %D line. There are no signals at the moment.

Trading recommendations
  • Support levels: 1.11300, 1.11000
  • Resistance levels: 1.11550, 1.11850, 1.12100

If the price consolidates below 1.11300, expect a further devline toward 1.11000-1.10800.

Alternatively, the quotes can correct toward 1.12000.

The GBP/USD currency pair

Technical indicators of the currency pair:
  • Prev Open: 1.24828
  • Open: 1.24440
  • % chg. over the last day:-0.24
  • Day’s range: 1.24257 – 1.24596
  • 52 wk range: 1.2397 – 1.3385

The bearish mood prevails on the GBP/USD currency pair. During yesterday’s and today’s trading, the drop in quotes exceeded 50 points. The pound has updated local lows. At the moment, the key range is 1.24200-1.24550. GBP/USD quotes have the potential to further decline. Investors are concerned about the “tough” Brexit scenario. Today, financial market participants will evaluate the US GDP report. We recommend to open positions from key levels.

The news background on the UK economy is calm.

GBP/USD

Indicators of accurate signals do not give: 50 MA crossed 100 MA.

The MACD histogram is in the negative zone and continues to decline, indicating a drop in GBP/USD quotes.

The Stochastic Oscillator is in the oversold zone, the %K line crossed the %D line. There are no signals at the moment.

Trading recommendations
  • Support levels: 1.24200, 1.23850
  • Resistance levels: 1.24550, 1.24900, 1.25200

If the price consolidates below 1.24200, expect a further descend toward 1.23850-1.23600.

Alternatively, the price will grow toward 1.24800-1.25000.

The USD/CAD currency pair

Technical indicators of the currency pair:
  • Prev Open: 1.31395
  • Open: 1.31556
  • % chg. over the last day: +0.14
  • Day’s range: 1.31528 – 1.31683
  • 52 wk range: 1.2727 – 1.3664

The USD/CAD currency pair has once again shifted to growth. CAD updated local maxima. At the moment, the USD/CAD quotes are consolidating near the resistance level of 1.31700. 1.31450 is already a “mirror” support. Trading instrument has the potential for further growth. Financial market participants expect a report on US GDP. We also recommend to pay attention to the dynamics of oil prices. Positions must be opened from key levels.

The Economic News Feed for 26.07.2019 is calm.

USD/CAD

Indicators indicate the strength of buyers: the price has fixed above 50 MA and 100 MA.

The MACD histogram is in the positive zone and continues to rise, which signals a further increase in the USD/CAD quotes.

The Stochastic Oscillator is in the neutral zone, the %K line is above the %D line, which also indicates bullish moods.

Trading recommendations
  • Support levels: 1.31450, 1.31200, 1.30950
  • Resistance levels: 1.31700, 1.32000

If the price fixes above 1.31700, expect further growth toward 1.32000-1.32200.

Alternatively, the price will drop toward 1.31200-1.31000.

The USD/JPY currency pair

Technical indicators of the currency pair:
  • Prev Open: 108.177
  • Open: 108.648
  • % chg. over the last day: +0.45
  • Day’s range: 108.561 – 108.742
  • 52 wk range: 104.97 – 114.56

The USD/JPY currency pair shows a positive trend. Trading tool updated key extremes. At the moment, the USD/JPY quotes are consolidating. Local levels of support and resistance are: 108.500 and 108.750, respectively. We expect statistics on US GDP. We also recommend tracking up-to-date information regarding trade negotiations between the US and China. USD/JPY quotes have the potential for further growth. Positions must be opened from key levels.

The Economic News Feed for 26.07.2019 is calm.

USD/JPY

The price has fixed above 50 MA and 100 MA, which indicates the strength of buyers.

The MACD histogram is located in the positive zone, but below the signal line, which gives a weak signal to buy USD/JPY.

The Stochastic Oscillator is in the neutral zone, the% K line is above the% D line, which also gives a signal to buy USD/JPY.

Trading recommendations
  • Support levels: 108.500, 108.250, 108.000
  • Resistance levels: 108.750, 109.000

If the price consolidates above the level of 108.750, expect further growth toward 109.000-109.200.

Alternatively, the quotes can descend toward 108.300-108.100.

by JustForex

ECB Ready To Loosen Policy

By Orbex

The ECB president sent a strong signal to investors expecting an immediate rate cut yesterday. Forward guidance indicated that rates are expected to remain at current or lower levels at least through Q1 of 2020. This is despite the fact that Draghi mentioned the need to stimulate the economy in the near future.

Euro was supported following the less-dovish surprise.

All eyes now turn to the next FOMC policy meeting. This is what will determine the performance of EURUSD.

Euro Falls Before ECB, Soars After

Expectations of a Thursday rate cut on the back of an array of poor economic data in Germany, France and also in the wider euro area sent the euro lower. The soft patch of releases had investors thinking EURUSD will break the 1.11 psychological level and reach fresh lows. However, the ECB opted to keep rates on hold, supporting the beleaguered currency.

Will the 1.11 Support Hold Firm?

A false break below the strong 1.1116 bottom formed as Draghi dialed back on his dovish tone. This reversed the course for EURUSD. The rejection near the June low of 1.1181 came following a bounce from the 50% Stochastic indicator and as bulls started taking profits. As a result, the pair ended the session with a daily Doji bar, and that increases the chances of a bullish reversal.

eurusd

Dollar Upbeat on Positive Data

Although the dollar was taking a beating against a strong euro during and a little after Draghi’s speech, the sugar rush did little to hold USDJPY low. Core durable goods and jobless claims came out better than expected at 1.2% and 206K. The two economic releases were expected at 0.1% and 218K respectively, pummelling expectations. Safe-haven outflows supported the currency pair to break to a fresh July high.

Will Dollar Give Up Its Gains?

The USDJPY high of 108.75 was reached after bulls pushed prices above the 108.60 July-high resistance. Trading within an ascending channel, chances of further upside towards 109 remain elevated. However, the 108.28 support must remain firm should prices start a decline in the short-term.

usdjpy

WTI Muted On Contradicting Factors

Despite heightened geopolitical tensions in the Middle East, oil prices remained unchanged yesterday. Following a poor EIA inventories report on Thursday and news that Saudi is going to boost crude pipeline capacity, earlier gains from central bank language were offset. Monetary stimulus, however, could help the oil in the medium term. This is provided industrial demand remains of course at par levels.

US Oil Rangebound But Close to Breaking

Demand for oil saw a slide at the 57.66 high on early Thursday, where prices reversed course and headed towards to the bottom of the tight 57.66-56.05 range. Given the current state of economies and rejection by the 50% Stochastic level, should the descending channel keep prices under pressure oil could soon reach the 54.83 level.

us oil

By Orbex


US Advance GDP To Show Slower Q2 Growth

By Orbex

The US Department of Commerce will be releasing its first advanced GDP estimate report. The data covers the three months ending June. Expectations point to a 1.8% increase in the GDP for the period.

The preliminary release of the GDP report will see the markets reacting. The data comes ahead of next week’s FOMC meeting. The Federal Reserve is widely expected to cut rates when it meets in July.

The quarterly period saw a bit of turbulence especially as US and China trade wars escalated quickly. Payrolls were also rather mixed during the three month period, underlining the weaker GDP growth expectations.

U.S. GDP
US GDP Q1 2019

What are the General Estimates on the GDP?

Various GDP models are forecasting a median increase of 1.5% on the quarter ending June. The highest estimate is for an increase of 2.0% while the average consensus points to a 1.7% increase.

From this, we could state that the expectations for the GDP to rise is somewhere between 1.5% to 1.7% for the quarter ending June 2019. But economists polled by Reuters forecast that the US economy will rise by about 1.8% in the quarter ending June 2019.

If the GDP numbers come within the estimated ranges, it is likely that the pace of growth would be the slowest since the first quarter of 2015. The US GDP grew at a pace of 1.5% back then.

Impact of the Advance GDP Report on the Markets

Investors will be looking closely at the advance GDP report coming out as it will influence the Fed’s monetary policy.

The markets have heavily discounted a rate cut at the July Fed meeting. According to the CME Group’s Fed funds rate, the probability of a 25 basis point rate cut is about 65%.

The Fed funds rate currently is at 2.25%-2.50%. This rate cut comes as a pre-emptive move from the Federal Reserve. The central bank is known for moving too slow in the past.

As a result, this quarter basis point rate cut is seen as a way to enable the US to continue the steady pace of growth. It is also seen as a way to avoid a recession in the US economy.

While historically, the advance GDP reports are often subject to change in the subsequent releases, the initial impact will be strong.

While the markets are discounting a rate cut, a surprise beat on the estimates could make things complicated. However, the bar for the Fed to keep rates steady is rather high.

This is likely if the US economy sees a 2.5% or a higher growth rate. But given the recent trends in various indicators, the probability of a higher GDP growth rate (higher than the first-quarter growth rate) is low.

What Markets to Watch During the GDP Release?

The equities, bonds and the currency markets will clearly feel the impact of the GDP release. The US equity markets touched new all-time highs right at the start of the corporate earnings season.

The rise in the equity indices came on the back of Fed Chair Jerome Powell reiterating the dovish view from the central bank. With the markets already discounting the rate cut, it will be interesting to watch how the equity markets react.

The US dollar is also one to watch for. The Washington Administration has expressed its preference for a weaker currency. With the Fed lowering rates, the US dollar might start to lose some strength. But it is a lot more complex than just the Fed funds rate playing a role.

The volatility in USD can be seen in the major currency pairs.

Finally, the yields in the US Treasuries have been steadily falling since early 2019, after reaching a high just above 3.20. The data infers that the markets have been discounting the Fed to cut interest rates for a while.

By Orbex