The aim and developments of the program are recapped in a CIBC report.
In a July 22 research note, analyst Robert Catellier reported that CIBC increased its target price on AltaGas Ltd. (ALA:TSX) to CA$21 per share from CA$20 due to “a stronger result on the distributed energy asset sale and in light of the solid progress on asset sales in general.” The energy infrastructure company’s current share price is around CA$20.71.
Regarding the former, AltaGas’ sale of its distributed generation assets to TerraForm Power generated CA$940 million in proceeds and a 12x EBITDA valuation, “both higher than we expected,” Catellier indicated.
Regarding the latter, on plan to garner CA$1.52 billion from asset sales, AltaGas has raised CA$1.3 billion. It should be able to achieve the last roughly CA$200 million in sales, added Catellier, and could simply do so by selling its remaining interest in AltaGas Canada. With sales of other assets in addition, the energy firm could exceed the CA$2 billion goal.
Catellier highlighted that “the company has struck a nice balance between the required urgency to remove the funding gap and remaining disciplined enough to achieve attractive valuations.”
Partially offsetting some of the company’s asset sale progress, however, is the near and medium-term impact of “surplus production leading to pressure on natural gas liquids prices and frack spreads,” Catellier wrote. In light of those environmental factors, CIBC revised its estimates accordingly.
Disclosure: 1) Doresa Banning compiled this article for Streetwise Reports LLC and provides services to Streetwise Reports as an independent contractor. She or members of her household own securities of the following companies mentioned in the article: None. She or members of her household are paid by the following companies mentioned in this article: None. 2) The following companies mentioned in this article are billboard sponsors of Streetwise Reports: None. Click here for important disclosures about sponsor fees. 3) Comments and opinions expressed are those of the specific experts and not of Streetwise Reports or its officers. The information provided above is for informational purposes only and is not a recommendation to buy or sell any security. 4) The article does not constitute investment advice. Each reader is encouraged to consult with his or her individual financial professional and any action a reader takes as a result of information presented here is his or her own responsibility. By opening this page, each reader accepts and agrees to Streetwise Reports’ terms of use and full legal disclaimer. This article is not a solicitation for investment. Streetwise Reports does not render general or specific investment advice and the information on Streetwise Reports should not be considered a recommendation to buy or sell any security. Streetwise Reports does not endorse or recommend the business, products, services or securities of any company mentioned on Streetwise Reports. 5) From time to time, Streetwise Reports LLC and its directors, officers, employees or members of their families, as well as persons interviewed for articles and interviews on the site, may have a long or short position in securities mentioned. Directors, officers, employees or members of their immediate families are prohibited from making purchases and/or sales of those securities in the open market or otherwise from the time of the interview or the decision to write an article until three business days after the publication of the interview or article. The foregoing prohibition does not apply to articles that in substance only restate previously published company releases.
Disclosures from CIBC, AltaGas Ltd., July 22, 2019
Analyst Certification: Each CIBC World Markets Corp./Inc. research analyst named on the front page of this research report, or at the beginning of any subsection hereof, hereby certifies that (i) the recommendations and opinions expressed herein accurately reflect such research analyst’s personal views about the company and securities that are the subject of this report and all other companies and securities mentioned in this report that are covered by such research analyst and (ii) no part of the research analyst’s compensation was, is, or will be, directly or indirectly, related to the specific recommendations or views expressed by such research analyst in this report.
Analysts employed outside the U.S. are not registered as research analysts with FINRA. These analysts may not be associated persons of CIBC World Markets Corp. and therefore may not be subject to FINRA Rule 2241 restrictions on communications with a subject company, public appearances and trading securities held by a research analyst account.
Potential Conflicts of Interest: Equity research analysts employed by CIBC World Markets Corp./Inc. are compensated from revenues generated by various CIBC World Markets Corp./Inc. businesses, including the CIBC World Markets Investment Banking Department. Research analysts do not receive compensation based upon revenues from specific investment banking transactions. CIBC World Markets Corp./Inc. generally prohibits any research analyst and any member of his or her household from executing trades in the securities of a company that such research analyst covers.Additionally, CIBC World Markets Corp./Inc. generally prohibits any research analyst from serving as an officer, director or advisory board member of a company that such analyst covers.
In addition to 1% ownership positions in covered companies that are required to be specifically disclosed in this report, CIBC World Markets Corp./Inc. may have a long position of less than 1% or a short position or deal as principal in the securities discussed herein, related securities or in options, futures or other derivative instruments based thereon.
Recipients of this report are advised that any or all of the foregoing arrangements, as well as more specific disclosures set forth below, may at times give rise to potential conflicts of interest.
Important Disclosure Footnotes for AltaGas Ltd. (ALA)
· CIBC World Markets Inc. expects to receive or intends to seek compensation for investment banking services from AltaGas Ltd. in the next 3 months.
· CIBC World Markets Inc. expects to receive or intends to seek compensation for investment banking services from AltaGas Ltd. in the next 3 months.
CIBC World Markets Corp., CIBC World Markets Inc., and their affiliates, in the aggregate, beneficially own 1% or more of a class of equity securities issued by AltaGas Ltd.
This company is a client for which a CIBC World Markets company has performed investment banking services in the past 12 months.
CIBC World Markets Inc. has managed or co-managed a public offering of securities for this company in the past 12 months.
CIBC World Markets Inc. has received compensation for investment banking services from this company in the past 12 months.
CIBC World Markets Corp., CIBC World Markets Inc., and their affiliates, in the aggregate, beneficially own 1% or more of a class of equity securities issued by this company.
Sector expert Michael Ballanger muses on how the baby boom generation has impacted markets through time, and discusses how he will play the current precious metals bull.
“Destroyers seize gold and leave to its owners a counterfeit pile of paper.” Ayn Rand
The baby-boom generation, of which I am a less-than-proud member, blew it.
There was a time long, long ago when the mention of the words “baby boomer” evoked a sense of pride of membership. Amid the prosperity of the post-WWII era, birth rates in North America soared while the sons and daughters of many men and women that fought in the war became the dominant demographic force by the year 1966.
When I was in grade 10, I wrote an essay that pointed to the defining moment, where the excitement and unbridled optimism of the Space Race, advances in modern medicine and unparalleled economic growth was snuffed out forever by an assassin’s bullet in Dallas in the autumn of 1963. With the end of Camelot, the boomer generation suddenly began to question things. They threw away the Beach Boys “Surfin’ Nirvana” lifestyle for the darker messages of Bob Dylan, CSNY, the Doors and Hendrix, and they watched while the Vietnam war claimed over 58,000 U.S. servicemen and caused massive civil unrest to permeate the inner cities and the campuses of America.
Through the unwillingness of the baby boomers to accept the garbage spewed out by the radio and print media, as well as the fledgling television industry, young people rose defiantly to implement an end to a war that had become a national embarassment and political nightmare. I arrived in Saint Louis in the fall of 1971, a mere four years before Saigon fell, and by then, the historically conservative (pro-war) city of Saint Louis had seen a demographic shift in camps, as the campuses and high schools were filled with long-haired radicals heavily recruiting the youth of the era to “tear it all down” in order to effect the much-needed political and social changes that were so overdue by then. On the other side of the demarcation line were the rednecks, the police, the National Guard and, of course, the military.
The sidebar to all of this is that the boomers also took down a president, in the form of Richard Nixon, so to say that the boomers had serious “stroke” is an understatement. The mediums were FM radio, Rolling Stone magazine and weed, and that was all that was needed to effect changeit mattered not where. We, as a generation, were a force.
However, and very sadly, ending the war in Vietnam by nonviolent protest and by their sheer numbers (it was nothing to see 20,000 young people at anti-war rallies)that was just about where the great metamorphosis ended. We, as a generation, as we had done with the Beach Boys, threw away the old protest albums of the ’60s and ’70s and opted instead for a different type of optimism from that which empowered our parents in the ’50s.
A former movie star arrived on the scene in the form of Republican Ronald Reagan (nicknamed “Ronald Ray-Gun” by Country Joe at Woodstock) in 1980, and despite the non-violent, intellectual approach of opponent Democrat Jimmy Carter, the boomers swept Reagan into power with the largest popular vote in history. From that moment on, my generation shifted focus from morality to money and with that shift, the largest voting demographic in world history has continued to act in a self-serving, sycophantic mode of behavior most foul to those who dare try to recall the ethical bravery of the 1960s. Famous cofounder of the Students for a Democratic Society (SDS), Jerry Rubin, went from bell-bottomed blue jeans to blue pinstripes by taking a job on Wall Street, and that punctuated the generational sentence of the boomer tribe.
We boomers now look at our offspring and we cry for their future. We don’t lament for how they are voting or why they are voting or even if they are voting because deep down, we all knowevery one of usthat their decisions are the ones crafted for them by their forebearers. The parents of we boomers were indelibly etched by the Great Depression of 19301933. I recall my father’s tales of delivering “day-old bread” to houses up in Rosedale for “a penny a loaf” in 1931, and what hit me was that after he passed at the grand age of 89, as I was sorting his affairs out, there were countless cubbyholes and bookshelves filled with all sorts of coins and currency. They might have totaled perhaps $1,500, but the fact they were stashed away, insulated from the thievery of Depression-era desperation, was a testimonial to the imprint it left upon that generation.
By contrast, the newly empowered millennial generation has no compassion nor comprehension as to why any human being would need to store anything; they are most comfortable in storing all of their net worth in the digital vault of the cyber-world. That may (or may not) be sound thinking, but the point remains that the boomer generation had a chance to restore fiscal sanity by bringing Bretton Woods back with a vengeance. We didn’t. We opted for the status quo. We voted for our short term wealth and voted against our long-term health. We sold out.
There has never been a time when “hoarding cash” ever resulted in an enhanced lifestyle. Theoretically, had you gone to cash in 1928, you at least had a few years to activate that cash as asset prices collapsed, so perhaps the Great Depression might serve as a one-off. However, I urge you all to join me in celebrating the legacy of what we boomers have bequeathed upon you all. Your savings (if you have any) are going to have minimal purchasing power as time passes, and your expectations of the same are going to be worth the same as the paper one finds in public lavatories.
However, the financial media celebrates and rejoices every time one of the averages hits a new high, and the astounding fact remains that they cannot see the forest for the trees. Stocks are rising because their replacement value is running for its life from debasement and while it would appear to be a “good thing,” it is not. Wealth gravitates to proper treatment; it flees abuse. Wealth is gravitating to gold and silver; it is fleeing cash.
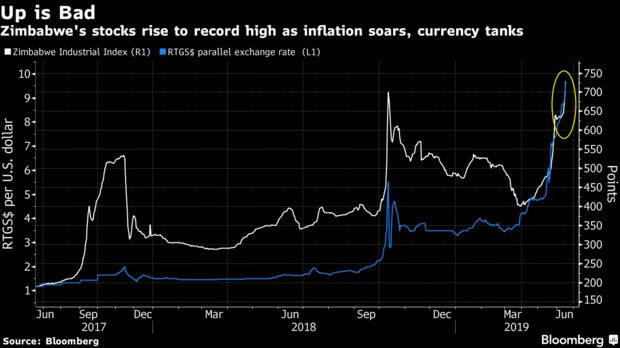
“Historically, the Zimbabwe Stock Market reached an all-time high of 773.06 in June of 2019 and a record low of 93.39 in June of 2016.”Bloomberg
When you think of places to invest, Zimbabwe is certainly not one of them. Once heralded as “the bread basket of Africa,” it is now a net importer of grains as the prolific immigrant European farmers had their land expropriated by the Mugabe regime in an effort to restore tribal ownership to the native inhabitants.
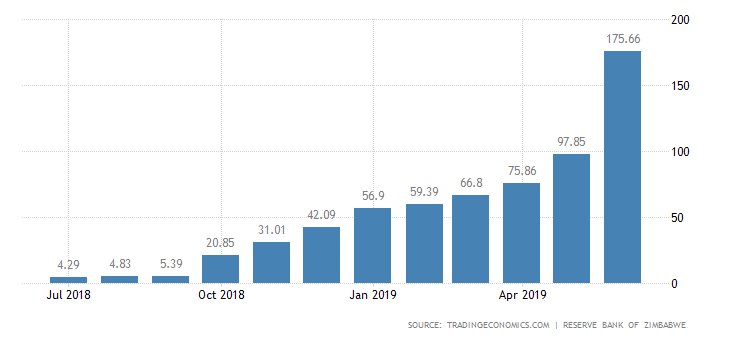
Forgetting the moral argument for a moment, the point here is that Zimbabwe stocks are screaming to all-time highs despite an inflation rate exceeding 175% per annum. This is the example of what happens when societies distrust and, in fact, detest cash. Zimbabwe citizens will jettison cash as soon as it arrives in their hands, providing a prime example of the “replacement power of equities within an inflationary spiral.”
We are seeing stock markets around the world print new highs with increasing regularity and the mainstream media would suggest that the stock markets are barometers of impending economic expansion and financial well-being. The problem with that is that it is the $14 trillion in new wet-ink debt that “rescued the financial system” (read: bailed out the criminal banks that blew it up) that is now surfacing in the form of excess liquidity sloshing around the world markets and chasing equities higher.
Some 65% of global bonds now yielding negative returns is also shepherding cash to equities but the media would have us believe that it is a policy “miracle” that is creating the boom. It is not. It is Modern Monetary Theory debasing the purchasing power of cash. In currency terms, stocks are rising because the value of savings is crashing. Prudence in personal money management is being punished by central bank profligacy, and just as the Zimbabwe markets convey a false message of prosperity, the middle and working-class citizens of Europe and North America are certainly not feeling the warmth that a 3,019 S&P 500 level should be instilling.
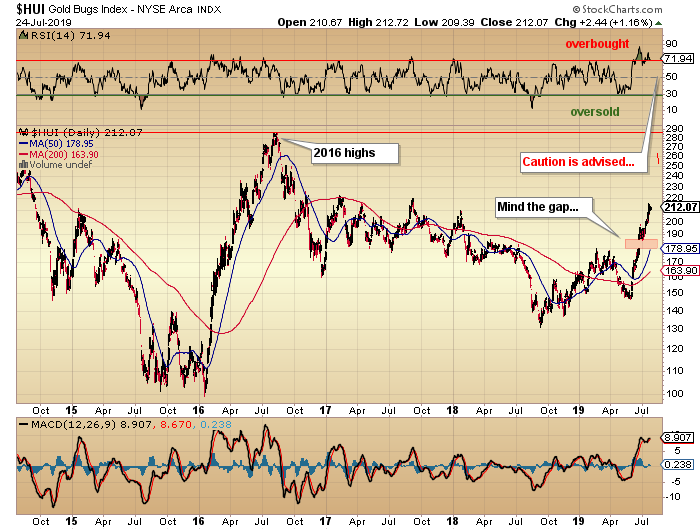
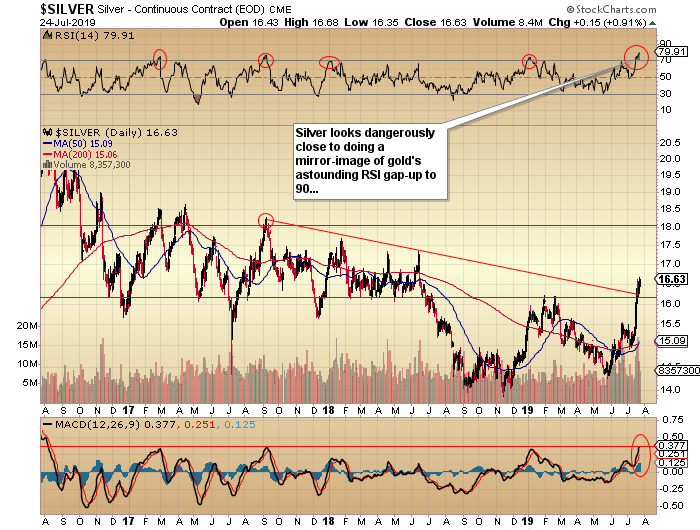
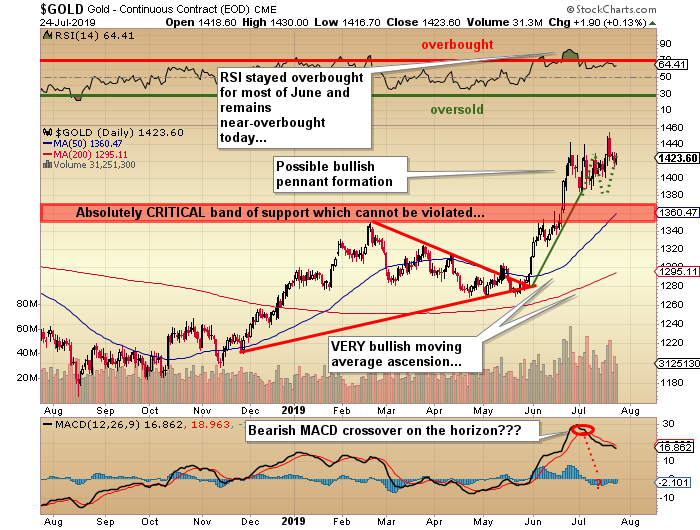
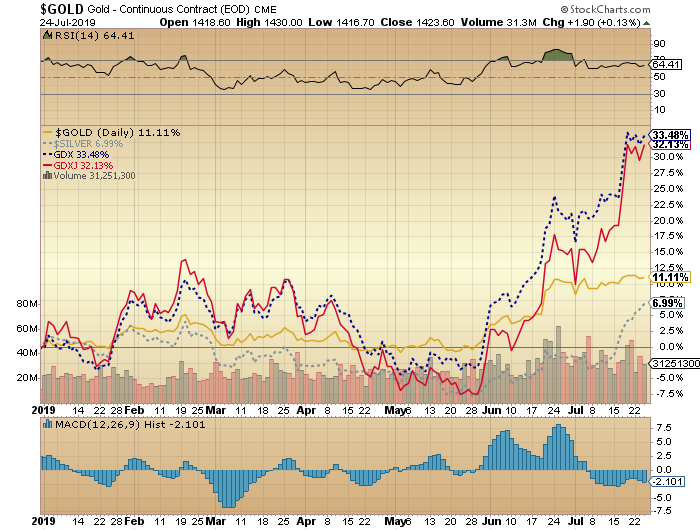
Until recently, investors largely ignored the precious metals, the historical defense mechanism against debasement because of the countless and incessant interventions and interference capping any and all advances. But here in the summer of 2019, investors appeared to have warmed up to the notion of owning a little gold and silver, and given the relatively puny size of those markets, even the slightest of attention can drive prices higher. When gold penetrated the $1,400 barrier in June, it altered the configuration of asset allocations around the world, and as can be seen in the HUI’s breathtaking advance off the lows and silver’s abrupt about-face after months (if not years) of underperformance, the utility of precious metals ownership is gathering both popularity and momentum. It is a most welcome occurrence for the grizzled metals enthusiast and comes at a most opportune moment in history.
Near-term, I must confess that the power of this advance in gold has surprised me with its uncanny ability to stay overbought or near-overbought for what seems like weeks. RSI (relative strength index) readings hit nearly 90 in June on the first ascension through $1,440, with levels not seen since 20102011. I am fully invested in the conservative portfolio that has zero leverage and is evenly split between gold, silver (physical), senior miners (GDX) and junior miners (GDXJ).
I took a trade on half of the ETFs in late June, and luckily was able to buy them back a hair below where they were sold. The portfolio is ahead 30.13% year-to-date (YTD), based on all trades. The only leveraged position I currently hold is the SLV October $15.50, which was purchased with the proceeds of the triple I made on the SLV August $14 calls on the move from $0.60 to $1.80. The October $15.50 calls were bought at $0.48 and are now $0.69.
Would I add to the SLV position? That is a very tough call to make because despite the new paradigm in which we now reside, I simply cannot buy into the near-80 RSI level that SLV currently sports. I also learned a lesson from my early exit from the GLD calls in early Julythat RSI can offer a misleading signal, because while it saved my arse in the range-bound markets of 20172019, avoiding nearly $400 of drawdowns in gold, it rocketed to nearly 90 last month and has remained elevated as prices have continued to rally. I am long SLV calls and very nervous, but am also mindful of its potential to do a gold RSI repeat (a move to 90), taking silver into the mid-$18 level and the calls to $3.00. We shall see.
You can see how the market rewards discoveries (GBR) and punishes either no news or bad news (GTCH/WUC/SRC). I added Aftermath (AAG) because it has an established silver resource in Chile capable of increases in size through exploration, so it holds leverage to both the silver price and exploration results as potential drivers of price.
As we progress further into this rampaging bull, I am going to be far more attentive to companies that have existing discoveries or ore bodies, which eliminate the exploration risks that were necessary in the past when the metal prices were stagnant. With metal prices anything but stagnant, I want to capture the upside of the move in the metals and avoid being left out of the spoils of victory because exploration results were less-than-stellar (or nonexistent).
I leave Sunday for my annual voyage into the “waters unknown” of northern Georgian Bay, which contains the finest freshwater boating in the world. I hope to get to the Bad River Channel by next weekend, an anchorage of immense beauty, great fishing, crystal-clear water and more hidden and very hazardous rocks than any place on the planet (as I so painfully discovered two years ago). I leave you all with this YouTube clip of one of the many dinghy tours we take into the backcountry, includes the mighty French River (https://www.youtube.com/watch?v=svR9D1Jacvs&t=40s).
I will not be posting another update until after I return mid-August but I will be providing updates via Twitter so you can follow me at @Miningjunkie to see how I am navigating the waters and the markets.
Originally trained during the inflationary 1970s, Michael Ballanger is a graduate of Saint Louis University where he earned a Bachelor of Science in finance and a Bachelor of Art in marketing before completing post-graduate work at the Wharton School of Finance. With more than 30 years of experience as a junior mining and exploration specialist, as well as a solid background in corporate finance, Ballanger’s adherence to the concept of “Hard Assets” allows him to focus the practice on selecting opportunities in the global resource sector with emphasis on the precious metals exploration and development sector. Ballanger takes great pleasure in visiting mineral properties around the globe in the never-ending hunt for early-stage opportunities.
Disclosure: 1) Michael J. Ballanger: I, or members of my immediate household or family, own securities of the following companies mentioned in this article: Aftermath Silver Ltd., Great Bear Resources, Western Uranium, Stakeholder Gold, Getchell Gold. My company has a financial relationship with the following companies referred to in this article: Getchell Gold Corp. and Western Uranium & Vanadium Corp. My firm no longer does consulting work for Stakeholder Gold.. I determined which companies would be included in this article based on my research and understanding of the sector. Additional disclosures are below. 2) The following companies mentioned in this article are billboard sponsors of Streetwise Reports: Great Bear Resources. Click here for important disclosures about sponsor fees. As of the date of this article, an affiliate of Streetwise Reports has a consulting relationship with Western Uranium and Vanadium and Aftermath. Please click here for more information. 3) Statements and opinions expressed are the opinions of the author and not of Streetwise Reports or its officers. The author is wholly responsible for the validity of the statements. The author was not paid by Streetwise Reports for this article. Streetwise Reports was not paid by the author to publish or syndicate this article. Streetwise Reports requires contributing authors to disclose any shareholdings in, or economic relationships with, companies that they write about. Streetwise Reports relies upon the authors to accurately provide this information and Streetwise Reports has no means of verifying its accuracy. 4) This article does not constitute investment advice. Each reader is encouraged to consult with his or her individual financial professional and any action a reader takes as a result of information presented here is his or her own responsibility. By opening this page, each reader accepts and agrees to Streetwise Reports’ terms of use and full legal disclaimer. This article is not a solicitation for investment. Streetwise Reports does not render general or specific investment advice and the information on Streetwise Reports should not be considered a recommendation to buy or sell any security. Streetwise Reports does not endorse or recommend the business, products, services or securities of any company mentioned on Streetwise Reports. 5) From time to time, Streetwise Reports LLC and its directors, officers, employees or members of their families, as well as persons interviewed for articles and interviews on the site, may have a long or short position in securities mentioned. Directors, officers, employees or members of their immediate families are prohibited from making purchases and/or sales of those securities in the open market or otherwise from the time of the interview or the decision to write an article until three business days after the publication of the interview or article. The foregoing prohibition does not apply to articles that in substance only restate previously published company releases. As of the date of this article, officers and/or employees of Streetwise Reports (including members of their household) own securities of Getchell Gold, Western Uranium and Stakeholder Gold and Aftermath, companies mentioned in this article.
Charts courtesy of Michael Ballanger.
Michael Ballanger Disclaimer: This letter makes no guarantee or warranty on the accuracy or completeness of the data provided. Nothing contained herein is intended or shall be deemed to be investment advice, implied or otherwise. This letter represents my views and replicates trades that I am making but nothing more than that. Always consult your registered advisor to assist you with your investments. I accept no liability for any loss arising from the use of the data contained on this letter. Options and junior mining stocks contain a high level of risk that may result in the loss of part or all invested capital and therefore are suitable for experienced and professional investors and traders only. One should be familiar with the risks involved in junior mining and options trading and we recommend consulting a financial adviser if you feel you do not understand the risks involved.
As we near the important date of August 19, 2019, and we watch how the markets are reacting based on our earlier predictions, it is becoming evident that the US stock markets and global stock markets are following our predictions very well. The fact that these markets are doing almost exactly what we predicted months ago suggests that our call for an August 19, 2019 breakdown in the US/Global markets should also align with price activity very well.
This Q2 earnings week and the continued shifting of capital withing the global markets are suggesting a couple of things that traders need to be aware of :
_ Quite a bit of capital has already been pulled out of the global markets over the past 60+ days.
_ The US Fed has hinted that a rate decrease may be in the works over the next few months – suggesting that the Fed is more concerned with increasing economic activity than further normalization efforts.
_ China, Asia, and Europe continue to deal with slumping economic activity, demand and output.
_ Deutsche Bank is an unknown factor that could turn into a black-hole for the global banking system
_ Global derivatives activities have decreased tremendously over the past 15+ months.
We suggest that everyone take a few minutes to review these recent research posts to better understand what is actually happening in the US/global markets.
Our belief that the US stock market would continue to push higher while attempting to break key psychological price levels has played out perfectly. The recent Q2 earnings data has accomplished just what we expected – a continued upside price bias with moderate volume. This move has pushed the VIX into a lower basing pattern and we believe the NQ may attempt to rally to levels above $8000 again (after breaching this level on July 16).
The key to everything our predictive modeling systems are suggesting is a “rollover in investor sentiment” that is likely to take place after Q2 earnings data is completed and in the midst of an August (Summer) slump in economic activity. Our predictive modeling systems and cycle analysis tools have suggested that the US markets will find unexpected weakness starting in early August, peaking near August 19 (which is when we expect a breakdown event to occur) and continuing for many months after this move begins.
We believe this downside price move will be associated with some type of external economic impulse – such as a collapsing banking/debt sector in China, news of a hard Brexit taking place, a Deutsche Bank collapse or some type of external event that will prompt this downside price move.
As volatility continues to expand while capital is being pulled out of the markets, this creates a VOID of liquidity when an event like this takes place (similar to what happened during the Flash Crash event). Traders should be very cautious right now because all of the evidence that we’ve been able to find suggest institutional level players have already scaled out of the markets and move into protective investments. Thus, any real breakdown in the markets could be vicious and aggressive at this point.
This Weekly NASDAQ Futures Chart highlights the BLUE ELLIPSE resistance level that price is currently testing. It is our belief that price will run into extreme resistance at this level and roll-over into a downtrend over the next 30+ days. Our Fibonacci price modeling system is suggesting a downside target of 7000, 6000 and 5910. The deepest of these levels align almost perfectly with the lows from December 2018 – a -25% price decline.
CONCLUDING THOUGHTS:
Do you want to know where other opportunities can be found based on this NQ prediction? Are you ready for these types of great trade setups for the rest of 2019 and into 2020? In part II of this article, we’ll highlight two more great trade setups that align with our expectations for the US and global markets.
You should be starting to get a feel of where stocks are headed along with precious metals for the next 8-24 months. The next step is knowing when and what to buy and sell as these turning points take place, and this is the hard part. If you want someone to guide you through the next 12-24 months complete with detailed market analysis and trade alerts (entry, targets and exit price levels) join my ETF Trading Newsletter.
Be prepared for these incredible price swings before they happen and learn how you can identify and trade these fantastic trading opportunities in 2019, 2020, and beyond with our Wealth Building & Global Financial Reset Newsletter. You won’t want to miss this big move, folks. As you can see from our research, everything has been setting up for this move for many months.
Join me with a 1 or 2-year subscription to lock in the lowest rate possible and ride my coattails as I navigate these financial market and build wealth while others lose nearly everything they own during the next financial crisis.
As a technical analysis and trader since 1997, I have been through a few bull/bear market cycles. I believe I have a good pulse on the market and timing key turning points for both short-term swing trading and long-term investment capital. The opportunities starting to present themselves will be life-changing if handled properly.
FREE GOLD OR SILVER WITH MEMBERSHIP!
Kill two birds with one stone and subscribe for two years to get yourFREE PRECIOUS METAL and get enough trades to profit through the next metalsbull market and financial crisis!
Here are this week’s links to the latest Commitment of Traders data changes that were released on Friday.
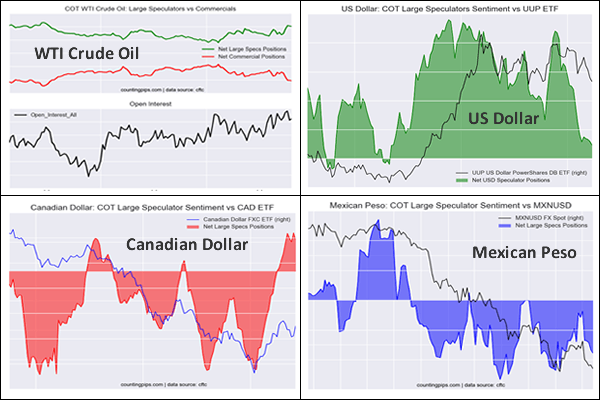
This week in the COT data, USD Index speculator bets rose higher for a fourth straight week while the Canadian dollar speculator bets gained for a fifth straight week (CAD is now in overall bullish territory for a fourth week).
The Australian dollar and New Zealand dollar bearish bets decreased this week and both have now seen multi-week improvements in their bearish speculator positions.
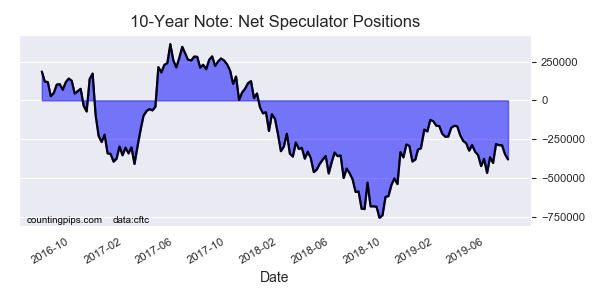
The 10-Year Bond positions continued to go more bearish this week for a second straight week. Overall, the 10-Year Bond speculative position has now been in bearish territory dating all the way back to December of 2017.
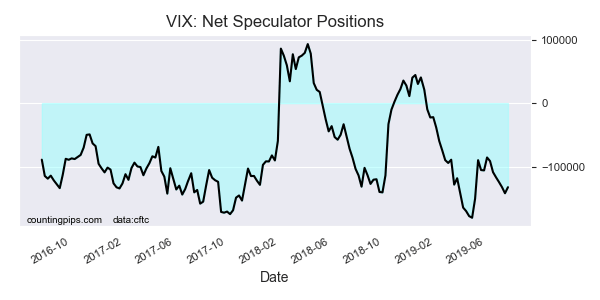
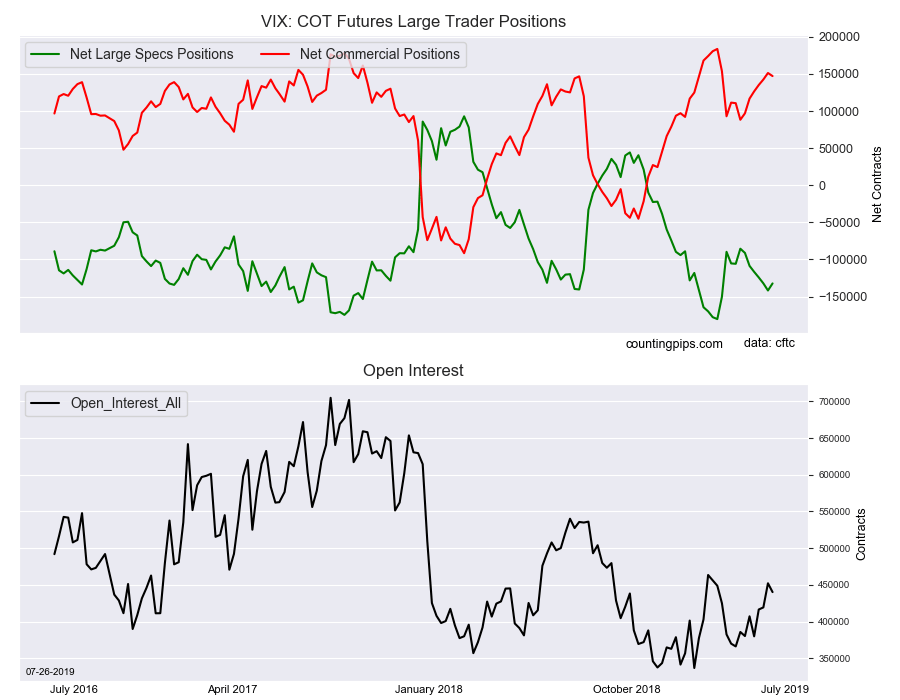
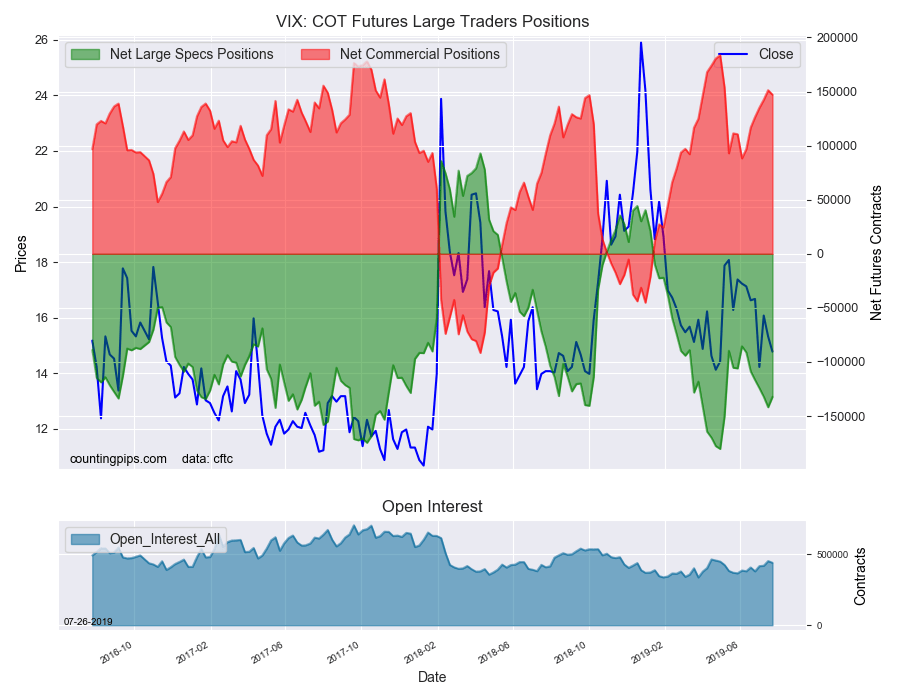
Finally, VIX speculators trimmed their bearish bets this week after six straight weeks of rising bearish positions. Specs have raised their bearish bets in 22 out of 29 weeks so far in 2019 and recently notched a record high bearish level on April 30th at -180,359 contracts.
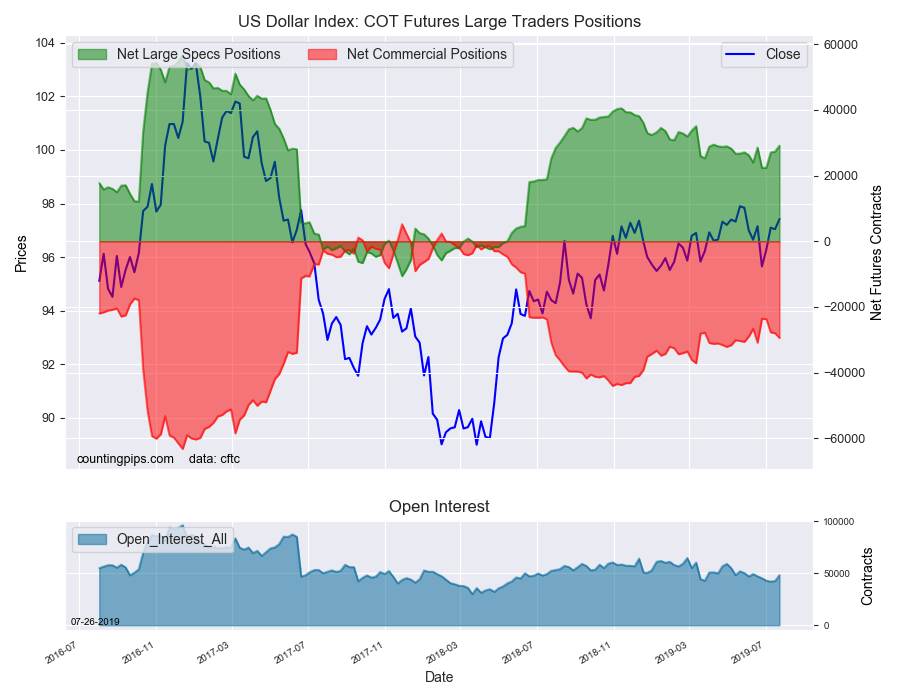
Large currency speculators advanced their net positions in the US Dollar Index futures markets this week, according to the latest Commitment of Traders (COT) data released by the Commodity Futures Trading Commission (CFTC) on Friday. See full article.
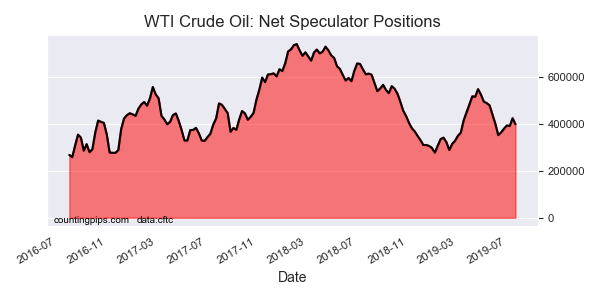
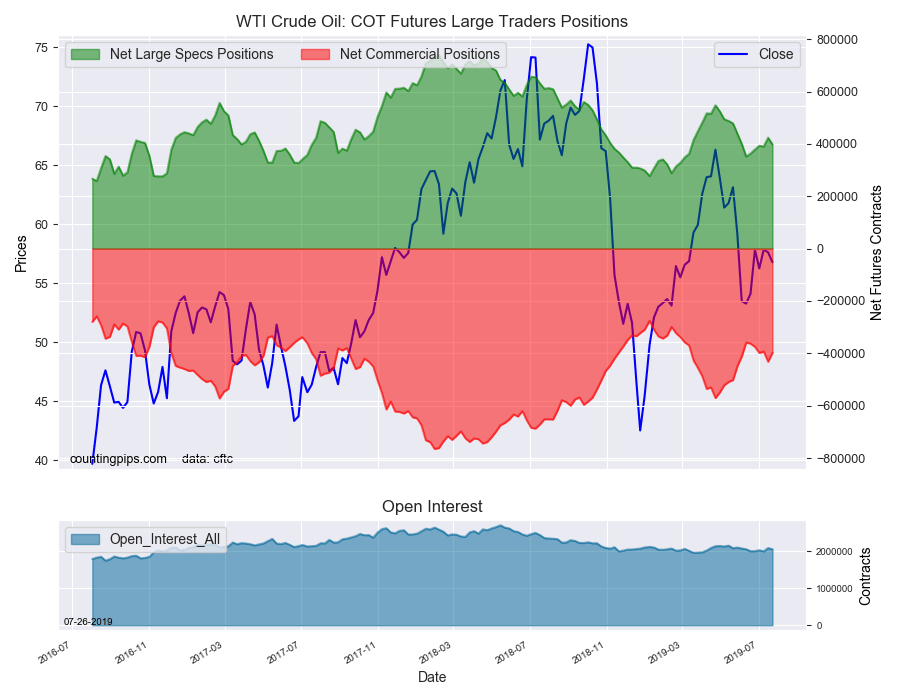
The large speculator contracts of WTI crude futures totaled a net position of 397,851 contracts, according to the latest data this week. This was a change of -25,911 contracts from the previous weekly total. See full article.
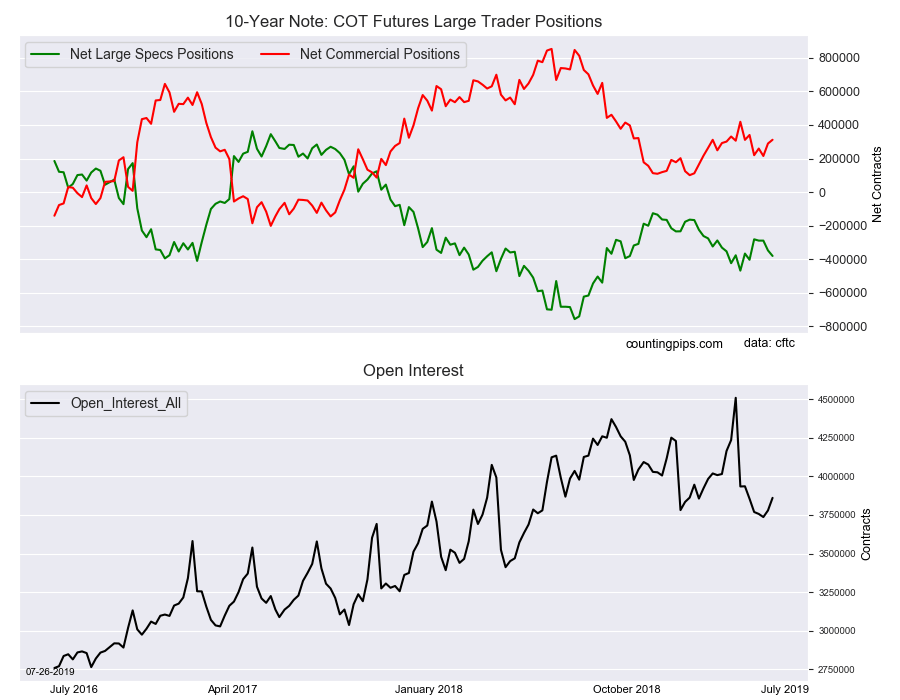
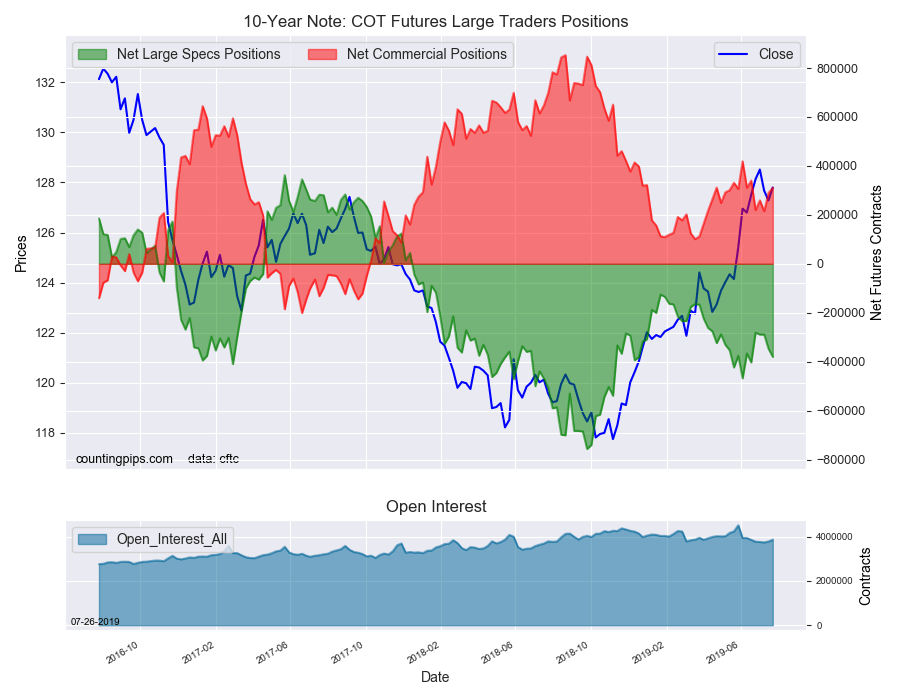
Large speculator contracts of the 10-Year Bond futures totaled a net position of -380,169 contracts, according to the latest data this week. This was a change of -32,947 contracts from the previous weekly total. See full article.
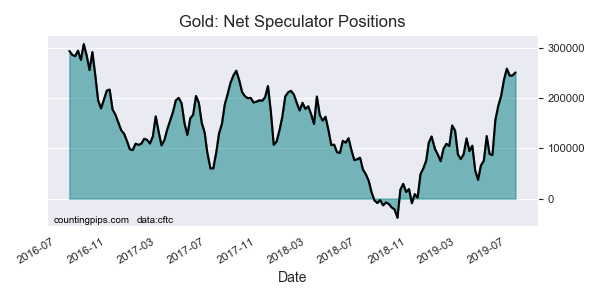
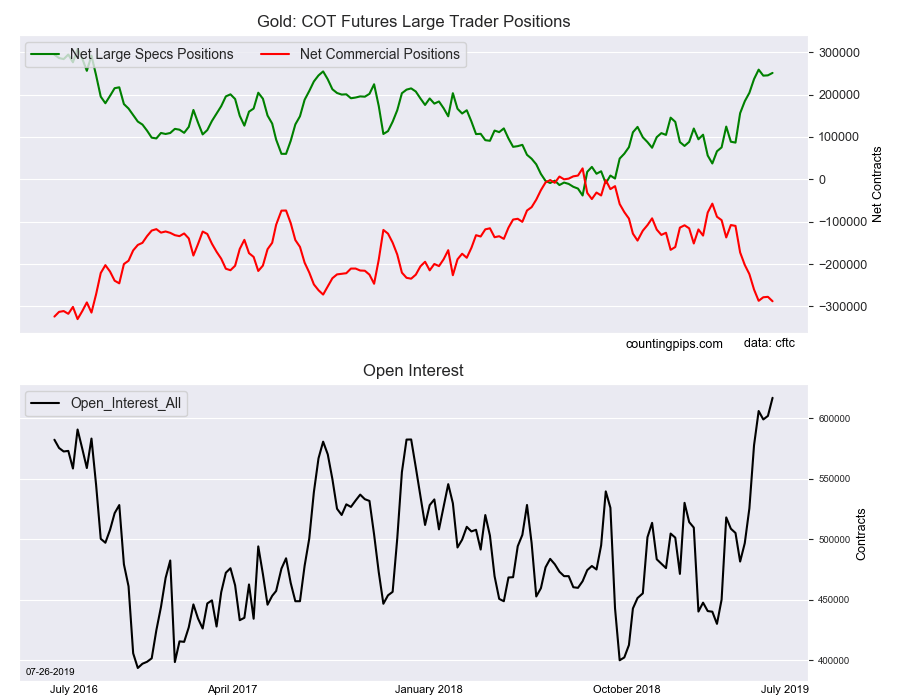
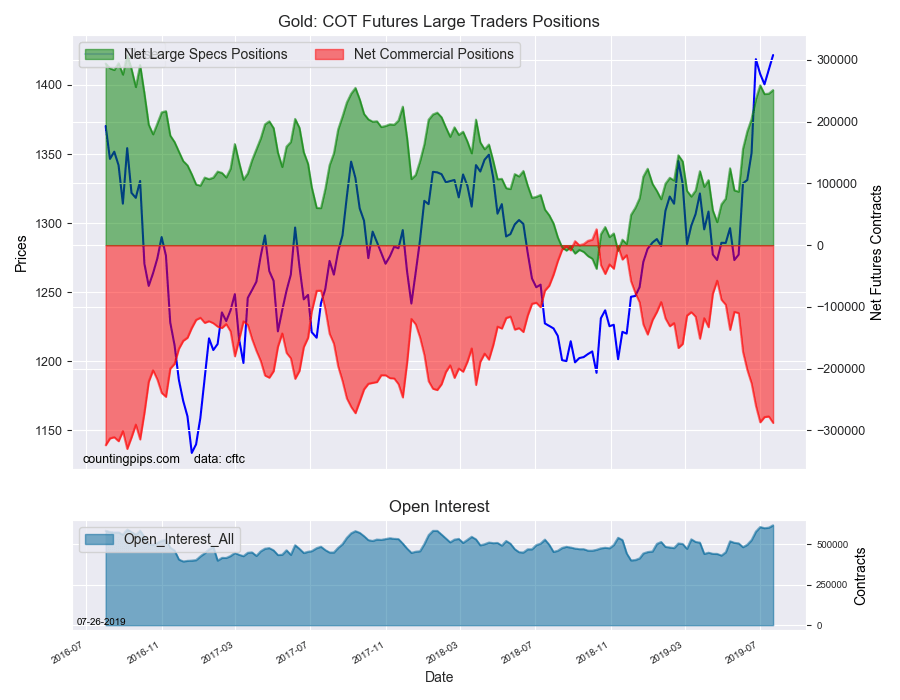
Large precious metals speculator contracts of the Gold futures totaled a net position of 251,250 contracts, according to the latest data this week. This was a change of 5,749 contracts from the previous weekly total. See full article.
Large stock market volatility speculator contracts of the VIX futures totaled a net position of -132,267 contracts, according to the latest data this week. This was a change of 9,530 contracts from the previous weekly total. See full article.
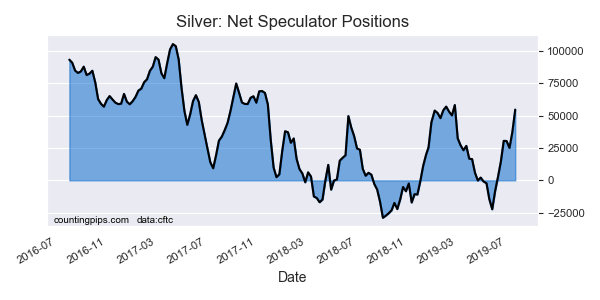
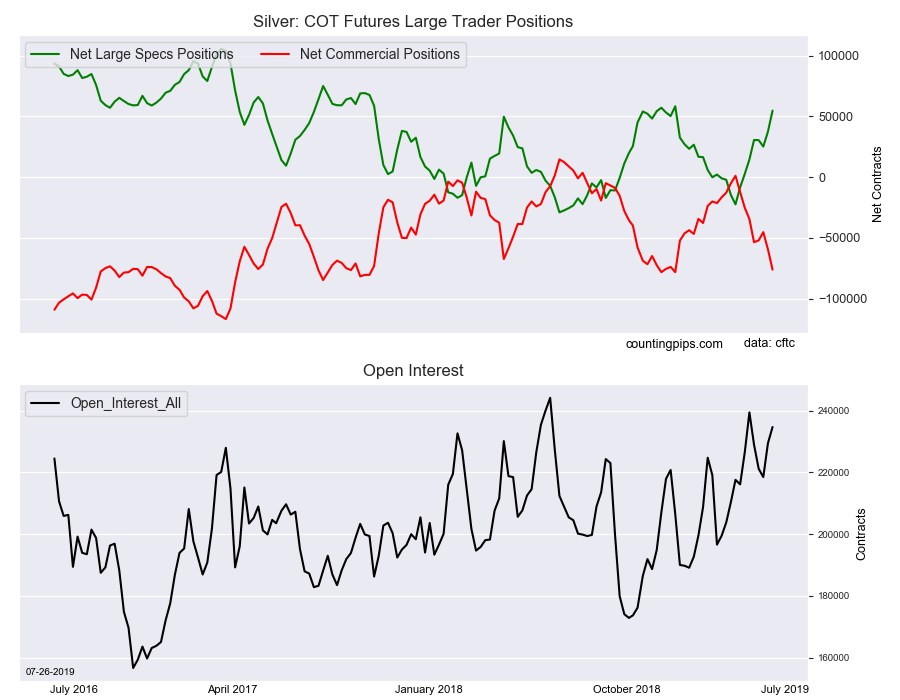
Large precious metals speculator contracts of the silver futures totaled a net position of 54,761 contracts, according to the latest data this week. This was a change of 17,336 contracts from the previous weekly total. See full article.
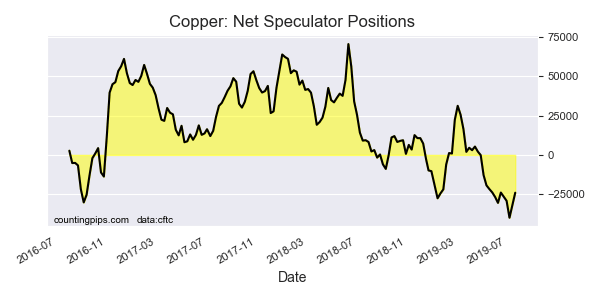
Metals speculator contracts of the copper futures totaled a net position of -24,049 contracts, according to the latest data this week. This was a change of 7,894 contracts from the previous weekly total. See full article.
*COT Report: The COT data, released weekly to the public each Friday, is updated through the most recent Tuesday (data is 3 days old) and shows a quick view of how large speculators or non-commercials (for-profit traders) were positioned in the futures markets.
The CFTC categorizes trader positions according to commercial hedgers (traders who use futures contracts for hedging as part of the business), non-commercials (large traders who speculate to realize trading profits) and nonreportable traders (usually small traders/speculators).
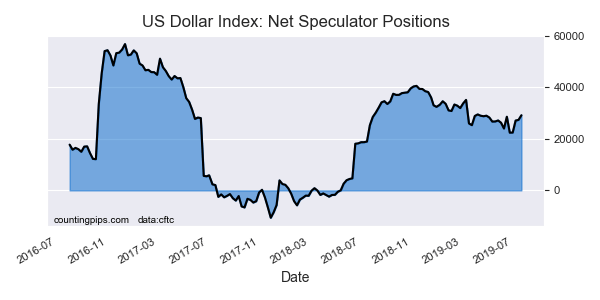
Large currency speculators raised their bullish net positions in the US Dollar Index futures markets this week, according to the latest Commitment of Traders (COT) data released by the Commodity Futures Trading Commission (CFTC) on Friday.
The non-commercial futures contracts of US Dollar Index futures, traded by large speculators and hedge funds, totaled a net position of 29,128 contracts in the data reported through Tuesday July 23rd. This was a weekly gain of 1,796 contracts from the previous week which had a total of 27,332 net contracts.
This week’s net position was the result of the gross bullish position rising by 5,766 contracts (to a weekly total of 42,218 contracts) compared to the gross bearish position which saw a boost by just 3,970 contracts for the week (to a weekly total of 13,090 contracts).
Speculators have now pushed their bullish bets higher for a fourth straight week and for the seventh time out of the past ten weeks. The current standing for Dollar Index positions has risen to the most bullish level since April 9th, a span of fifteen weeks.
Individual Currencies Data this week: CAD rises. AUD & NZD bets improve
Overall, for the individual currency contracts data, speculators increased their positions this week for the US dollar index (1,796 weekly change in contracts), Japanese yen (2,003 contracts), Canadian dollar (9,786 contracts), Australian dollar (4,596 contracts) and the New Zealand dollar (5,094 contracts).
The currencies whose speculative bets declined this week were the euro (-7,653 weekly change in contracts), British pound sterling (-2,226 contracts), Swiss franc (-1,461 contracts) and the Mexican peso (-3,366 contracts).
Notables for the week:
Canadian dollar speculator positions gained for the fifth straight week and have risen by a total of +68,821 contracts in that period. The positive sentiment in the CAD has pushed the speculator’s bullish level to the highest level since February 13th of 2018 and the CAD is only one of three major currencies with positive speculator sentiment (with USD Index and Mexican peso).
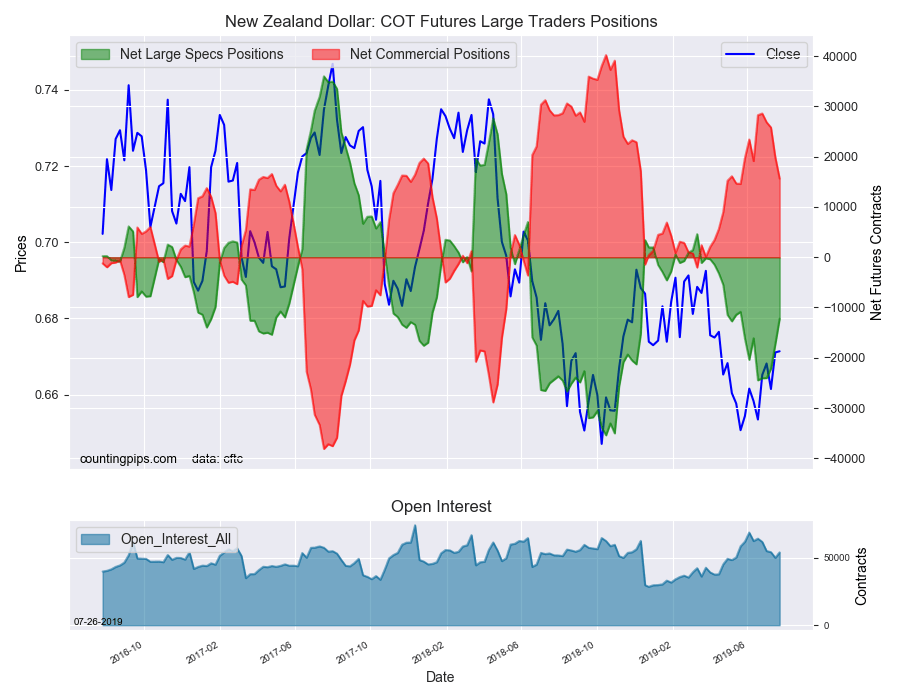
New Zealand dollar bearish bets have declined for five straight weeks after recently rising to the most bearish level of the year on June 18th at -24,468 net contracts. The NZD speculator bets have been in bearish territory since March 19th and went further bearish in May and into June after the Reserve Bank of New Zealand lowered their interest rate in May. The recent cool off in bearish bets has brought the NZD bets to their best level (least bearish) since May 21st.
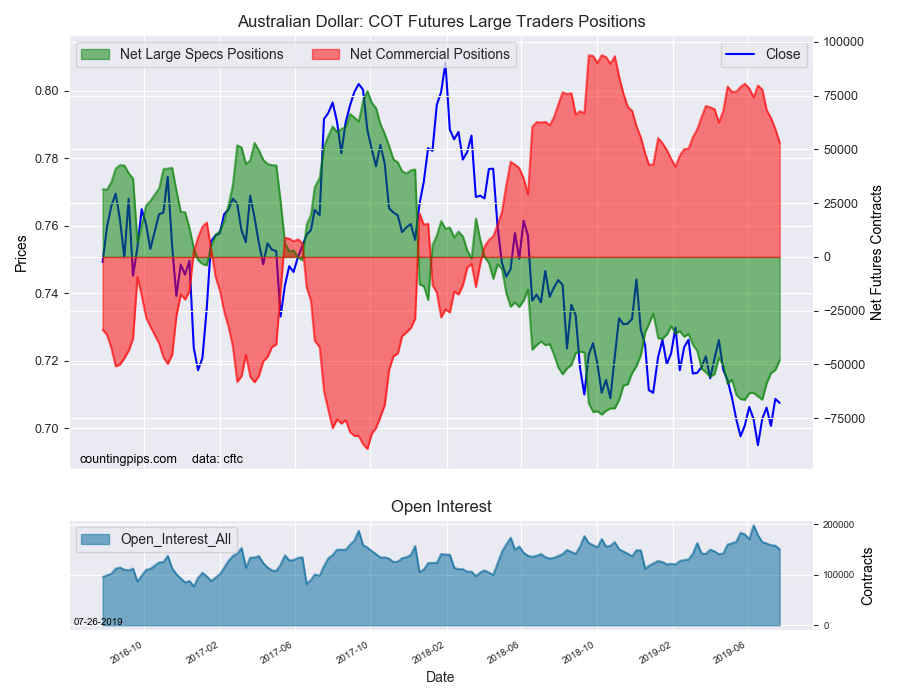
Australian dollar speculators trimmed their overall bearish position for a fourth straight week. AUD bets have been in a net short position since March 20th of 2018 which is a span of 69 weeks. Recently, despite two rate decreases by the Reserve Bank of Australia, speculators have lessened their bearish bets from -66,320 contracts on June 25th to -47,980 contracts through July 23rd (which marks the lowest bearish level since mid-April).
See the table and individual currency charts below.
Table of Large Speculator Levels & Weekly Changes:
Currency
Net Speculator Position
Specs Weekly Change
USD Index
29,128
1,796
EuroFx
-39,004
-7,653
GBP
-78,583
-2,226
JPY
-9,377
2,003
CHF
-13,193
-1,461
CAD
30,750
9,786
AUD
-47,980
4,596
NZD
-12,225
5,094
MXN
124,755
-3,366
This latest COT data is through Tuesday and shows a quick view of how large speculators or non-commercials (for-profit traders) were positioned in the futures markets. All currency positions are in direct relation to the US dollar where, for example, a bet for the euro is a bet that the euro will rise versus the dollar while a bet against the euro will be a bet that the dollar will gain versus the euro.
Weekly Charts: Large Trader Weekly Positions vs Price
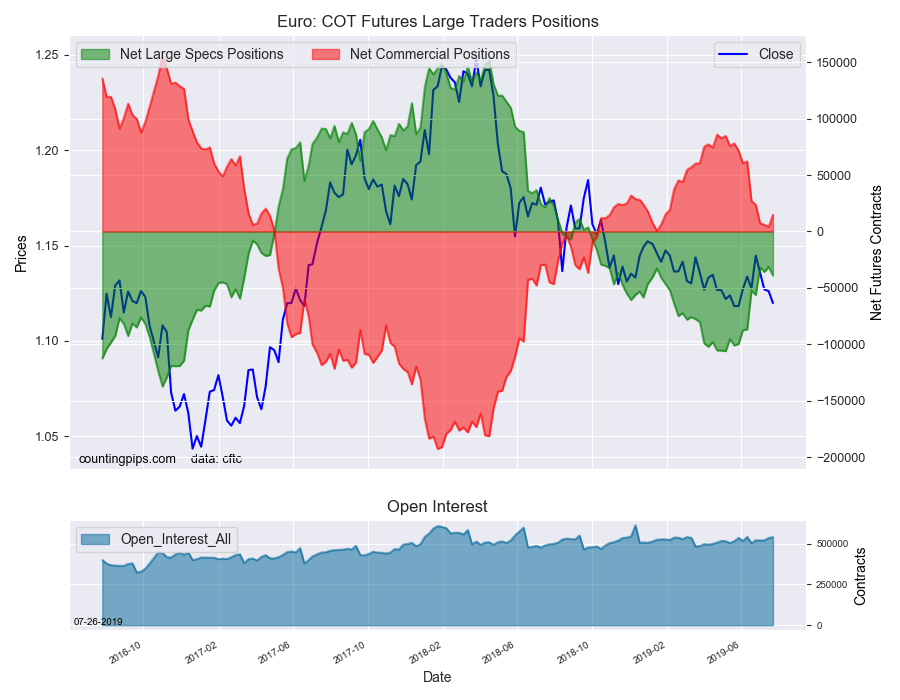
EuroFX:
The Euro large speculator standing this week totaled a net position of -39,004 contracts in the data reported through Tuesday. This was a weekly decline of -7,653 contracts from the previous week which had a total of -31,351 net contracts.
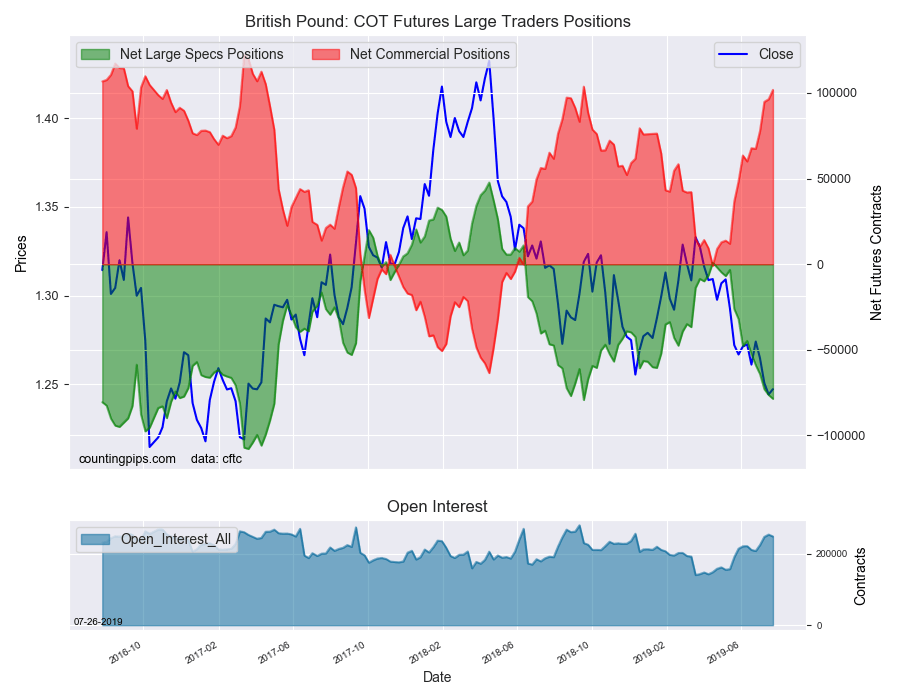
British Pound Sterling:
The large British pound sterling speculator level recorded a net position of -78,583 contracts in the data reported this week. This was a weekly lowering of -2,226 contracts from the previous week which had a total of -76,357 net contracts.
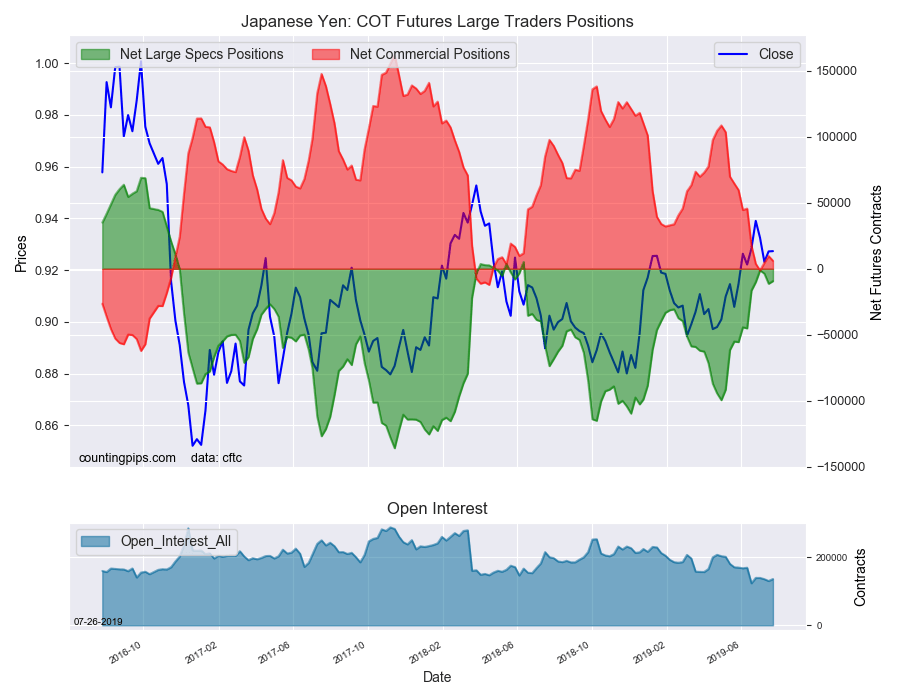
Japanese Yen:
Large Japanese yen speculators reached a net position of -9,377 contracts in this week’s data. This was a weekly lift of 2,003 contracts from the previous week which had a total of -11,380 net contracts.
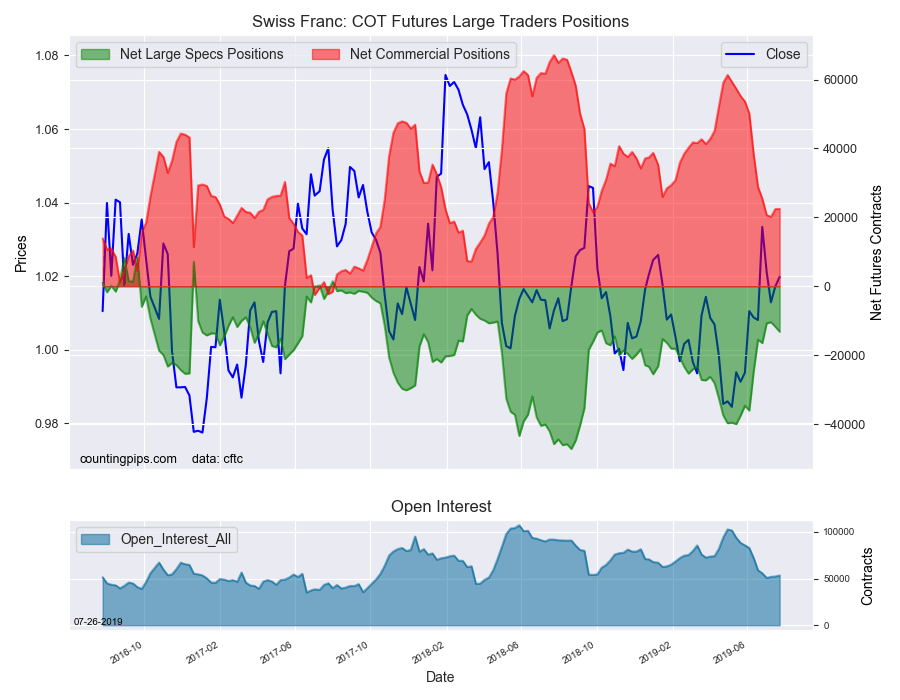
Swiss Franc:
The Swiss franc speculator standing this week was a net position of -13,193 contracts in the data through Tuesday. This was a weekly lowering of -1,461 contracts from the previous week which had a total of -11,732 net contracts.
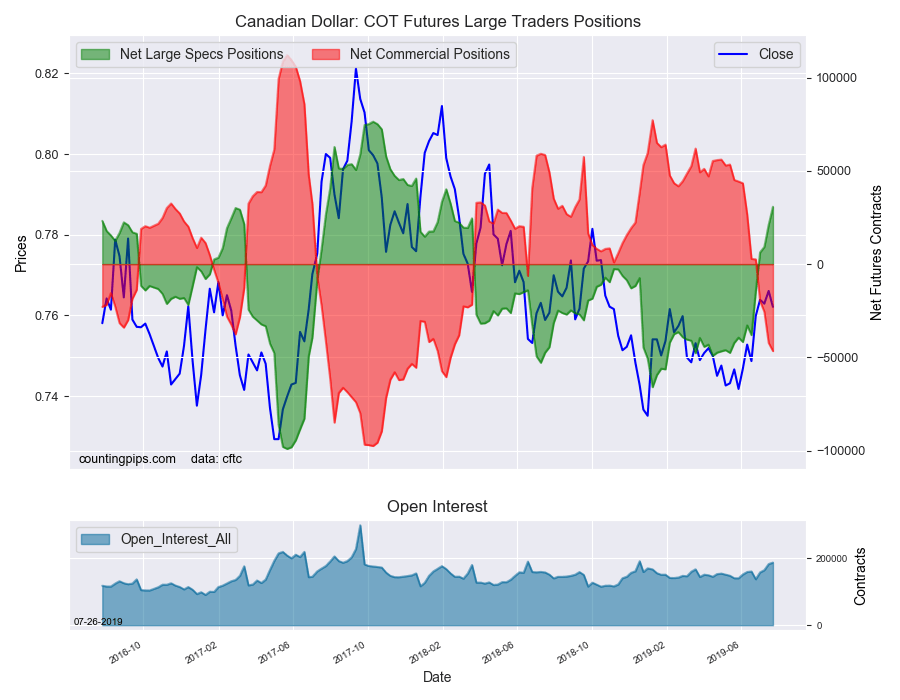
Canadian Dollar:
Canadian dollar speculators reached a net position of 30,750 contracts this week. This was a lift of 9,786 contracts from the previous week which had a total of 20,964 net contracts.
Australian Dollar:
The large speculator positions in Australian dollar futures recorded a net position of -47,980 contracts this week in the data ending Tuesday. This was a weekly advance of 4,596 contracts from the previous week which had a total of -52,576 net contracts.
New Zealand Dollar:
The New Zealand dollar speculative standing resulted in a net position of -12,225 contracts this week in the latest COT data. This was a weekly increase of 5,094 contracts from the previous week which had a total of -17,319 net contracts.
Mexican Peso:
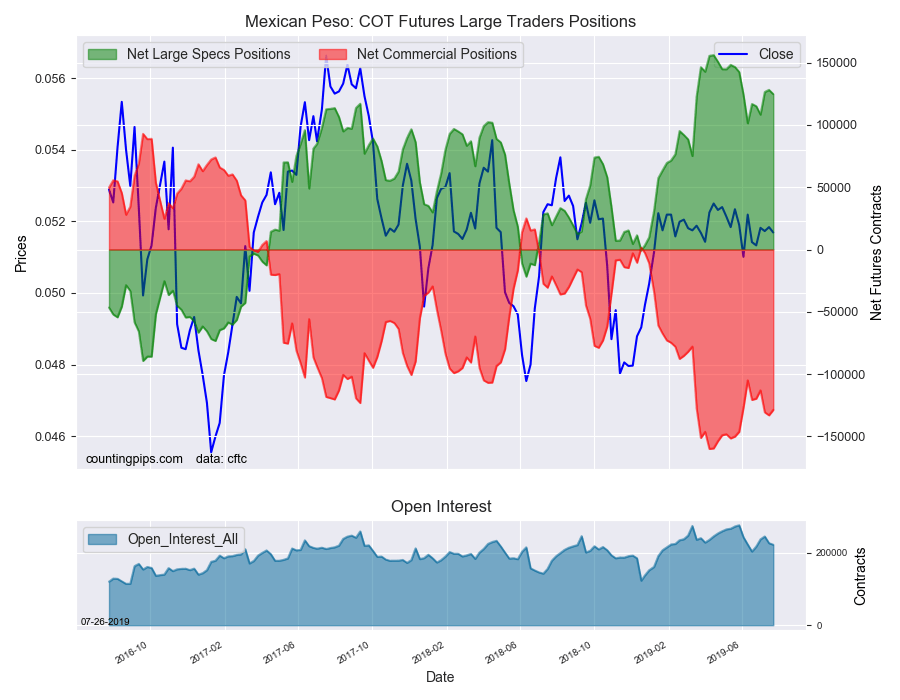
Mexican peso speculators totaled a net position of 124,755 contracts this week. This was a weekly reduction of -3,366 contracts from the previous week which had a total of 128,121 net contracts.
*COT Report: The COT data, released weekly to the public each Friday, is updated through the most recent Tuesday (data is 3 days old) and shows a quick view of how large speculators or non-commercials (for-profit traders) were positioned in the futures markets.
The CFTC categorizes trader positions according to commercial hedgers (traders who use futures contracts for hedging as part of the business), non-commercials (large traders who speculate to realize trading profits) and nonreportable traders (usually small traders/speculators).
Large energy speculators reduced their bullish net positions in the WTI Crude Oil futures markets this week, according to the latest Commitment of Traders (COT) data released by the Commodity Futures Trading Commission (CFTC) on Friday.
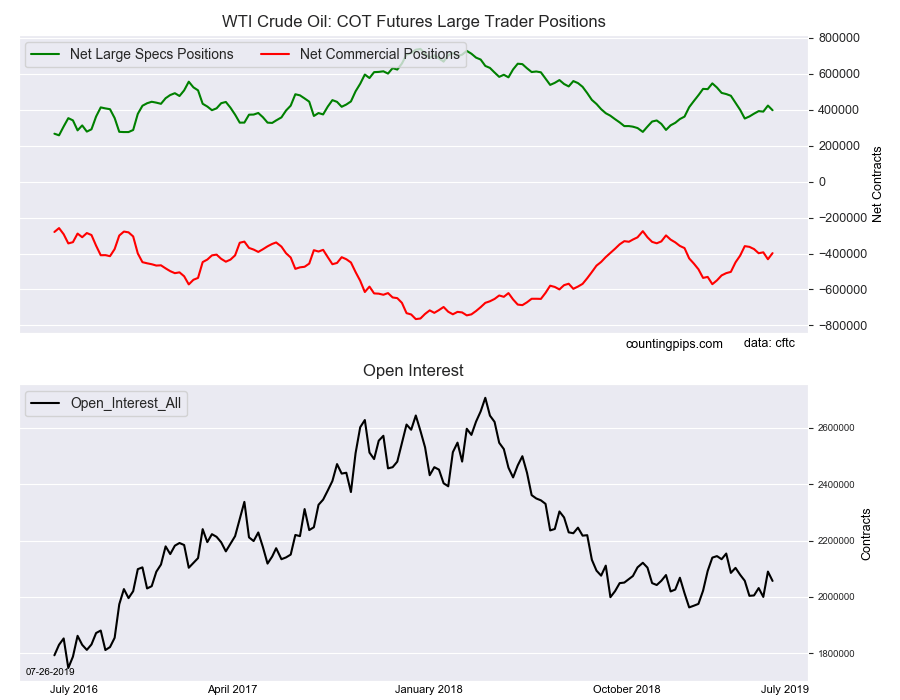
The non-commercial futures contracts of WTI Crude Oil futures, traded by large speculators and hedge funds, totaled a net position of 397,851 contracts in the data reported through Tuesday July 23rd. This was a weekly decline of -25,911 net contracts from the previous week which had a total of 423,762 net contracts.
The week’s net position was the result of the gross bullish position (longs) declining by -7,544 contracts (to a weekly total of 537,940 contracts) while the gross bearish position (shorts) rose by 18,367 contracts for the week (to a total of 140,089 contracts).
Speculators cut back this week on their bullish positions after a strong rise (+33,613 contracts) in the previous week and after pushing bullish bets higher in four out of the previous five weeks. The current speculator sentiment remains bullish with a 3.8 to 1 long to short ratio and the net position is just about right at the average bullish level for all of 2019.
WTI Crude Oil Commercial Positions:
The commercial traders position, hedgers or traders engaged in buying and selling for business purposes, totaled a net position of -397,488 contracts on the week. This was a weekly advance of 34,058 contracts from the total net of -431,546 contracts reported the previous week.
WTI Crude Oil Futures:
Over the same weekly reporting time-frame, from Tuesday to Tuesday, the WTI Crude Oil Futures (Front Month) closed at approximately $56.77 which was a decrease of $-0.85 from the previous close of $57.62, according to unofficial market data.
*COT Report: The COT data, released weekly to the public each Friday, is updated through the most recent Tuesday (data is 3 days old) and shows a quick view of how large speculators or non-commercials (for-profit traders) as well as the commercial traders (hedgers & traders for business purposes) were positioned in the futures markets.
The CFTC categorizes trader positions according to commercial hedgers (traders who use futures contracts for hedging as part of the business), non-commercials (large traders who speculate to realize trading profits) and nonreportable traders (usually small traders/speculators).
Large bond speculators increased their bearish net positions for a second straight week in the 10-Year Note futures markets this week, according to the latest Commitment of Traders (COT) data released by the Commodity Futures Trading Commission (CFTC) on Friday.
The non-commercial futures contracts of 10-Year Note futures, traded by large speculators and hedge funds, totaled a net position of -380,169 contracts in the data reported through Tuesday July 23rd. This was a weekly change of -32,947 net contracts from the previous week which had a total of -347,222 net contracts.
The week’s net position was the result of the gross bullish position (longs) decreasing by -2,482 contracts (to a weekly total of 678,489 contracts) in addition to the gross bearish position (shorts) gaining by 30,465 contracts for the week (to a total of 1,058,658 contracts).
Large speculators continued their bearish ways in the 10-Year Note futures this week with higher bearish bets for a second straight week and for the third time in four weeks.
The speculative position has been bearish dating all the way back to December of 2017 and reached an all-time record high bearish level on September 25th of 2018 with a total of -756,316 net contracts. Since then, speculator bearish positions have declined but have continued to remain overall bearish despite bonds being heavily bid throughout 2019. Speculators are usually reliable trend-followers but have been caught on the wrong side of this market so far this year.
10-Year Note Commercial Positions:
The commercial traders position, hedgers or traders engaged in buying and selling for business purposes, totaled a net position of 311,782 contracts on the week. This was a weekly boost of 22,458 contracts from the total net of 289,324 contracts reported the previous week.
10-Year Note Futures:
Over the same weekly reporting time-frame, from Tuesday to Tuesday, the 10-Year Note Futures (Front Month) closed at approximately $127.79 which was an uptick of $0.51 from the previous close of $127.28, according to unofficial market data.
*COT Report: The COT data, released weekly to the public each Friday, is updated through the most recent Tuesday (data is 3 days old) and shows a quick view of how large speculators or non-commercials (for-profit traders) as well as the commercial traders (hedgers & traders for business purposes) were positioned in the futures markets.
The CFTC categorizes trader positions according to commercial hedgers (traders who use futures contracts for hedging as part of the business), non-commercials (large traders who speculate to realize trading profits) and nonreportable traders (usually small traders/speculators).
Large precious metals speculators continued to increase their bullish net positions in the Gold futures markets this week, according to the latest Commitment of Traders (COT) data released by the Commodity Futures Trading Commission (CFTC) on Friday.
The non-commercial futures contracts of Gold futures, traded by large speculators and hedge funds, totaled a net position of 251,250 contracts in the data reported through Tuesday July 23rd. This was a weekly advance of 5,749 net contracts from the previous week which had a total of 245,501 net contracts.
The week’s net position was the result of the gross bullish position (longs) gaining by 2,346 contracts (to a weekly total of 311,881 contracts) and the gross bearish position (shorts) falling by -3,403 contracts for the week (to a total of 60,631 contracts).
Speculators continue to bet on higher gold prices as their sentiment, as expressed by bullish bets, has increased for two straight weeks and for seven out of the past eight weeks. Speculators have added +164,562 net contracts to their total bullish position over just these past eight weeks.
The current standing of net positions is above the +200,000 net contract level for a sixth consecutive week after having spent the previous seventy-one weeks below this level.
Gold Commercial Positions:
The commercial traders position, hedgers or traders engaged in buying and selling for business purposes, totaled a net position of -287,839 contracts on the week. This was a weekly fall of -10,431 contracts from the total net of -277,408 contracts reported the previous week.
Gold Futures:
Over the same weekly reporting time-frame, from Tuesday to Tuesday, the Gold Futures (Front Month) closed at approximately $1421.70 which was a gain of $10.50 from the previous close of $1411.20, according to unofficial market data.
*COT Report: The COT data, released weekly to the public each Friday, is updated through the most recent Tuesday (data is 3 days old) and shows a quick view of how large speculators or non-commercials (for-profit traders) as well as the commercial traders (hedgers & traders for business purposes) were positioned in the futures markets.
The CFTC categorizes trader positions according to commercial hedgers (traders who use futures contracts for hedging as part of the business), non-commercials (large traders who speculate to realize trading profits) and nonreportable traders (usually small traders/speculators).
Large volatility speculators pared their bearish net positions in the VIX futures markets this week, according to the latest Commitment of Traders (COT) data released by the Commodity Futures Trading Commission (CFTC) on Friday.
The non-commercial futures contracts of VIX futures, traded by large speculators and hedge funds, totaled a net position of -132,267 contracts in the data reported through Tuesday July 23rd. This was a weekly change of 9,530 net contracts from the previous week which had a total of -141,797 net contracts.
The week’s net position was the result of the gross bullish position (longs) going up by 6,239 contracts (to a weekly total of 120,035 contracts) while the gross bearish position (shorts) decreased by -3,291 contracts for the week (to a total of 252,302 contracts).
Large speculators cooled off on their bearish sentiment this week after increasing bearish positions for six straight weeks through July 16th and for eight out of nine previous weeks dating back to May 21st.
Speculators have spent most of the first half of 2019 betting on lower volatility (raising bearish bets in 22 out of 29 weeks) after a surge in volatility into the end of 2018. Recently, speculators reached a record high bearish position on April 30th at -180,359 contracts, and despite a couple of pull backs after the record, specs seem ready to challenge those record levels again.
VIX Commercial Positions:
The commercial traders position, hedgers or traders engaged in buying and selling for business purposes, totaled a net position of 147,134 contracts on the week. This was a weekly loss of -4,150 contracts from the total net of 151,284 contracts reported the previous week.
VIX Futures:
Over the same weekly reporting time-frame, from Tuesday to Tuesday, the VIX Futures (Front Month) closed at approximately $14.77 which was a shortfall of $-0.55 from the previous close of $15.32, according to unofficial market data.
*COT Report: The COT data, released weekly to the public each Friday, is updated through the most recent Tuesday (data is 3 days old) and shows a quick view of how large speculators or non-commercials (for-profit traders) as well as the commercial traders (hedgers & traders for business purposes) were positioned in the futures markets.
The CFTC categorizes trader positions according to commercial hedgers (traders who use futures contracts for hedging as part of the business), non-commercials (large traders who speculate to realize trading profits) and nonreportable traders (usually small traders/speculators).
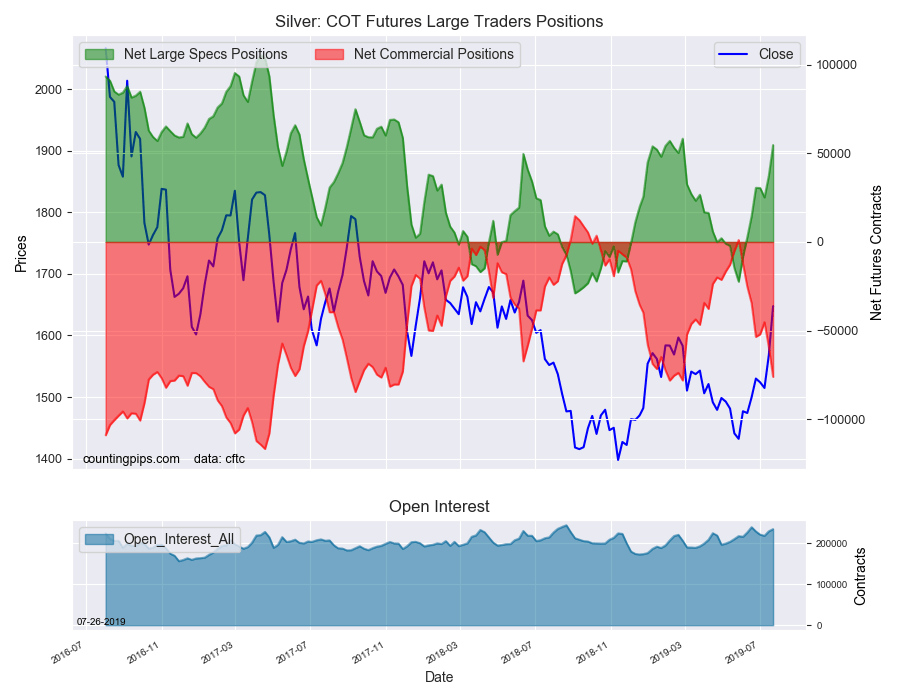
Large precious metals speculators sharply raised their bullish net positions in the Silver futures markets this week, according to the latest Commitment of Traders (COT) data released by the Commodity Futures Trading Commission (CFTC) on Friday.
The non-commercial futures contracts of Silver futures, traded by large speculators and hedge funds, totaled a net position of 54,761 contracts in the data reported through Tuesday July 23rd. This was a weekly jump of 17,336 net contracts from the previous week which had a total of 37,425 net contracts.
The week’s net position was the result of the gross bullish position (longs) gaining by 9,680 contracts (to a weekly total of 110,129 contracts) and the gross bearish position (shorts) lowering by -7,656 contracts for the week (to a total of 55,368 contracts).
The large speculators added to their existing bullish positions for a second straight week and by a total of +29,610 contracts over that period. Bullish bets have now risen by at least +10,000 contracts in six out of the past eight weeks and that positive sentiment has taken the net position from -8,443 contracts on June 4th to a total of +54,761 contracts this week.
The current bullish position is at the best level since February 26th when the total was +58,313 contracts.
Silver Commercial Positions:
The commercial traders position, hedgers or traders engaged in buying and selling for business purposes, totaled a net position of -76,138 contracts on the week. This was a weekly drop of -16,781 contracts from the total net of -59,357 contracts reported the previous week.
Silver Futures:
Over the same weekly reporting time-frame, from Tuesday to Tuesday, the Silver Futures (Front Month) closed at approximately $1647.60 which was a boost of $79.80 from the previous close of $1567.80, according to unofficial market data.
*COT Report: The COT data, released weekly to the public each Friday, is updated through the most recent Tuesday (data is 3 days old) and shows a quick view of how large speculators or non-commercials (for-profit traders) as well as the commercial traders (hedgers & traders for business purposes) were positioned in the futures markets.
The CFTC categorizes trader positions according to commercial hedgers (traders who use futures contracts for hedging as part of the business), non-commercials (large traders who speculate to realize trading profits) and nonreportable traders (usually small traders/speculators).