COTTON Analysis: Drought in India can reduce cotton harvest

By IFCMarkets

Drought in India can reduce cotton harvest

The Cotton Association of India lowered its cotton production forecast for India in the agricultural season 2018/19 by 10.3%. Will the Cotton quotations continue growing?

In the last review of the Cotton Association of India, a cotton harvest of 31.2 million kip is predicted for June (approximately 218 kg in a bale). Whereas in its October review it was expected to produce 34.8 million bales. The reduction in cotton crop forecasts is caused by a severe drought in India. According to the India Meteorological Department, in the state of Gujarat – the main cotton producer in the country, the amount of precipitation is 47% lower than last year’s level. In general, in India, since the beginning of the monsoon season on June 1, precipitation is 19% less than last year. Another positive factor for quotes was the increase in exports of American cotton per week. This was reported by U.S. Agriculture Department. On July 30, in Shanghai, US Treasury Secretary Steven Mnuchin and sales representative Robert Lighthizer will hold talks with Chinese Vice Premier Liu He about lifting a number of trade restrictions and canceling duties. In particular, China’s purchases of American cotton may be increased.

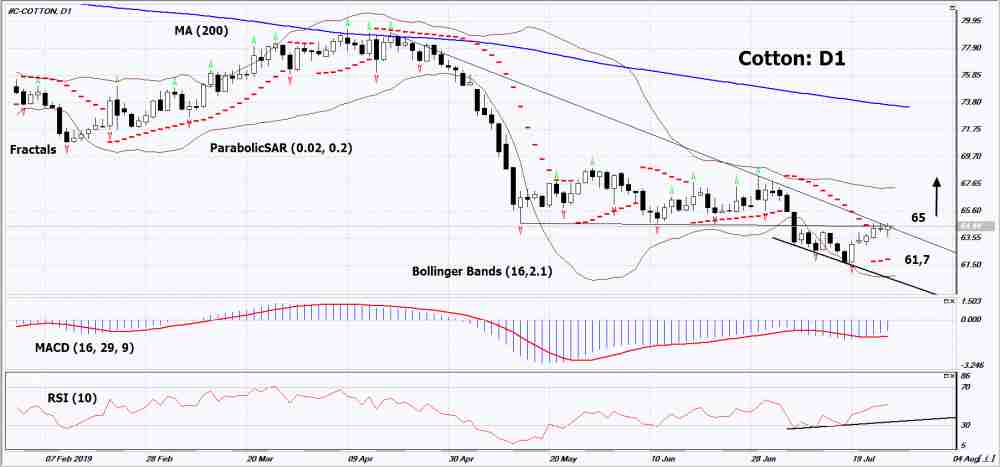
Cotton

On the daily timeframeCotton: D1 to trying to break the downtrend upward. Various technical analysis indicators formed signals for improvement. Further growth of quotations is possible in case of an increase in global demand and deterioration of the weather in India.

  • The Parabolic indicator shows a signal to increase.
  • The Bolinger bands expanded, indicating a volatility increase . Both lines of Bollinger have a slope up.
  • The RSI indicator is above the 50 mark. It has formed a divergence to increase.
  • The MACD indicator gives a bullish signal.

The bullish momentum may develop if Cotton exceeds its last maximum: 65. This level can be used as an entry point. The initial stop lose may be placed below the last lower fractal, the Parabolic signal and a 3-year low: 61.7. After opening the pending order, stop shall be moved following the signals of Bollinger and Parabolic to the next fractal minimum. Thus, we are changing the potential profit/loss to the breakeven point. More risk-averse traders may switch to the 4-hour chart after the trade and place a stop loss moving it in the direction of the trade. If the price meets the stop level (61,7) without reaching the order (65), we recommend to cancel the order: the market sustains internal changes that were not taken into account.

Technical Analysis Summary

PositionBuy
Buy stopAbove 65
Stop lossBelow 61,7

Market Analysis provided by IFCMarkets

Brexit and Boris-battered British pound hits holidaymakers

By George Prior

The Boris and Brexit-battered British pound is drastically hitting the spending power of British holidaymakers around the world for the fourth summer in a row – but there are ways to reduce the pain of the weak pound.

This is the message of Nigel Green, founder and CEO of deVere Group, one of the world’s largest independent financial advisory organizations, as the pound slid to a fresh two-year low on Monday as no-deal Brexit preparations are ramped up.

Shortly after the 2016 Brexit referendum, Mr Green launched deVere Vault an innovative global currency app and multi-currency prepaid card.

He notes: “For the fourth consecutive summer, millions of British holidaymakers are finding their spending power is negatively impacted by the beleaguered, Brexit-battered pound.

“The pound has been fallen against the euro every year since the referendum – it is now worth around 15 per cent less than before the vote.  Sterling continues to flounder since the record-breaking slide versus the single currency began in early May, hitting a two-year low on Monday.

“It’s not just those visiting the eurozone who are in for a shock either.  Overall, the pound is the worst-performing major currency in the last three months, meaning almost every destination is now more expensive than it was for Brits.”

He continues: “With no relief in sight for the pummelled pound, with buying power cut again for those going abroad for their summer getaway, it’s time to get savvy.

“One of the best way to reduce the impact is to be prepared ahead of your trip by having a prepaid multicurrency card that automatically pays in the local currency of your holiday destination. This allows you to avoid those transaction fees of, typically, 6-10 per cent – when spending abroad on a credit or debit card.

“Travellers should also try to avoid going to an ATM when overseas as they are likely to incur hefty costs for doing so.  It is better to buy the foreign currency in the UK or use that prepaid multicurrency card to withdraw rather than your UK bank card.”

Mr Green concludes: “Brexit has been a hammer-blow to the pound and this has been exacerbated by Boris Johnson becoming Prime Minister.

“As such, demand for solutions to the weak pound is set to soar by UK travellers and expatriates over the summer as sentiment towards sterling remains dismal due to an increasing probability of a Boris-driven no-deal Brexit.

“While much of the impact of no-deal will have been priced-in, it’s clear that holidaymakers do need to seek alternative ways to reduce the hit to their pockets of a poor performing pound.”

About:

deVere Group is one of the world’s largest independent advisors of specialist global financial solutions to international, local mass affluent, and high-net-worth clients.  It has a network of more than 70 offices across the world, over 80,000 clients and $12bn under advisement.

USD Strong Ahead Of FOMC

By Orbex

Dollar Drive Continues

The US Dollar has started the week on a strong footing with the USD index continuing its recent rally.The index has now broken firmly above the 97.11 level and is well on its way to testing the next resistance level around 98.30. However, the outlook over the week has heavy downside risks as the market awaits the US FOMC meeting on Wednesday. The Fed is widely expected to cut rates by .25%. There is also the risk of a larger .50% cut, which would weigh heavily on USD.

EUR Heads Lower

EURUSD has started the week under pressure. The currency has been weighed on by the stronger US dollar, as the decline from last week’s ECB meeting continues. Although the ECB kept monetary policy unchanged, Draghi noted that a rate cut in the coming months would likely be necessary. He highlighted that the central bank is also discussing other measures which can be used to tackle weak growth. EURUSD trades 1.1124 last as price breaks back under the 1.1130 level.

GBP Hits Lowest Levels Since Early 2017

GBPUSD has started the week on a very heavy note indeed with price breaking down to its lowest levels since March 2017. A combination of a stronger USD, as well as Brexit fears, is weighing on GBP. Traders will be keen to hear from the BOE on Thursday, to see whether the bank feels the risks of a no-deal Brexithave increased following Boris Johnson’s appointment as PM. GBPUSD trades 1.2335 last with price having broken under the 1.2383 level.

SPX500 Rallies Again

Risk assets have started the week in the green. Despite a stronger USD, expectations of Fed easing this week are keeping SPX500 underpinned at the 3019.38 level. While we could see some disappointment if the Fed only cuts by .25%, which is now well priced in, a .50% could see a strong move higher in equities prices. Focus will also be on the Fed’s forward guidance, with the market currently looking for another rate cut this year.

JPY & Gold Lower

Safe havens have had a softer start to the week given the backdrop of a stronger USD and higher equities prices. Both gold and JPY are lower against the dollar over early European trading on Monday. However, there is potential for sudden reversals around the FOMC later this week. USDJPY trades 108.63 last, with price turning back towards the 108.77 level following last week’s rejection. XAUUSD trades 1418.89 last, with price still sitting on the rising trend line from July lows for now.

Crude Capped by USD Strength

Oil prices have started the week on a quiet note. Last week, the EIA reported the sixth consecutive weekly decline in US crude stores which has helped assuage concerns over the demand outlook. However, the rally in USD has offset the moves in inventories, though any USD weakness later in the week could help crude rally once again. For now, crude sits at 56.27 with price remaining above the 54.85 level currently.

Commodity Currencies Start Soft

USDCAD remains well supported today with price continuing its advance above the 1.3145 level which was broken last week. The rally in USD, however, has been offset by stronger oil prices and given the potential for a USD down move in response to the Fed later this week, we are seeing some stalling in momentum.

AUDUSD keeps a bearish tone once again today with price sitting just below the .6910 support level.The market has been in a heavy decline since testing the bearish trend line from 2019 highs. Focus this week will be on headlines surrounding the US/China trade talks which could offer AUD some relief if things go well.

By Orbex


Forex Technical Analysis & Forecast 29.07.2019 (EURUSD, GBPUSD, USDCHF, USDJPY, AUDUSD, USDRUB, GOLD, BRENT)

Article By RoboForex.com

EURUSD, “Euro vs US Dollar”

EURUSD is consolidating around 1.1131. Today, the pair may continue trading downwards to break 1.1110 and then reach the short-term target at 1.1075.

EURUSD
Risk Warning: the result of previous trading operations do not guarantee the same results in the future

GBPUSD, “Great Britain Pound vs US Dollar”

After forming another consolidation range around 1.2376 and breaking it downwards, GBPUSD is still trading downwards with the short-term target at 1.2335. Later, the market may start a new correction to reach 1.2400 and then continue trading inside the downtrend towards 1.2296.

GBPUSD
Risk Warning: the result of previous trading operations do not guarantee the same results in the future

USDCHF, “US Dollar vs Swiss Franc”

USDCHF continues moving upwards. Possibly, today the pair may break 0.9944. The key upside target is at 1.0000. After that, the instrument may start another correction towards 0.9900.

USDCHF
Risk Warning: the result of previous trading operations do not guarantee the same results in the future

USDJPY, “US Dollar vs Japanese Yen”

USDJPY has formed another consolidation range around 108.68; right now, it is trading to break it to the downside and reach 108.38. After that, the instrument may return to 108.68 and then form a new descending structure to break 108.37. Later, the market may continue trading downwards with the first target at 107.95.

USDJPY
Risk Warning: the result of previous trading operations do not guarantee the same results in the future

AUDUSD, “Australian Dollar vs US Dollar”

AUDUSD is moving to reach 0.6897. Later, the market may be corrected towards 0.6970 and then continue trading inside the downtrend with the first target at 0.6870.

AUDUSD
Risk Warning: the result of previous trading operations do not guarantee the same results in the future

USDRUB, “US Dollar vs Russian Ruble”

USDRUB has broken 63.35 upwards and may continue the correction with the short-term target at 63.60. After that, the instrument may start a new decline towards 63.35 and then form one more ascending structure to reach 63.88.

USDRUB
Risk Warning: the result of previous trading operations do not guarantee the same results in the future

XAUUSD, “Gold vs US Dollar”

Gold is consolidating above 1414.30. Possibly, the pair may fall to break 1412.00 and then continue trading downwards with the short-term target at 1404.04.

GOLD
Risk Warning: the result of previous trading operations do not guarantee the same results in the future

BRENT

Brent is consolidating above 62.98. If later the price breaks this level to the downside, the instrument may start another decline to reach 61.20. However, if the pair breaks 64.00 upwards, the market may resume trading inside the uptrend with the short-term target at 66.60.

BRENT
Risk Warning: the result of previous trading operations do not guarantee the same results in the future

Article By RoboForex.com

Attention!
Forecasts presented in this section only reflect the author’s private opinion and should not be considered as guidance for trading. RoboForex LP bears no responsibility for trading results based on trading recommendations described in these analytical reviews.

Fibonacci Retracements Analysis 29.07.2019 (GOLD, USDCHF)

Article By RoboForex.com

XAUUSD, “Gold vs US Dollar”

In the H4 chart, after breaking the upside border of the consolidation range, XAUUSD has fallen to reach 23.6% fibo at 1409.43 due to the divergence. Possibly, the pair may yet continue falling to reach 38.2% fibo at 1382.66 and the fractal at 1381.69. According to the main scenario, the instrument is expected to resume trading upwards after completing the pullback. The upside targets are inside the post-correctional extension area between 138.2% and 161.8% fibo at 1460.70 and 1474.00 respectively.

GOLD_H4
Risk Warning: the result of previous trading operations do not guarantee the same results in the future

As we can see in the H1 chart, the convergence made the pair form a new pullback. In the nearest future, the price may continue trading downwards.

GOLD_H1
Risk Warning: the result of previous trading operations do not guarantee the same results in the future

USDCHF, “US Dollar vs Swiss Franc”

As we can see in the H4 chart, after being corrected to the downside by 50.0%, USDCHF is forming a new rising impulse. The upside targets are the high at 0.9951, as well as 50.0% and 61.8% fibo at 0.9960 and 1.0023 respectively. Proximity to the parity has a significant influence. The support is 61.8% fibo at 0.9792.

USDCHF_H4
Risk Warning: the result of previous trading operations do not guarantee the same results in the future

In the H1 chart, the pair is steadily trading upwards to reach its targets. At the same time, there is a possibility of a new short-term pullback towards 38.2% fibo.

USDCHF_H1

Article By RoboForex.com

Attention!
Forecasts presented in this section only reflect the author’s private opinion and should not be considered as guidance for trading. RoboForex LP bears no responsibility for trading results based on trading recommendations described in these analytical reviews.

Demand for Gold May Revive

By Dmitriy Gurkovskiy, Chief Analyst at RoboForex

At the end of July, Gold prices reached stability inside the sideways channel. On Monday July 29th, Gold is mostly trading around 1418.00.

This week, market players’ attention is focused on the US Federal Reserve meeting. It is highly anticipated, because the regulator is expected to cut the benchmark rate by 25 basis points in order to loosen its monetary policy and create some financial safety margin. The White House really needs this, so that it could continue its trade wars across the globe. However, recent macroeconomic numbers from the USA are pretty decent and do not force the Fed to cut the rate: it is apparent that the economy may be really efficient and happy with the current rate value.

If on Wednesday the regulator hints at another rate cut in September, the USD may plunge, while Gold may get significant support.

However, if the meeting goes without any surprises and the regulator refuses to comment on its plans relating to further changes in the monetary policy, the USD may slightly recover. This possibility is quite neutral for investors, but not too good for Gold, which is now acting as a “safe haven” asset for hedging risks.

In the H4 chart, Gold is forming another descending wave, the third one inside the downtrend, with the target at 1395.55. After reaching it, the pair may start another correction towards 1414.00 and then form a new descending structure with the first target at 1376.00. However, this scenario may no longer be valid if the price grows to break 1430.00. In this case, the pair may chose an alternative scenario with a new correction towards 1440.00. Later, the market may resume trading inside the downtrend with the short-term predicted target at 1395.55. From the technical point of view, this scenario is confirmed by MACD Oscillator, as its signal line is moving below 0.

As we can see in the H1 chart, XAUUSD is trading to rebound from 1424.50 to the downside. This structure may be considered as a downside continuation pattern. After breaking 1414.40, the instrument may continue falling towards 1404.10. Later, the market may start another correction to return to 1414.40 and then form a new descending structure to reach 1395.55. However, this scenario may no longer be valid if the price breaks 1430.00. In this case, the price may be corrected towards 1440.00. After that, the instrument may start a reversal pattern for a new descending wave with the target at 1395.55. From the technical point of view, this scenario is confirmed by Stochastic Oscillator, as its signal is moving below 50.00. Still, this scenario may no longer be valid if the signal line steadily moves to the upside. In case 50.00 is broken, the pair may continue growing towards 1440.00.

Disclaimer

Any predictions contained herein are based on the authors’ particular opinion. This analysis shall not be treated as trading advice. RoboForex shall not be held liable for the results of the trades arising from relying upon trading recommendations and reviews contained herein.


The Analytical Overview of the Main Currency Pairs on 2019.07.29

by JustForex

The EUR/USD currency pair

Technical indicators of the currency pair:
  • Prev Open: 1.11461
  • Open: 1.11238
  • % chg. over the last day: -0.18
  • Day’s range: 1.11203– 1.11389
  • 52 wk range: 1.1111 – 1.2009

Last week, USD strengthened against a basket of world currencies. The dollar index (#DX) updated the two-month highs and closed in the green . The USD was supported by a number of optimistic economic releases from the USA. The ECB, as expected, kept the main parameters of monetary policy at the same level. The head of the Central Bank, Mario Draghi, said interest rates would remain at or below the level until at least the end of the first half of 2020. Financial market participants expect the Fed meeting, as well as a report on the US labor market in July. At the moment, EUR/USD quotes are consolidating in the range of 1.11150-1.11450. Positions must be opened from these marks.

The Economic News Feed for 29.07.2019 is calm.

EUR/USD

Indicators point to the strength of sellers: the price has fixed below 50 MA and 100 MA.

The MACD histogram is in the negative zone and continues to decline, which signals a bearish mood.

The Stochastic Oscillator is in the neutral zone, the %K line is below the %D line, which also sends a signal to sell EUR/USD.

Trading recommendations
  • Support levels: 1.11150, 1.11000
  • Resistance levels: 1.11450, 1.11850, 1.12100

If the price consolidates below the level of 1.11150, the price will fall toward 1.10800-1.10600.

Alternatively, the price will rise toward 1.11700-1.11900.

The GBP/USD currency pair

Technical indicators of the currency pair:
  • Prev Open: 1.24828
  • Open: 1.24440
  • % chg. over the last day: -0.24
  • Day’s range: 1.24257 – 1.24596
  • 52 wk range: 1.2397 – 1.3385

The bearish mood prevails on the GBP/USD currency pair. During yesterday’s and today’s trading, the drop in quotes exceeded 50 points. The pound has updated local lows. At the moment, the key range is 1.24200-1.24550. GBP/USD quotes have the potential to further decline. Investors are concerned about the “tough” Brexit scenario. Today, financial market participants will evaluate the US GDP report. We recommend to open positions from key levels.

The Economic News Feed for 29.07.2019 is calm.

GBP/USD

Indicators do not give accurate signals: 50 MA crossed 100 MA.

The MACD histogram is in the negative zone and continues to decline, indicating a drop in GBP/USD quotes.

The Stochastic Oscillator is in the oversold zone, the %K line crossed the %D line. There are no signals at the moment.

Trading recommendations
  • Support levels: 1.24200, 1.23850
  • Resistance levels: 1.24550, 1.24900, 1.25200

If the price consolidates below 1.24200, the price will fall toward 1.23850-1.23600.

Alternatively, the quotes will grow toward 1.24800-1.25000.

The USD/CAD currency pair

Technical indicators of the currency pair:
  • Prev Open: 1.31395
  • Open: 1.31556
  • % chg. over the last day: +0.14
  • Day’s range: 1.31528 – 1.31683
  • 52 wk range: 1.2727 – 1.3664

The USD/CAD currency pair has once again shifted to growth. CAD updated local maxima. At the moment, the USD/CAD quotes are consolidating near the resistance level of 1.31700. Mark 1.31450 is already a “mirror” support. Trading instrument has the potential for further growth. Financial market participants expect a report on US GDP. We also recommend to pay attention to the dynamics of oil prices. Positions must be opened from key levels.

The Economic News Feed for 29.07.2019 is calm.

USD/CAD

Indicators point to the strength of buyers: the price has fixed above 50 MA and 100 MA.

The MACD histogram is in the positive zone and continues to rise, which signals a further increase in the USD/CAD quotes.

The Stochastic Oscillator is in the neutral zone, the %K line is above the %D line, which also indicates bullish moods.

Trading recommendations
  • Support levels: 1.31450, 1.31200, 1.30950
  • Resistance levels: 1.31700, 1.32000

If the price consolidates above the level of 1.31700, the price will grow toward 1.32000-1.32200.

Alternatively, the price will drop toward 1.31200-1.31000.

The USD/JPY currency pair

Technical indicators of the currency pair:
  • Prev Open: 108.648
  • Open: 108.629
  • % chg. over the last day: -0.03
  • Day’s range: 108.419 – 108.686
  • 52 wk range: 104.97 – 114.56

USD/JPY stabilized after a significant increase last week. At the moment, the trading instrument is consolidating. Unidirectional trend is not observed. The key support and resistance levels are 108.450 and 108.750, respectively. USD / JPY quotes have the potential for further growth. We recommend to pay attention to the dynamics of the yield of US government securities. Positions must be opened from key levels.

The Economic News Feed for 29.07.2019 is calm.

USD/JPY

The price fixed above 50 MA and 100 MA which points to the power of the buyers.

The MACD histogram is above 0. There are no signals.

The Stochastic Oscillator is in the neutral zone, the %K line is above the %D line which gives a signal to buy USD/JPY.

Trading recommendations
  • Support levels: 108.450, 108.250, 108.000
  • Resistance levels: 108.750, 109.000

If the price fixed above 108.750, expect further growth toward 109.000-109.200.

Alternatively, the price will descend toward 108.250-108.100.

by JustForex

(Part II) US Stocks Seem To Be Following Our Predictions – Get Ready

By TheTechnicalTraders.com

In the first part of this multi-part technology sector research post, we highlighted our previous research and predictive modeling result that suggest the US and global stock markets are poised for a peak/roll-over within the next 30+ days.  Our predictive modeling systems and cycle analysis tools are pointing to August 19, 2019, critical inflection date that we believe will become the “breakdown date” for this next big move to the downside.

Part of our effort to help skilled technical traders is to provide research posts, like these, that highlight trade setups and allow our followers to understand the type of trading opportunities that are present for them to consider in the future.  We believe the next 30+ days will prove our predictions are accurate and that the US/Global stock markets will roll-over into a new bearish trend – likely breaking downward near August 19, 2019.

With this in mind, Part II will continue to explore trade setups and opportunities related to our belief that the NQ/Technology Sector will become one of the biggest rotations when this move happens.

NQ/TECS price prediction

Our downside NQ price prediction supports a hedging trade in TECS for skilled technical traders.  If our predictions are accurate, then the risk levels for a strategic trade in TECS are only about 10% to 15% from current price levels and the upside profit potential is 12% to 35% (or more).  We are actively seeking an entry price near recent lows in TECS (near $11 or lower) over the next 2+ weeks as we watch the US stock market continue to attempt to push to new highs.

TNA, Small Cap Bull ETF

The TNA, Small Cap Bull ETF, is often a leader for the US major markets.  This Weekly chart highlights the weakness that is found in the Small Caps compared to the NQ chart above.  While the NQ chart has continued to push higher, the TNA chart has rolled-over and has weakened substantially from the October to December 2018 rotation.  It is our belief that the continued price weakness in the Small Caps will provide a leading price confirmation of the US major markets price rotation downward over the next few weeks and months.

We also believe the Transportation Index (TRAN) will lead the markets lower over the next few weeks and months.  Skilled traders must learn to search for these market-leading triggers/signals to stay ahead of the next big price swings.

So, within this article, we’ve highlighted three incredible trading opportunities and setups for skilled technical traders.  Each one is aligned to a single event that may happen in the future and each one varies in the price level, scale, and scope for different skill levels of traders. The opportunities for these types of trades in 2019 and 2020 keep setting up over and over again.  We believe the next 2 to 3 years are going to continue to create incredible opportunities for us as technical traders. You can become a technical trader with us before Aug 1st if you ack now!

There are dozens of great trades setting up right now in preparation for the August 19 price peak/price rotation that we predicted months ago.  The markets are setting up for some really big swing trades and we urge all traders/investors to be prepared for these moves by joining my Wealth Building Newsletter

5 other crucial warning signs about the US markets topping and the pending gold and silver bull market

In early June I posted a detailed video explaining in showing the bottoming formation and gold and where to spot the breakout level, I also talked about crude oil reaching it upside target after a double bottom, and I called short term top in the SP 500 index. This was one of my premarket videos for members it gives you a good taste of what you can expect each and every morning before the Opening Bell. Watch Video Here.

I then posted a detailed report talking about where the next bull and bear markets are and how to identify them. This report focused mainly on the SP 500 index and the gold miners index. My charts compared the 2008 market top and bear market along with the 2019 market prices today. See Comparison Charts Here.

On June 26th I posted that silver was likely to pause for a week or two before it took another run up on June 26. This played out perfectly as well and silver is now head up to our first key price target of $17. See Silver Price Cycle and Analysis.

More recently on July 16th, I warned that the next financial crisis (bear market) was scary close, possibly just a couple weeks away. The charts I posted will make you really start to worry. See Scary Bear Market Setup Charts.

CONCLUDING THOUGHTS:

In short, you should be starting to get a feel of where stocks are headed along with precious metals for the next 8-24 months. The next step is knowing when and what to buy and sell as these turning points take place, and this is the hard part. If you want someone to guide you through the next 12-24 months complete with detailed market analysis and trade alerts (entry, targets and exit price levels) join my ETF Trading Newsletter.

Be prepared for these incredible price swings before they happen and learn how you can identify and trade these fantastic trading opportunities in 2019, 2020, and beyond with our  Wealth Building & Global Financial Reset Newsletter.  You won’t want to miss this big move, folks.  As you can see from our research, everything has been setting up for this move for many months.

Join me with a 1 or 2-year subscription to lock in the lowest rate possible and ride my coattails as I navigate these financial market and build wealth while others lose nearly everything they own during the next financial crisis.

As a technical analysis and trader since 1997, I have been through a few bull/bear market cycles. I believe I have a good pulse on the market and timing key turning points for both short-term swing trading and long-term investment capital. The opportunities starting to present themselves will be life-changing if handled properly.

FREE GOLD OR SILVER WITH MEMBERSHIP!

Kill two birds with one stone and subscribe for two years to get your FREE PRECIOUS METAL and get enough trades to profit through the next metals bull market and financial crisis!

Chris Vermeulen – www.TheTechnicalTraders.com


The US Dollar Is in the Green. Investors Are Focused on Geopolitical Events

by JustForex

On Friday, the US dollar rose against a basket of major currencies and reached two-month highs. The US dollar index (#DX) closed in the green zone (+0.20%). Positive economic data from the US supported the American currency. Thus, US GDP (q/q) grew by 2.1% in the second quarter, while experts expected growth by 1.8%. This week, investors will be focused on the Fed’s monetary policy decision. Experts expect that the regulator will reduce the interest rate for the first time in more than a decade due to the slowdown of economic growth and inflation. The Fed meeting will take place on July 31. Investors will closely monitor the comments by representatives of the Central Bank.

Also, financial market participants will be focused on trade negotiations between the United States and China. US Trade Representative, Robert Lighthizer, and US Treasury Secretary, Steven Mnuchin, will travel to Shanghai for a new round of talks with Chinese representatives on Tuesday. China’s Vice Premier, Liu He, will lead the trade delegation for China’s part.

UK Foreign Secretary, Dominic Raab, said that the UK accelerated preparations for “hard” Brexit – without an agreement with Brussels. The official reported that the new Prime Minister, Boris Johnson, made the decision and the Cabinet supported him.

The “black gold” prices are consolidating. At the moment, futures for the WTI crude oil are testing the mark of $56.25 per barrel.

Market Indicators

On Friday, the bullish sentiment was observed in the US stock markets: #SPY (+0.67%), #DIA (+0.17%), #QQQ (+1.03%).

The 10-year US government bonds yield has moved away from local highs. Currently, the indicator is at the level of 2.06-2.07%.

The news feed for 2019.07.29:

Today, the publication of important economic news is not expected.

by JustForex

DAX30 CFD landing between 12,300 and 12,450 before the Fed

By Admiral Markets

Source: Economic Events July 29, 2019 – Admiral Markets’ Forex Calendar

With a very thin economic calendar today, Monday, and the Fed rate decision coming on Wednesday, we want to focus now on the technical picture in the DAX30 CFD.

After the ECB “delivered”, as expected, a very dovish statement last Thursday with keeping interest rates unchanged, but an adjusted forward guidance which allows rate cuts, but also rate tiering (to relieve pressure on European banks resulting out of a collapse in yields) and QE in the near-term, the comments from ECB president Draghi that no rate cuts were discussed at the meeting among board members, pushing the German index aggressively lower.

Interesting enough, the DAX30 CFD found support around 12,300 points, but couldn’t recapture the region around 12,440/460 points into the weekly close.

In our opinion, this should be seen as the trading floor in which the German index will trade at least until the Fed on Wednesday.

Still, since the 1980s Equity markets have seen a drift higher in the hours before the Fed rate decision, expecting an equity-friendly stance.

That said, we tend to see a higher likelihood of an attempt to break above 12,440/460 points which could open the door for further gains up to 12,600 points.

On the downside a break below 12,300 points levels the path down to 12,150/200 points:

Source: Admiral Markets MT5 with MT5-SE Add-on DAX30 CFD Hourly chart (between 09 July 2019 to 26 July 2019). Accessed: 26 July 2019 at 10:00 PM GMT – Please note: Past performance is not a reliable indicator of future results, or future performance.

Source: Admiral Markets MT5 with MT5-SE Add-on DAX30 CFD daily chart (between 17 April 2018 to 26 July 2019). Accessed: 26 July 2019 at 10:00 PM GMT – Please note: Past performance is not a reliable indicator of future results, or future performance.

In 2014, the value of the DAX30 CFD increased by 2.65%, in 2015, it increased by 9.56%, in 2016 it increased by 6.87%, in 2017 it increased by 12.51%, in 2018 it fell by 18.26%, meaning that after five years, it was up by 10.5%.

Investing in Forex with Admiral Markets

Admiral Markets offers professional traders the ability to trade with a custom, upgraded version of MetaTrader 5, allowing you to experience trading at a significantly higher, more rewarding level. Experience benefits such as the addition of the Market Heat Map, so you can compare various currency pairs to see which ones might be lucrative investments, access real-time trading data, and so much more. Click the banner below to start your FREE download of MT5 Supreme Edition!

Download MetaTrader 5 and begin trading today!

Disclaimer: The given data provides additional information regarding all analysis, estimates, prognosis, forecasts or other similar assessments or information (hereinafter “Analysis”) published on the website of Admiral Markets. Before making any investment decisions please pay close attention to the following:

  1. This is a marketing communication. The analysis is published for informative purposes only and are in no way to be construed as investment advice or recommendation. It has not been prepared in accordance with legal requirements designed to promote the independence of investment research, and that it is not subject to any prohibition on dealing ahead of the dissemination of investment research.
  2. Any investment decision is made by each client alone whereas Admiral Markets shall not be responsible for any loss or damage arising from any such decision, whether or not based on the Analysis.
  3. Each of the Analysis is prepared by an independent analyst (Jens Klatt, Professional Trader and Analyst, hereinafter “Author”) based on the Author’s personal estimations.
  4. To ensure that the interests of the clients would be protected and objectivity of the Analysis would not be damaged Admiral Markets has established relevant internal procedures for prevention and management of conflicts of interest.
  5. Whilst every reasonable effort is taken to ensure that all sources of the Analysis are reliable and that all information is presented, as much as possible, in an understandable, timely, precise and complete manner, Admiral Markets does not guarantee the accuracy or completeness of any information contained within the Analysis. The presented figures refer that refer to any past performance is not a reliable indicator of future results.
  6. The contents of the Analysis should not be construed as an express or implied promise, guarantee or implication by Admiral Markets that the client shall profit from the strategies therein or that losses in connection therewith may or shall be limited.
  7. Any kind of previous or modeled performance of financial instruments indicated within the Publication should not be construed as an express or implied promise, guarantee or implication by Admiral Markets for any future performance. The value of the financial instrument may both increase and decrease and the preservation of the asset value is not guaranteed.
  8. The projections included in the Analysis may be subject to additional fees, taxes or other charges, depending on the subject of the Publication. The price list applicable to the services provided by Admiral Markets is publicly available from the website of Admiral Markets.
  9. Leveraged products (including contracts for difference) are speculative in nature and may result in losses or profit. Before you start trading, you should make sure that you understand all the risks.

By Admiral Markets
