Crude Higher But Capped By FOMC

By Orbex

Seventh Straight Fall in Crude Stores

Crude oil prices have been higher once again this week. The latest industry data showed US crude stores having fallen once again last week. The API reported a further drawdown on Tuesday, which was then confirmed by the EIA in its headline report on Wednesday.

The last report from the Energy Information Administration, covering the week ending July 26th, showed that US crude stores fell a further 8.5 million barrels. This latest decline, which was well above the forecasted 25 million barrel decrease, marks the seventh consecutive week of declines in US crude inventories.

Gasoline & Diesel Stores Down

The data also reflected a further move lower in US gasoline inventories, which fell by 1.8 million barrels over the week. This, again, outstripped forecasts of a 1.4 million barrel decline. Distillate stockpiles, which include diesel and heating oil, also declined last week. These moved lower by 894k barrels, though this was just under the forecasted 1 million barrel decline.

Libya Supply Outage in Focus

Crude oil has also been supported this week by other elements. The main Sharara oil field in Libya, the country’s largest production site, reportedly closed on Tuesday due to a malfunction with a valve connecting the pipelines to the Zawiya oil terminal. The issue, which is ongoing, has seen Libya oil output dropping to post-March lows.

Middle East Tensions Underpinning Oil

Ongoing tensions in the Middle East have also played a role in keeping oil upside intact. The recent seizure of a UK oil tanker by Iran has prompted the US to formally request that Germany join the efforts of itself, France and the UK in securing the Strait of Hormuz.

This key shipping channel has been the source of a great deal of tension recently. Ongoing issues there are posing the very real risk of military conflict between the US and Iran, which is keeping oil underpinned for now.

Trade Talks Disappoint

The market has also been keeping a close eye on a fresh round of trade talks between the US and China.While early optimism around the trade talks helped boost oil earlier in the week, traders reacted with clear disappointment as the talks concluded without any notable sign of progress.

The White House has said that talks will continue in September. However, the lack of detail around them suggests that no real progress was made. The collapse of trade talks earlier in the year was a major downside driver for oil. So, the market is hopeful that this latest round of negotiations can deliver a deal.That being said, should the market starts to perceive that as unlikely, oil could well come under further pressure again.

USD Rallies on FOMC

Finally, the FOMC on Wednesday was a disappointing blow for crude bulls. USD surged higher in response to the Fed’s .25% rate cut. Such a move was well priced in and had even less impact as the Fed noted that it did not expect this to be the start of a lengthy easing cycle, just a mid-cycle adjustment.

Technical Perspective

WTI crude oil

For now, crude continues to trade within a triangular range, framed by the bearish trend line from 2019 highs and the bullish trend line from 2019 lows. To the topside, the next key structural level is the 60.00 zone. Above there, we have the 63.39 highs coming in ahead of 2019 highs at 66.59. To the downside, we have the 54.94 level, ahead of 2019 lows at 50.78.

By Orbex
 

Japanese Candlesticks Analysis 01.08.2019 (USDCAD, AUDUSD)

Article By RoboForex.com

USDCAD, “US Dollar vs Canadian Dollar”

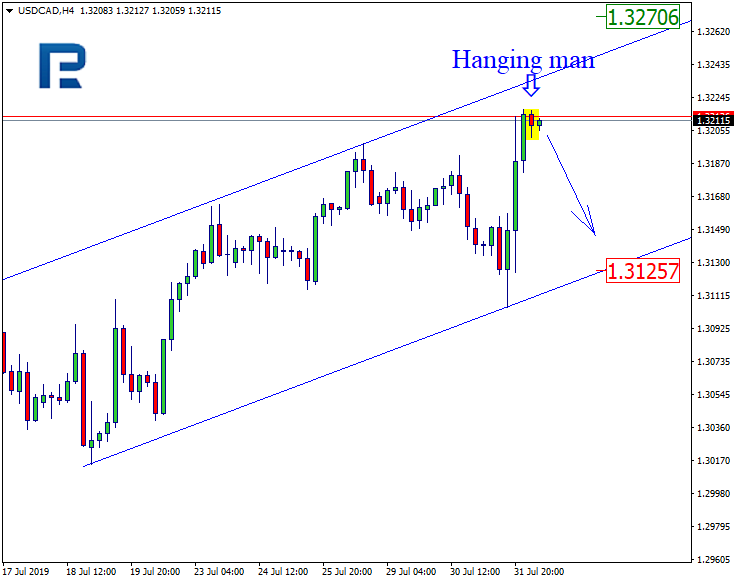
As we can see in the H4 chart, USDCAD is testing the resistance level within the uptrend and has already formed several reversal candlesticks, including Hanging Man pattern. Right now, the pair is still testing the level. Possibly, the price may rebound from the resistance line and go back to 1.3125. However, we shouldn’t ignore a possibility that the instrument may move sideways without reversing, break the channel’s upside border, and continue its growth to reach 1.3270.

USDCAD
Risk Warning: the result of previous trading operations do not guarantee the same results in the future

AUDUSD, “Australian Dollar vs US Dollar”

As we can see in the H4 chart, the pair is forming the descending channel. Right now, AUDUSD is testing the support level and forming Hammer and Inverted Hammer reversal patterns. Judging by the previous movements, we may assume that the price is going to rebound from this level. The upside target is at 0.6918. However, we shouldn’t ignore a possibility that the instrument may break the support level and continue falling to reach 0.6787.

AUDUSD
Risk Warning: the result of previous trading operations do not guarantee the same results in the future

Article By RoboForex.com

Attention!
Forecasts presented in this section only reflect the author’s private opinion and should not be considered as guidance for trading. RoboForex LP bears no responsibility for trading results based on trading recommendations described in these analytical reviews.

Sterling Static on Super Thursday Snoozefest

By Lukman Otunuga, Research Analyst, ForexTime

The thickening fog of uncertainty around Brexit has prevented the Bank of England (BoE) from joining the global monetary easing train this month.

With just less than 100 days to go before the United Kingdom leaves the European Union, the BoE has left interest rates unchanged at 0.75%. The unending uncertainty over Brexit, disappointing economic data and the possibility of inflation rising have certainly placed the central bank in a tricky position.

It is remarkable how the BoE excluded the possibility of a no-deal Brexit in its new forecasts. This is quite alarming and questions whether there is a disconnect between the central bank and markets, given how fears remain elevated over a “no-deal” Brexit becoming reality. The GDP growth for 2019 was downgraded to 1.3%, down from 1.5% in May while inflation is seen exceeding its 2% target in two and three years.

Overall, the tone of the statement and press conference was clearly mixed as Carney took extra care when answering any questions revolving around a “no-deal” Brexit.

Although the BoE stated that “interest rates could move in either direction if there’s a no-deal Brexit”, the central bank’s next move is likely to be an interest rate cut to support the UK economy. Although the probability of a cut in September is extremely low, the BoE could surprise markets if economic conditions deteriorate further and uncertainty over Brexit intensifies.

Taking a look at the technical picture, the Pound offered a muted reaction to the BoE rate decision and Carney’s press conference. Price action suggests that the currency is more concerned with Brexit headlines, and this will be a key theme until the October 31st deadline.
The GBPUSD remains bearish on the weekly charts. With bears firmly fastened into the driving seat, the downside momentum has the potential to send prices towards 1.2000 in the short to medium term.


Disclaimer: The content in this article comprises personal opinions and should not be construed as containing personal and/or other investment advice and/or an offer of and/or solicitation for any transactions in financial instruments and/or a guarantee and/or prediction of future performance. ForexTime (FXTM), its affiliates, agents, directors, officers or employees do not guarantee the accuracy, validity, timeliness or completeness, of any information or data made available and assume no liability as to any loss arising from any investment based on the same.


Forex-Time-LogoArticle by ForexTime

ForexTime Ltd (FXTM) is an award winning international online forex broker regulated by CySEC 185/12 www.forextime.com

The Analytical Overview of the Main Currency Pairs on 2019.08.01

by JustForex

The EUR/USD currency pair

Technical indicators of the currency pair:
  • Prev Open: 1.11545
  • Open: 1.10757
  • % chg. over the last day: -0.75
  • Day’s range: 1.10337– 1.10805
  • 52 wk range: 1.1034 – 1.1817

Yesterday, the USD significantly strengthened against a basket of world currencies. EUR/USD quotes fell by more than 100 points and updated key extremes. The Fed, as expected, lowered its key interest rate range by 25 basis points to 2.00-2.25%. This event has already been priced. At the same time, the head of the Central Bank, Jerome Powell, said that lowering the base interest rate is not the beginning of easing the monetary policy. Additional support for the US dollar was provided by positive statistics on the labor market published by ADP. Currently, the EUR/USD currency pair is consolidating in the range of 1.10350-1.10800. You should open positions from key levels.

The Economic News Feed for 01.08.2019:

  • – Manufacturing PMI (GER) – 10:55 (GMT+3:00);
  • – Initial Jobless Claims (US) – 15:30 (GMT+3:00);
  • – Manufacturing PMI by ISM (US) – 17:00 (GMT+3:00);
EUR/USD

Indicators point to the strength of sellers: the price has fixed below 50 MA and 100 MA.

The MACD histogram is in the negative zone and below the signal line, which gives a strong signal to sell EUR/USD.

Stochastic Oscillator is in the neutral zone, the %K line is above the %D line, which indicates the correction of the EUR/USD currency pair.

Trading recommendations
  • Support levels: 1.10350, 1.10000
  • Resistance levels: 1.10800, 1.11150, 1.11600

If the price consolidates below 1.10350, expect a further drop toward 1.10000.

Alternatively, the quotes can correct toward 1.11100-1.11300.

The GBP/USD currency pair

Technical indicators of the currency pair:
  • Prev Open: 1.21472
  • Open: 1.21512
  • % chg. over the last day: +0.02
  • Day’s range: 1.21009 – 1.21614
  • 52 wk range: 1.2101 – 1.3385

GBP/USD is still dominated by bearish sentiment. The hard Brexit scenario continues to put pressure on pound. Demand for the USD grew after comments by the head of the Fed. At the moment, GBP/USD quotes are consolidating in the range 1.21000-1.21600. Participants in financial markets expect a meeting of the Bank of England. Experts predict that the regulator will leave the basic parameters of monetary policy unchanged. We recommend that you pay attention to the comments of representatives of the Central Bank. Positions must be opened from key levels.

The Economic News Feed for 01.08.2019:

  • – Manufacturing PMI (UK) – 11:30 (GMT+3:00);
  • – Key Interest Rate announcement (UK) – 14:00 (GMT+3:00);
GBP/USD

Indicators signal the strength of sellers: the price has fixed below 50 MA and 100 MA.

The MACD histogram is in the negative zone and below the signal line, which gives a strong signal to sell GBP/USD.

The Stochastic Oscillator is in the neutral zone, the %K line crossed the %D line. There are no signals at the moment.

Trading recommendations
  • Support levels: 1.21000, 1.20500
  • Resistance levels: 1.21600, 1.22500, 1.23000

If the price consolidates below 1.21000, expect a further descend toward 1.20600-1.20400.

Alternatively, the price could recover toward 1.22200-1.22500.

The USD/CAD currency pair

Technical indicators of the currency pair:
  • Prev Open: 1.31507
  • Open: 1.31891
  • % chg. over the last day: +0.36
  • Day’s range: 1.31822 – 1.32187
  • 52 wk range: 1.2727 – 1.3664

The USD/CAD has moved up again. The trading tool has updated the key extremes. The demand for the USD rose after the Fed meeting. CAD is currently testing a local resistance of 1.32200. 1.31850 is already a “mirror” support. USD/CAD quotes have the potential for further growth. Today we recommend to pay attention to economic reports from the USA. Positions must be opened from key levels.

The Economic News Feed for 01.08.2019 is calm.

USD/CAD

Indicators point to the strength of buyers: the price has fixed above 100 MA.

The MACD histogram is in the positive zone and above the signal line, which gives a strong signal to buy USD/CAD.

The Stochastic Oscillator is in the neutral zone, the %K line crossed the %D line. There are no signals at the moment.

Trading recommendations
  • Support levels: 1.31850, 1.31500, 1.31200
  • Resistance levels: 1.32200, 1.32500

If the price consolidates above 1.32200, expect further growth toward 1.32500-1.32700.

Alternatively, the price can drop toward 1.31700-1.31500.

The USD/JPY currency pair

Technical indicators of the currency pair:
  • Prev Open: 108.612
  • Open: 108.747
  • % chg. over the last day: +0.19
  • Day’s range: 108.699 – 109.318
  • 52 wk range: 104.97 – 114.56

On the USD/JPY currency pair, bullish sentiment prevails. During yesterday’s and today’s trading, the growth of quotations exceeded 60 points. The trading tool found resistance at 109.300. Mark 108.900 is already a “mirror” support. Greenback demand remains high after the Fed meeting. The USD/JPY currency pair has the potential for further growth. Today we recommend paying attention to statistics from the United States. Positions must be opened from key levels.

The Economic News Feed for 01.08.2019 is calm.

USD/JPY

Indicators point to the strength of buyers: the price has fixed above 100 MA.

The MACD histogram is in the positive zone and above the signal line, which gives a strong signal to buy USD/JPY.

The Stochastic Oscillator is in the neutral zone, the %K line is below the %D line, which points to the correction of USD/JPY quotes.

Trading recommendations
  • Support levels: 108.900, 108.450, 108.250
  • Resistance levels: 109.300, 109.500

If the price consolidates above 109.300, expect further growth of the USD/JPY to 109.500-109.800.

Alternatively, the price could decrease toward 108.600-108.450.

by JustForex

Markets Tank On Fed Rate Cut

By Orbex

The Federal Reserve Bank cut interest rates for the first time in more than a decade. The Fed funds rates were lowered to 2.0%-2.25% on Wednesday. Fed Chair Jerome Powell cautioned that the rate cut was not the start of an easing bias, but merely a mid-cycle adjustment. This was seen to be less dovish than anticipated, pulling down major markets by close of the day. Gold fell 1.31% while the S&P500 and the Dow Jones Index fell 1.23% and 1.09% respectively. The US dollar index rose to a new two-year high, currently at 98.60.

Euro Slips to New Two-Year Low

The common currency extended declines on the back of a stronger greenback. The euro fell to 1.1032 before closing the day at 1.1040. This marked a new two-year low in the currency pair. Earlier in the day, flash GDP estimates for the second quarter showed that the EU economy grew just 0.2%, down from 0.4% in the first quarter.

EURUSD at Risk of Further Declines

The downside breakout in the currency pair has sent the EURUSD to break past the trend line as well. In the near term, we could expect to see some consolidation, but further declines are expected. An unfilled gap from April 2017 near 1.0725 remains the next major support to the downside.

EURUSD

Crude Oil Recovers from Recent Slump

WTI Crude oil prices were seen posting some modest gains, recovering off the lows at 55.50. The modest recovery in oil prices came amid mixed fundamentals. While on one hand oil prices were under pressure due to a stronger USD, the ongoing tensions with Iran have offset the declines. This has kept oil prices flat for the most part over the week.

Will WTI Crude Oil Extend Gains?

With oil prices reclaiming the 57.50 level of resistance, we now expect the upside to prevail. However, this remains the case as long as the resistance level of 57.50 acts as support. The upside resistance now is back at the 60.00 handle. We could expect to see gradual gains. A break down below 57.50 could keep price declines limited to the 54.00 handle.

WTI

Gold Slips to a Two-Week Low

The precious metal closed bearish by Wednesday’s close of business. This came amid the Fed’s forward guidance which was less dovish than expected. Gold prices had previously priced in the Fed rate cut and maintained gains in anticipation that further rate cuts could be required down the line.

XAUUSD Could Turn Flat

Following Wednesday’s price action, gold prices have touched down to the lower support at 1404. This could potentially keep the precious metal to move flat in the near term. The upper resistance at 1431–1428 could keep a lid on the gains. A breakout from either of these levels is required to establish further direction.

Gold

By Orbex


The US Dollar Is in The Green After the Fed Meeting

by JustForex

The US dollar strengthened significantly against a basket of major currencies after the Fed meeting. Yesterday, the US regulator lowered the interest rate by 0.25 percentage points to 2.00-2.25% for the first time in 10 years. At the same time, Fed Chairman, Jerome Powell, announced at a press conference after the Fed meeting that he did not expect a long series of rate cuts. In addition, the regulator ended the program of “quantitative tightening” two months earlier than planned. The US dollar index (#DX) closed in the positive zone (+0.55%).

Optimistic economic data from the US supported the American currency. Thus, ADP nonfarm employment change increased by 156K in July, although investors forecasted growth by 150K.

Some reports on the economies of the Eurozone and Canada were also published yesterday. So, the unemployment rate in Germany counted to 1K in July, while experts expected 2K. The Eurozone consumer price index rose by 1.1% in July, which met the forecasts. Eurozone GDP (y/y) rose by 1.1% instead of 1.0%. Canada’s GDP (m/m) grew by 0.2% in May, while experts expected 0.1%.

The “black gold” prices have moved away from local highs. Currently, futures for the WTI crude oil are testing the $57.85 mark per barrel.

Market Indicators

Yesterday, aggressive sales were observed in the US stock markets: #SPY (-1.09%), #DIA (-1.25%), #QQQ (-1.38%).

The 10-year US government bonds yield is at the level of 2.02-2.03%.

The news feed for 2019.08.01:

– German manufacturing PMI at 10:55 (GMT+3:00);
– UK manufacturing PMI at 11:30 (GMT+3:00);
– Bank of England inflation report at 14:00 (GMT+3:00);
– Bank of England interest rate decision at 14:00 (GMT+3:00);
– ISM manufacturing PMI at 17:00 (GMT+3:00).

by JustForex

EURUSD: test of 1.10 likely

By Alpari.com

Previous:

On Wednesday the 31st of July, trading on the EURUSD pair closed down by 0.72% (80 pips), and if we include today’s trading, it’s declined by a total of 1.19% (130 pips). The euro collapsed against the dollar after the announcement of the Federal Reserve’s interest rate decision.

At the end of their two-day meeting, the FOMC decided to lower the Federal Funds Rate by 25 base points to a range of 2 – 2.25%. Only Esther George and Eric Rosengren voted to maintain the key rate at its current level. Jerome Powell remarked that this rate slash is aimed at pushing inflation up to its target level and that this does not mark the beginning of a series of consecutive rate reductions.

Another negative for the euro was the sharp decline on the EURGBP pair. This comes following a sustained rise on this cross pair amid Brexit uncertainty.

Day’s news (GMT+3):

  • 10:45 France: Markit manufacturing PMI (Jul).
  • 10:55 Germany: Markit manufacturing PMI (Jul).
  • 11:00 Eurozone: Markit manufacturing PMI (Jul).
  • 12:30 UK: Markit manufacturing PMI (Jul).
  • 14:00 UK: BoE interest rate decision.
  • 14:30 UK: BoE’s Governor Carney speech.
  • 15:30 US: initial jobless claims (26 Jul).
  • 16:45 US: Markit manufacturing PMI (Jul).
  • 17:00 US: ISM manufacturing PMI (Jul).

EURUSD H1Current situation:

The 1.11 mark was tested, as expected. The pair initially dropped to the 112th degree, before continuing to the 135th degree in the Asian session.

There are two bottoms on the hourly chart without a bullish divergence. I don’t think we’ll get a correction until the euro hits fresh lows. There were a lot of put options at 1.11, which have now been cashed in on. The market remains highly volatile. Be ready for the EURUSD pair to undergo a correction after hitting fresh lows, with a recovery above 1.11. The situation doesn’t look good for traders currently with put options, 80% of which are expected to close at a loss. I’m expecting a drop to the D3 line at 1.1015.

By Alpari.com

Markets unimpressed with the Fed rate cut

By Hussein Sayed, Chief Market Strategist (Gulf & MENA), ForexTime

The US Federal Reserve cut its interest rates by 25 basis points on Wednesday for the first time since the global financial crisis hit the global economy in 2008. The central bank also announced to end its balance sheet reduction immediately, which was supposed to occur in September. Typically easing monetary policy is intended to boost risk assets and lower the currency. However, the reaction in financial markets was totally the opposite following the announcement. The US Dollar rose to a two-year high against the Euro, and stocks suffered steep losses after Fed Chair Powell’s press conference.

What went wrong?

The rate cut was fully baked into asset prices before heading into yesterday’s monetary policy meeting. Some market participants were even anticipating a more aggressive 50 basis point cut, but it was mainly the forward guidance that upset the markets.

“Let me be clear: What I said was it’s not the beginning of a long series of rate cuts”, said Jerome Powell.

Investors had been expecting the beginning of an easing cycle that may extend beyond 2020. This wasn’t the message they got from Chair Powell. While Powell didn’t rule out further rate cuts, he didn’t see Wednesday’s decision as the beginning of an extended easing cycle. Instead, he explained that their decision is a mid-cycle adjustment to policy. His press conference has created more confusion than clarity, leaving markets guessing the next step.

Given that two members from the Federal Reserve – Eric Rosengren and Esther George voted against the FOMC decision to lower rates suggests that not all members agree to Powell’s economic assessment. If dissenters increase in upcoming meetings, the central bank’s independency will come into question.

Back to ‘good news is bad news’

It seems we’re returning to an era where good news is bad news to equities. With markets still anticipating a 54% chance of a rate cut in September according to CME Fed watch, this percentage may move either direction with the release of economic data. An upside surprise on Friday’s non-farm payrolls report may significantly lower expectations of further easing in the upcoming FOMC meeting in September, especially if wage growth beats market expectations.  So, expect an upside surprise in tomorrow’s data releases to be negative news for equity markets and vice versa.

BoE mission is more complicated

The focus today turns to the Bank of England (BoE) and Sterling. Mark Carney has an even tougher job than Fed Chair Jerome Powell, given the fact that we’re less than three months away from the Brexit deadline. With the possibility of the UK crashing out of the EU without a deal having increased significantly, the assumption of gradual tightening in monetary policy is no longer realistic.

The BoE’s forecast for inflation and growth is not likely to be the major barometer for where interest rates are heading next, unless they publish forecasts under a deal and no-deal scenario. Overall, we expect rates to be kept on hold at 0.75% and the Brexit topic to dominate Carney’s press conference. Unless the BoE reiterates that tighter monetary policy may be needed, expect Sterling’s slide to resume.

Disclaimer: The content in this article comprises personal opinions and should not be construed as containing personal and/or other investment advice and/or an offer of and/or solicitation for any transactions in financial instruments and/or a guarantee and/or prediction of future performance. ForexTime (FXTM), its affiliates, agents, directors, officers or employees do not guarantee the accuracy, validity, timeliness or completeness, of any information or data made available and assume no liability as to any loss arising from any investment based on the same.


Forex-Time-LogoArticle by ForexTime

ForexTime Ltd (FXTM) is an award winning international online forex broker regulated by CySEC 185/12 www.forextime.com

ISM Manufacturing PMI To Improve In July

By Orbex

The Institute of Supply Management will be releasing the closely watched leading indicator covering manufacturing activity.

According to the economists polled, the median expectations point to a modest increase to 52.7 in July. This follows the drop to 51.7 in June which marked a third consecutive monthly decline in the index.

However, with the index still above 50, the PMI activity in the manufacturing sector is still in expansionary mode.

While the headline print might seem optimistic, the trend of PMI data, particularly over the past year, has been somewhat lower. And, so far, there is still no sign of a bottom in place.

ISM Manufacturing PMI
ISM Manufacturing PMI, June 2019

However, if the data indicates an uptick from July, we could perhaps expect manufacturing growth to rise once again. But it would still be too early to tell. Focus will be on the sub-components of the ISM’s manufacturing report.

In June, the new orders were unchanged on the month. When taken in combination with production and employment growth, the figures were disappointing. The data underlined the slowdown in the manufacturing sector.

It was surprising, therefore, to see that the initial GDP estimates for the three months ending June 2019 were much lower compared to the year before.

Part of the declines in manufacturing is attributed to global economic uncertainty. There are a number of factors at play. However, the US trade policy further raises the risks of a downturn.

Regional Manufacturing Activity Picks up in June

One of the key data points to look at when setting expectations for the ISM manufacturing PMI is the regional dataOver the past few weeks, we have received regional manufacturing activity reports. These include the New York area, Philadelphia, Chicago and Richmond, among others.

Almost all the reports indicated a pickup in growth. However, most of the headline figures were driven by a modest increase in orders. Firms were optimistic of the business conditions in the near term.

The headline increase has evidently resulted in a slight increase in the ISM index forecasts. However, despite that, the data is yet to show strong evidence of growth.

Compared to the ground conditions, the US-China trade uncertainty remains the elephant in the room. While both countries have called for a temporary truce, business conditions are still suffering the impact of uncertainty.

Considering the fact that the US economy is enjoying one of the strongest economic expansion patches, a decline in manufacturing activity is not expected. The question remains whether this will signal the start of a slowdown, which is already evident, or whether it is an indicator of an impending recession.

Will Manufacturing Shift Gears in Q3?

Historically, the second quarter in the US economy is often one of the strongest. This is because it coincides with the April – June period where most of the activity takes place.

Businesses plan ahead for the summer months which often sees an increase in all-round activity, manufacturing included. This leads to higher activity during the period, as reflected in the second quarter GDP performance.

Typically, growth tends to slow off into the third and fourth quarter periods. Given the fact that the Q2 GDP data has been one of the weakest in recent times, the data underlines the larger concerns.

Investors are likely to brush aside a positive outcome of today’s ISM report unless there is a larger deviation from the forecasts. On the other hand, a negative outcome could most likely not see much of a reaction.

It would, at best, corroborate the recent monetary policy action from the Fed which cut interest rates for the first time since 2015. A move closer to the 50-level on the index could, however, raise panic.

This could eventually push the Fed to do more by lowering interest rates further.

By Orbex


Equities retreat as FED cuts rates but rules out significant easing

By IFCMarkets

Dollar strengthens despite Fed’s stopping of quantitative tightening

US stock indexes retreat deepened on Wednesday as the Federal Reserve cut interest rates quarter point but indicated this was not “the beginning of a long series of rate cuts.” The S&P 500 fell 1.1% to 2980. The Dow Jones industrial average lost 1.2% to 26864. Nasdaq composite index tumbled 1.2% to 8175. The dollar strengthening accelerated despite Fed statement it would stop reducing its $3.6 trillion in bond holdings starting August 1, two months ahead of schedule. The live dollar index data show the ICE US Dollar index, a measure of the dollar’s strength against a basket of six rival currencies, jumped 0.6% to 98.59 and is higher currently. Stock index futures point to mixed market openings today

DAX 30 lead European indexes rebound

European stocks paused their retreat on Wednesday ahead of US Federal Reserve interest rate decision. EUR/USD joined GBP/USD’s continued slide yesterday with both pairs falling currently. The Stoxx Europe 600 edged up 0.2%. Germany’s DAX 30 rose 0.3% to 12189.04. France’s CAC 40 inched up 0.1% but UK’s FTSE 100 slid 0.8% to 7586.78.

Nikkei rises while other Asian indexes fall

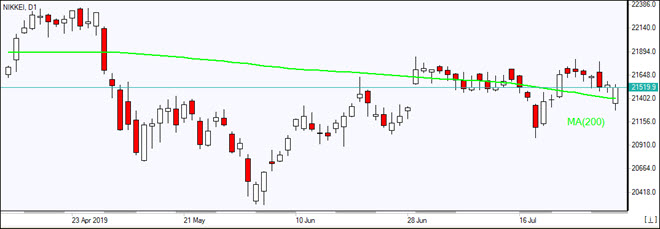
Asian stock indices retreat slowed today as US-China trade negotiations concluded in Shanghai with no major breakthrough with talks expected to continue in Washington in September. However China did agree to buy more US agricultural products. Nikkei however managed to end 0.1% higher at 21540.99 with yen accelerating its slide against the dollar. Chinese stocks are falling despite Caixin report China’s manufacturing improved in June: the Shanghai Composite Index is down 0.8% and Hong Kong’s Hang Seng Index is 0.6% lower. Australia’s All Ordinaries Index extended its losses 0.4% as Australian dollar climb against the greenback resumed.

Nikkei closes above MA(200)    08/01/2019 Market Overview IFC Markets chart

Brent gains after seventh straight weekly decline is US inventories

Brent futures prices are inching higher today. Prices rose yesterday after the Energy Information Administration report US crude inventories dropped by above expected 8.5 million barrels last week while gasoline inventories fell by 1.8 million. October Brent crude rose 0.7% to $65.05 a barrel on Wednesday.

Market Analysis provided by IFCMarkets

Note:
This overview has an informative and tutorial character and is published for free. All the data, included in the overview, are received from public sources, recognized as more or less reliable. Moreover, there is no guarantee that the indicated information is full and precise. Overviews are not updated. The whole information in each overview, including opinion, indicators, charts and anything else, is provided only for familiarization purposes and is not financial advice or а recommendation. The whole text and its any part, as well as the charts cannot be considered as an offer to make a deal with any asset. IFC Markets and its employees under any circumstances are not liable for any action taken by someone else during or after reading the overview.