By Hussein Sayed, Chief Market Strategist (Gulf & MENA), ForexTime
Investors in Asia woke up on Monday to a sea of red in equity and currency markets. Japan and South Korea’s stock indices fell more than 2%, while Hong Kong’s equities faced an even steeper fall of more than 3% with political tensions continuing to escalate further. Treasury bonds, Gold, and the Japanese Yen are where investors are taking refuge in what seems to be a never-ending trade dispute between the world’s two largest economies.
Markets have not been expecting the latest US-China trade talks to conclude with any significant breakthrough last week, but very few expected President Trump to slap 10% tariffs on $300 billion worth of Chinese goods. China’s commerce ministry vowed to retaliate with the necessary countermeasures, but no further details were announced.
China still has a few tools to respond to the latest US tariffs, whether it’s through halting imports of American agricultural products, prohibiting exports of rare-earth materials, stopping the purchase of US debt, or further increasing tariffs on US goods. However, none of these tactics are enough to offset the impact of the additional tariffs on more than $500 billion worth of Chinese goods.
Is Currency the new option?
The Renminbi broke above Rmb7 per USD this morning after the People’s Bank of China (PBoC) set the midpoint at 6.9225. This is the first time since May 2008 that the Chinese currency trades above the key psychological level of 7. The PBoC has spent hundreds of billions of Dollars over the past couple of years to prevent their currency from breaching this key level, but now that doesn’t seem to be the case. In fact, the currency tool may be very effective as it significantly offsets the impact of US tariffs. If the Chinese currency falls by another 8% from the current level, the 10% tariffs paid by US importers will be offset by the Renminbi’s weakness.
While currency depreciation also has a negative effect such as the risk of capital outflow, as long as the decline is orderly, volatility is contained, and speculation activities are controlled, the risks will be minimized.
No one knows when this trade war will end, but it is becoming more likely that it will be after the US 2020 elections. We don’t think that this trade war will do any good to President Trump in the upcoming election, especially given the several swing states that are already hurt by the current trade dispute.
Until then expect volatility to return to global financial markets with safe haven assets to be the main beneficiaries. Out of all safe haven assets, Gold will be our favorite, especially if this trade war gets out of hand.
Disclaimer: The content in this article comprises personal opinions and should not be construed as containing personal and/or other investment advice and/or an offer of and/or solicitation for any transactions in financial instruments and/or a guarantee and/or prediction of future performance. ForexTime (FXTM), its affiliates, agents, directors, officers or employees do not guarantee the accuracy, validity, timeliness or completeness, of any information or data made available and assume no liability as to any loss arising from any investment based on the same.
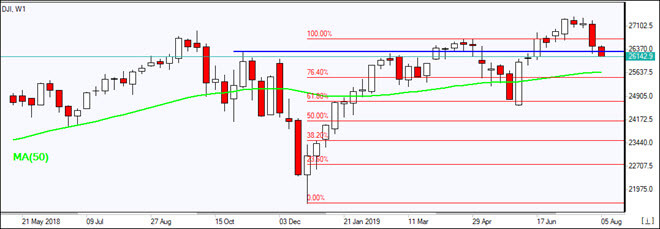
US stock indexes losses continued on Friday despite strong labor market data. The S&P 500 lost 0.7% to 2932.05, falling 3.1% for the week. Dow Jones industrial slid 0.4% to 26485. The Nasdaq fell 1.3% to 8004.07. The dollar weakening accelerated despite report average hourly earnings rose 3.2% year-over-year in July while unemployment ticked up to 3.7% from 3.6%. The live dollar index data show the ICE US Dollar index, a measure of the dollar’s strength against a basket of six rival currencies, fell 0.3% to 98.07 and is lower currently. Stock index futures point to lower market openings today
CAC 40 leads European indexes retreat
European stocks pulled back on Friday on intensified global slowing concerns after US threat of new tariff on Chinese goods if Chinese side doesn’t move faster in bilateral US-China trade talks. GBP/USD joined EUR/USD’s continued recovery on Friday with euro higher currently while Pound’s slide resumed. The Stoxx Europe 600 Index tumbled 2.7% Friday. The DAX 30 fell 3.1% to 11872.44. France’s CAC 40 tumbled 3.6% and UK’s FTSE 100 fell 2.3% to 7407.06.
Hang Seng still loss leader among Asian indexes
Asian stock indices are falling today against the background of escalating US-China trade standoff as protesters in Hong Kong called for a general strike. Nikkei fell 1.7% to 20720.29 as yen continued its climb against the dollar. China’s markets are retreating as investors watch for yuan fluctuations after central bank said it had resources to keep the currency stable following the breach of seven yuan for dollar level: the Shanghai Composite Index is down 1.6% and Hong Kong’s Hang Seng Index is 2.9% lower. Australia’s All Ordinaries Index extended losses 1.9% despite the accelerating Australian dollar slide against the greenback.
Brent futures prices are edging lower today on world growth slowing concerns. Prices rose on Friday: Brent for October settlement ended 2.3% higher at $61.89 a barrel Friday, nevertheless closing 2.3% lower for the week.
Note: This overview has an informative and tutorial character and is published for free. All the data, included in the overview, are received from public sources, recognized as more or less reliable. Moreover, there is no guarantee that the indicated information is full and precise. Overviews are not updated. The whole information in each overview, including opinion, indicators, charts and anything else, is provided only for familiarization purposes and is not financial advice or а recommendation. The whole text and its any part, as well as the charts cannot be considered as an offer to make a deal with any asset. IFC Markets and its employees under any circumstances are not liable for any action taken by someone else during or after reading the overview.
The company’s latest science, presented at a recent conference, is discussed in a ROTH Capital Partners report.
In a July 31 research note, ROTH Capital Partners analyst Yasmeen Rahimi reported that Daré Bioscience Inc. (DARE:NASDAQ) presented two posters on the use of FT-Raman spectroscopy in evaluating drug stability in its intravaginal rings (IVR), on July 22 and 23 at the 2019 Controlled Release Society Annual Meeting & Exposition in Spain.
The data that Daré shared strongly validated this approach and its ability to measure a drug’s release and concentration in intravaginal ring (IVR) therapies. This is significant because both measures are key to pharmacodynamics and efficacy of Daré’s IVR therapies, currently DARE-FRT1 for pregnancy maintenance and DARE-HRT1 for menopause symptoms.
There also is a need for measuring the stability of a drug or drugs in Daré’s IVR therapies because of a process used in developing them: hot melt extrusion (HME), which can alter a drug’s properties.
HME is used to allow delivery, through the IVR, of multiple drugs with varying molecular weights and drugs with lower solubility or bioavailability. This controlled delivery is one feature that sets apart Daré’s IVR platform from the competition.
“We view this as an important milestone assuring quality control on the road to commercialization for the two novel intravenous ring therapies,” Rahimi commented.
The first poster, “Use of FT-Raman Spectroscopy to Assess 17-Beta-Estradiol/Progesterone Ethylene Vinyl Acetate-Based Intravaginal Rings,” showed that spectroscopy effectively and reliably assayed levels of the two hormones in IVRs during manufacturing and after one and three months of storage.
The second poster, “Determination of Drug Crystallinity in Hot Melt Extruded Ethylene Vinyl Acetate Copolymer,” demonstrated that in an EVA IVR ring with 28% vinyl acetate, the contained compounds can be identified and their state determined.
“Based on these examples of strong, solid science, we are confident Daré has developed quality control steps to optimize IVR manufacturing,” noted Rahimi.
ROTH has a Buy rating and a $6 per share target price on Daré, whose current share price is around $0.76.
Disclosure: 1) Doresa Banning compiled this article for Streetwise Reports LLC and provides services to Streetwise Reports as an independent contractor. She or members of her household own securities of the following companies mentioned in the article: None. She or members of her household are paid by the following companies mentioned in this article: None. 2) The following companies mentioned in this article are billboard sponsors of Streetwise Reports: None. Click here for important disclosures about sponsor fees. 3) Comments and opinions expressed are those of the specific experts and not of Streetwise Reports or its officers. The information provided above is for informational purposes only and is not a recommendation to buy or sell any security. 4) The article does not constitute investment advice. Each reader is encouraged to consult with his or her individual financial professional and any action a reader takes as a result of information presented here is his or her own responsibility. By opening this page, each reader accepts and agrees to Streetwise Reports’ terms of use and full legal disclaimer. This article is not a solicitation for investment. Streetwise Reports does not render general or specific investment advice and the information on Streetwise Reports should not be considered a recommendation to buy or sell any security. Streetwise Reports does not endorse or recommend the business, products, services or securities of any company mentioned on Streetwise Reports. 5) From time to time, Streetwise Reports LLC and its directors, officers, employees or members of their families, as well as persons interviewed for articles and interviews on the site, may have a long or short position in securities mentioned. Directors, officers, employees or members of their immediate families are prohibited from making purchases and/or sales of those securities in the open market or otherwise from the time of the interview or the decision to write an article until three business days after the publication of the interview or article. The foregoing prohibition does not apply to articles that in substance only restate previously published company releases.
Disclosures from ROTH Capital Partners, Daré Bioscience Inc., Company Note, July 31, 2019
Regulation Analyst Certification (“Reg AC”): The research analyst primarily responsible for the content of this report certifies the following under Reg AC: I hereby certify that all views expressed in this report accurately reflect my personal views about the subject company or companies and its or their securities. I also certify that no part of my compensation was, is or will be, directly or indirectly, related to the specific recommendations or views expressed in this report.
Within the last twelve months, ROTH has received compensation for investment banking services from Daré Bioscience, Inc.
ROTH makes a market in shares of Daré Bioscience, Inc. and as such, buys and sells from customers on a principal basis.
Shares of Daré Bioscience, Inc. may be subject to the Securities and Exchange Commission’s Penny Stock Rules, which may set forth sales practice requirements for certain low-priced securities.
Within the last twelve months, ROTH has managed or co-managed a public offering for Daré Bioscience, Inc.
ROTH Capital Partners, LLC expects to receive or intends to seek compensation for investment banking or other business relationships with the covered companies mentioned in this report in the next three months.
This West Nile virus test and others including cancer diagnostic tests in the Utah company’s pipeline are discussed in an H.C. Wainwright & Co. report.
In a July 31 research note, H.C. Wainwright & Co. analyst Yi Chen reported the market has increasingly adopted Co-Diagnostics Inc.’s (CODX:NASDAQ) Vector Smart North American Mosquito (NAM) test for the presence of West Nile virus, since the test’s launch earlier in the month.
Press reports indicate mosquito abatement districts are using the test and thereby improving public health, Chen noted. For instance, the presence of West Nile virus was reported as far west as Utah and as far east as New York this mosquito season.
Chen pointed out how Co-Diagnostics’ NAM-W test differentiates itself from other lab tests for the West Nile virus. With NAM-W, the test result is available within a day versus one to two weeks, and more affordably, “thus enabling mosquito control activities to be accurate, efficient and effective.”
NAM-W also can detect the presence of St. Louis encephalitis and western equine encephalitis in mosquito populations. Co-Diagnostics is developing a NAM-E test to identify mosquito-borne eastern equine encephalitis in humans. That potentially lethal virus was detected in Florida just this week.
The company also plans to develop a Vector Smart version of its Logix Smart ZDC (Zika-dengue-chikungunya) multiplex test optimized for mosquito populations.
“The company’s CoPrimer-based multiplex polymerase chain reaction (PCR) test solutions for mosquito-borne diseases are positioned to be the most competitive available on the market and should be increasingly adopted by abatement districts and research institutions alike across the U.S. in the coming months,” commented Chen.
Growth for the biotech also should come in increasing sales from Co-Diagnostics’ joint venture in India, CoSara Diagnostics. “This business ought to serve as the main driver of topline revenue growth in the near term,” Chen indicated.
Another area in which Co-Diagnostics is developing diagnostic products is cancer. Recently, the company achieved positive results from a study to detect cancer mutations, specifically 10 associated with nonsmall cell lung cancer, in circulating free DNA, using its CoPrimer technology. The CoPrimer-based PCR test showed high sensitivity, identifying the mutations at the lowest possible percentage available.
“These results indicate that CoPrimer-based PCR tests can be used for cancer diagnostics, including companion diagnostics for therapeutics as well as monitoring of treatment response and detection of drug resistance,” wrote Chen. Immediate uptake of and reimbursement for Co-Diagnostics’ cancer diagnostic tests are expected when they hit the market because of the technology’s level of sensitivity and specificity and the product’s affordability. CoPrimer tests can be conducted on PCR instruments already in the field; no investment in added equipment is needed.
Further updates from Co-Diagnostics on its cancer diagnosis programs are likely in 2019 with introduction of its first cancer test in 2020.
H.C. Wainwright has a Buy rating and a $2 per share price target on Co-Diagnostics, whose stock is currently trading at around $1.24 per share.
Disclosure: 1) Doresa Banning compiled this article for Streetwise Reports LLC and provides services to Streetwise Reports as an independent contractor. She or members of her household own securities of the following companies mentioned in the article: None. She or members of her household are paid by the following companies mentioned in this article: None. 2) The following companies mentioned in this article are billboard sponsors of Streetwise Reports: None. Click here for important disclosures about sponsor fees. 3) Comments and opinions expressed are those of the specific experts and not of Streetwise Reports or its officers. The information provided above is for informational purposes only and is not a recommendation to buy or sell any security. 4) The article does not constitute investment advice. Each reader is encouraged to consult with his or her individual financial professional and any action a reader takes as a result of information presented here is his or her own responsibility. By opening this page, each reader accepts and agrees to Streetwise Reports’ terms of use and full legal disclaimer. This article is not a solicitation for investment. Streetwise Reports does not render general or specific investment advice and the information on Streetwise Reports should not be considered a recommendation to buy or sell any security. Streetwise Reports does not endorse or recommend the business, products, services or securities of any company mentioned on Streetwise Reports. 5) From time to time, Streetwise Reports LLC and its directors, officers, employees or members of their families, as well as persons interviewed for articles and interviews on the site, may have a long or short position in securities mentioned. Directors, officers, employees or members of their immediate families are prohibited from making purchases and/or sales of those securities in the open market or otherwise from the time of the interview or the decision to write an article until three business days after the publication of the interview or article. The foregoing prohibition does not apply to articles that in substance only restate previously published company releases.
Disclosures from H.C. Wainwright & Co., Co-Diagnostics Inc., Company Update, July 31, 2019
Investment Banking Services include, but are not limited to, acting as a manager/co-manager in the underwriting or placement of securities, acting as financial advisor, and/or providing corporate finance or capital markets-related services to a company or one of its affiliates or subsidiaries within the past 12 months.
I, Yi Chen, Ph.D. CFA and Raghuram Selvaraju, Ph.D., certify that 1) all of the views expressed in this report accurately reflect my personal views about any and all subject securities or issuers discussed; and 2) no part of my compensation was, is, or will be directly or indirectly related to the specific recommendation or views expressed in this research report; and 3) neither myself nor any members of my household is an officer, director or advisory board member of these companies.
None of the research analysts or the research analyst’s household has a financial interest in the securities of Co-Diagnostics, Inc. (including, without limitation, any option, right, warrant, future, long or short position).
As of June 30 30, 2019 neither the Firm nor its affiliates beneficially own 1% or more of any class of common equity securities of Co-Diagnostics, Inc.
Neither the research analyst nor the Firm has any material conflict of interest in of which the research analyst knows or has reason to know at the time of publication of this research report.
The research analyst principally responsible for preparation of the report does not receive compensation that is based upon any specific investment banking services or transaction but is compensated based on factors including total revenue and profitability of the Firm, a substantial portion of which is derived from investment banking services.
The Firm or its affiliates did receive compensation from Co-Diagnostics, Inc. for investment banking services within twelve months before, and will seek compensation from the companies mentioned in this report for investment banking services within three months following publication of the research report.
H.C. Wainwright & Co., LLC managed or co-managed a public offering of securities for Co-Diagnostics, Inc. during the past 12 months.
The Firm does not make a market in Co-Diagnostics, Inc. as of the date of this research report.
H.C. Wainwright & Co., LLC and its affiliates, officers, directors, and employees, excluding its analysts, will from time to time have long or short positions in, act as principal in, and buy or sell, the securities or derivatives (including options and warrants) thereof of covered companies referred to in this research report.
Rosenfield reviewed the quarter’s numbers and the near-term outlook for the master limited partnership (MLP).
Strong output, including from hydroelectric assets in North America, which was about 7% higher than the long-term average, drove the quarterly results.
Consolidated EBITDA was $630 million, higher than iA Securities’ forecast of $602 million and consensus’ estimate of $598 million. Proportionate adjusted EBITDA was $400 million, between iA’s $365 projection and consensus’ $407 million forecast.
Q2/19 funds from operations came in at $0.74 per share, above both iA and consensus’ estimates of $0.72 and $0.68 per share, respectively.
Another highlight of the quarterly update, Rosenfield pointed out, is that the development pipeline of MLP “continues to support organic growth,” specifically an average annual 35% growth in funds from operations per share (FFO/share) and excluding mergers and acquisitions (M&A) activity. In the hopper are about 130 megawatts (MW) of under construction projects, another greater than 600 MW of construction-ready work and an additional roughly 220 MW of potential repowering jobs.
Supporting longer-term potential upside are the two recent investments, noted RosenfieldTerraform Power’s acquisition of a generation portfolio for about $720 million along with Brookfield and co-investors’ acquisition of a 50% stake in X-Elio for about $500 million. These transactions could add about $3040 million of incremental, annual run rate funds from operations beginning in 2020, “with upside from follow-on organic development.”
Overall, increased cash flow resulting from organic growth and M&A should translate to a lower payout in the future, indicated Rosenfield. The MLP aims for average annual FFO/share growth of 611% and total yearly shareholder returns of 1215%. Simultaneously, it “continues to drive its payout downward toward management’s long-term sustainable 70% payout target (on FFO).”
Rosenfield concluded, “We continue to see Brookfield as a premium brand in the sector, supported by premium value hydro assets.”
iA Securities maintained its Hold rating and its US$37 per share price target on Brookfield, whose stock is currently trading at around $36.07 per share.
Disclosure: 1) Doresa Banning compiled this article for Streetwise Reports LLC and provides services to Streetwise Reports as an independent contractor. She or members of her household own securities of the following companies mentioned in the article: None. She or members of her household are paid by the following companies mentioned in this article: None. 2) The following companies mentioned in this article are billboard sponsors of Streetwise Reports: None. Click here for important disclosures about sponsor fees. 3) Comments and opinions expressed are those of the specific experts and not of Streetwise Reports or its officers. The information provided above is for informational purposes only and is not a recommendation to buy or sell any security. 4) The article does not constitute investment advice. Each reader is encouraged to consult with his or her individual financial professional and any action a reader takes as a result of information presented here is his or her own responsibility. By opening this page, each reader accepts and agrees to Streetwise Reports’ terms of use and full legal disclaimer. This article is not a solicitation for investment. Streetwise Reports does not render general or specific investment advice and the information on Streetwise Reports should not be considered a recommendation to buy or sell any security. Streetwise Reports does not endorse or recommend the business, products, services or securities of any company mentioned on Streetwise Reports. 5) From time to time, Streetwise Reports LLC and its directors, officers, employees or members of their families, as well as persons interviewed for articles and interviews on the site, may have a long or short position in securities mentioned. Directors, officers, employees or members of their immediate families are prohibited from making purchases and/or sales of those securities in the open market or otherwise from the time of the interview or the decision to write an article until three business days after the publication of the interview or article. The foregoing prohibition does not apply to articles that in substance only restate previously published company releases.
Disclosures from iA Securities, Brookfield Renewable Partners L.P., Research Update, July 31, 2019
Conflicts of Interest: The research analyst and or associates who prepared this report are compensated based upon (among other factors) the overall profitability of iA Securities, which may include the profitability of investment banking and related services. In the normal course of its business, iA Securities may provide financial advisory services for the issuers mentioned in this report. iA Securities may buy from or sell to customers the securities of issuers mentioned in this report on a principal basis.
Analyst’s Certification: Each iA Securities research analyst whose name appears on the front page of this research report hereby certifies that (i) the recommendations and opinions expressed in the research report accurately reflect the research analyst’s personal views about the issuer and securities that are the subject of this report and all other companies and securities mentioned in this report that are covered by such research analyst and (ii) no part of the research analyst’s compensation was, is, or will be directly or indirectly, related to the specific recommendations or views expressed by such research analyst in this report.
Analyst Trading: iA Securities permits analysts to own and trade in the securities and or the derivatives of the issuer under their research coverage, subject to the following restrictions. No trades can be executed in anticipation of coverage for a period of 30 days prior to the issuance of the report and 5 days after the dissemination of the report to our clients. For a change in recommendation, no trading is allowed for a period of 24 hours after the dissemination of such information to our clients. A transaction against an analyst’s recommendation can only be executed for a reason unrelated to the outlook of the stock for the issuer and with the prior approval of the Director of Research and the Chief Compliance Officer.
Company Related Disclosures: –In the past 12 months, Industrial Alliance Securities Inc. has managed or co-managed a public offering of securities for the issuer.
–Industrial Alliance Securities Inc. beneficially owned 1% or more of the common equity (including derivatives exercisable or convertible within 60 days) of the issuer as of the month end preceding this report.
–The analyst has visited the issuers operations. No payment or reimbursement was received from the issuer for the associated travel costs.
This week – August 4 through August 10 – central banks from 12 countries or jurisdictions are scheduled to decide on monetary policy: Romania, Australia, New Zealand, India, Thailand, Belarus, Albania, Philippines, Serbia, Rwanda, Peru and Mauritius.
Following table includes the name of the country, the date of the next policy decision, the current policy rate, the result of the last policy decision, the change in the policy rate year to date, and the rate one year ago.
The table is updated when the latest decisions are announced and can always accessed by clicking on This Week.
It was almost like Palladium traders followed our research to the letter when the trend reversed on July 11, 2019. Our research team issued a report indicating a Double-Top pattern was setting up in Palladium on July 3, 2019. At that time, our proprietary cycle indicators and our proprietary Fibonacci price modeling systems suggested a large downside price swing was highly likely.
Palladium is a very interesting metal that is used in various industry sectors as a component for automobile equipment/parts, medical equipment, and many other industrial sectors. It is a great leading indicator to help gauge future expectations for various global industries and as a measure of consumer/industrial consumption and expectations. When Palladium is rallying, it is a fairly solid sign that consumers are bullish on the global economy and are purchasing equipment, autos and other industrial elements to support future growth expectations. When Palladium is falling, it is a fairly solid sign that consumers are reigning in their spending on new cars and other industrial items that are manufactured with Palladium.
One of the biggest factors that are likely driving this move in Palladium is the renewed interest in Gold and Silver as the global market enters a very fragile period. Palladium is a precious metal that is used in jewelry and other consumer products – like Gold and Silver. Yet Palladium does not have the status in the precious metals world like Gold and Silver do. When fear and greed enter the markets, Gold, Silver, and Platinum take center-stage. Palladium, because of its more industrial use base, its not something that will rally like Gold and Silver will when a crisis hits.
This Daily Palladium chart shows how the weakness in price started just after the price peak on July 11, 2019. Over the past 3+ weeks, Palladium rotated downward towards the $1500 price level, then stalled. Global traders were focused on earnings data, the US Fed announcement, and other data.
The recent breakdown is a result of three factors
_ US Fed rates decrease (expecting weaker global economic output)
_ The rally in Gold and Silver (where global traders are starting to focus their attention)
_ The fragility of global economic/trade functions that continue to plague the global markets
These three factors will move the focus away from industrial use metals (Copper, Palladium, and Aluminum) and towards the more traditional Gold/Silver moves.
This Weekly Palladium chart highlights the Fibonacci price modeling system’s lower target levels. Pay attention to the fact that $1315 and $1000 are key downside target levels in Palladium. The Daily chart Fibonacci levels suggest that minor support may be found near $1400. The Weekly Fibonacci chart suggests major support is really down near $1000.
CONCLUDING THOUGHTS:
We believe once the $1475 level is breached to the downside, Palladium will quickly fall to levels near $1300 before briefly stalling and attempting to find support. This move in Palladium aligns almost perfectly with our August 19 US market “Peak” prediction from months ago. We believe the ultimate lower levels, near $1000, are a very strong possibility over the next 3+ months as we believe the global markets, and the US markets, are setting up for a fairly big price rotation after August 19, 2019.
Don’t miss any of these big moves or our incredible research posts. Find out how www.TheTechnicalTraders.com can help you find and execute better trades and prepare for these big price swings that are about to explode.
NEXT TRENDS FOR GOLD, SILVER, MINERS, AND S&P 500
In early June I posted a detailed video explaining in showing the bottoming formation and gold and where to spot the breakout level, I also talked about crude oil reaching it upside target after a double bottom, and I called short term top in the SP 500 index. This was one of my premarket videos for members it gives you a good taste of what you can expect each and every morning before the Opening Bell. Watch Video Here.
I then posted a detailed report talking about where the next bull and bear markets are and how to identify them. This report focused mainly on the SP 500 index and the gold miners index. My charts compared the 2008 market top and bear market along with the 2019 market prices today. See Comparison Charts Here.
On June 26th I posted that silver was likely to pause for a week or two before it took another run up on June 26. This played out perfectly as well and silver is now head up to our first key price target of $17. See Silver Price Cycle and Analysis.
More recently on July 16th, I warned that the next financial crisis (bear market) was scary close, possibly just a couple weeks away. The charts I posted will make you really start to worry. See Scary Bear Market Setup Charts.
In short, you should be starting to get a feel of where each commodity and asset class is headed for the next 8+ months. The next step is knowing when and what to buy and sell as these turning points take place, and this is the hard part. If you want someone to guide you through the next 12-24 months complete with detailed market analysis and trade alerts (entry, targets and exit price levels) join my ETF Trading Newsletter.
Be prepared for these incredible price swings before they happen and learn how you can identify and trade these fantastic trading opportunities in 2019, 2020, and beyond with our Wealth Building & Global Financial Reset Newsletter. You won’t want to miss this big move, folks. As you can see from our research, everything has been setting up for this move for many months.
Join me with a 1 or 2-year subscription to lock in the lowest rate possible and ride my coattails as I navigate these financial market and build wealth while others lose nearly everything they own during the next financial crisis.
As a technical analysis and trader since 1997, I have been through a few bull/bear market cycles. I believe I have a good pulse on the market and timing key turning points for both short-term swing trading and long-term investment capital. The opportunities starting to present themselves will be life-changing if handled properly.
FREE GOLD OR SILVER WITH MEMBERSHIP!
Kill two birds with one stone and subscribe for two years to get yourFREE PRECIOUS METAL and get enough trades to profit through the next metalsbull market and financial crisis!
Over the past few days, we’ve received hundreds of emails from our followers and members asking if this is the big breakdown that everyone has been expecting in the markets. Yes, we’ve warned that it will likely happen before the end of 2019, but we’ve also been very clear that we believe an August 19, 2019 price peak will setup this move and our recent research suggest the NQ will rally to levels above 8200 before this peak in the US market sets up. So, in order to help our members and followers understand what we believe is actually happening in the markets, we’ve put together this research post to help everyone better prepare for the next few weeks and months.
First things first, the foundation of Fibonacci price theory is that price will always attempt to seek out new price highs or new price lows – ALWAYS. Many of the US major indexes have recently established new price highs in early July 2019. Think of this as a fundamental element in price structure when attempting to apply Fibonacci price theory.
When any chart establishes a new price high (a high price that is above the previous rotational peak level in price), the trend is established as BULLISH and we would immediately expect, at some future time, that price will rotate lower attempting to validate that new price high or attempt to reach a new price low. At certain times, external news can create “price over-reaction” events within the scope of price volatility. I’m certain many of you have experienced these types of expanded price ranges that turn into a “wash-out” type of wide-range rotations in the markets.
The combination of the US Fed and the US/China trade talk failures, as well as the rally in Gold, Silver and the US Dollar, are all acting to create a hyper-active rotation in the markets with larger volatility.
We suggest that everyone read these earlier research posts to better understand what is really happening in the markets right now :
It is our opinion that the US Fed announcement followed immediately by the US/China trade talk failure created a “hyper-active” price rotation event that will likely turn into a short-term buying opportunity. Our Adaptive Dynamic Learning (ADL) predictive modeling system is suggesting the NQ will attempt to target levels above 8200 before the August 19, 2019 peak sets up. Therefore, it is still our belief that the markets are setting up a unique “price anomaly” with this current downside price rotation and that a move higher is in the works before the bigger downside price rotation actually begins.
This Daily NQ chart highlights the support level near 7600 that was set up by the June 2019 price rotation. Yes, the price has moved lower into this zone, but we believe this zone will act as a moderate support level and that price will rotate higher early in the week of August 5, 2019.
This Weekly NQ chart highlights our Fibonacci price modeling system and shows the “Critical Support” level from the October 2018 highs as well as the Bullish/Bearish trigger levels (the RED/GREEN lines near the right edge of the chart) that constitute confirmed price rotations. At this time, the current BEARISH trigger levels are near 7540 and the NQ is still 140 points above this level.
NEXT MOVES FOR GOLD, SILVER, MINERS, AND S&P 500
In early June I posted a detailed video explaining in showing the bottoming formation and gold and where to spot the breakout level, I also talked about crude oil reaching it upside target after a double bottom, and I called short term top in the SP 500 index. This was one of my premarket videos for members it gives you a good taste of what you can expect each and every morning before the Opening Bell. Watch Video Here.
I then posted a detailed report talking about where the next bull and bear markets are and how to identify them. This report focused mainly on the SP 500 index and the gold miners index. My charts compared the 2008 market top and bear market along with the 2019 market prices today. See Comparison Charts Here.
On June 26th I posted that silver was likely to pause for a week or two before it took another run up on June 26. This played out perfectly as well and silver is now head up to our first key price target of $17. See Silver Price Cycle and Analysis.
More recently on July 16th, I warned that the next financial crisis (bear market) was scary close, possibly just a couple weeks away. The charts I posted will make you really start to worry. See Scary Bear Market Setup Charts.
CONCLUDING THOUGHTS:
We believe this current downside price move is setting up to become an over-reaction price swing that will likely result in a very short-term buying opportunity for skilled technical traders. Failure to reach levels below 7400 on the NQ would be a very strong indication that this is a “failed new price low rotation” on the Weekly chart. And, as Fibonacci price theory suggests, price must always attempt to establish a new price high or new price low – at all times. Thus, a failure to establish a new price low on this weekly chart would mean it MUST rotate higher to attempt to establish a new price high. 8200+, here we come.
In short, you should be starting to get a feel of where each commodity and asset class is headed for the next 8+ months. The next step is knowing when and what to buy and sell as these turning points take place, and this is the hard part. If you want someone to guide you through the next 12-24 months complete with detailed market analysis and trade alerts (entry, targets and exit price levels) join my ETF Trading Newsletter.
Be prepared for these incredible price swings before they happen and learn how you can identify and trade these fantastic trading opportunities in 2019, 2020, and beyond with our Wealth Building & Global Financial Reset Newsletter. You won’t want to miss this big move, folks. As you can see from our research, everything has been set up for this move for many months.
Join me with a 1 or 2-year subscription to lock in the lowest rate possible and ride my coattails as I navigate these financial market and build wealth while others lose nearly everything they own during the next financial crisis.
As a technical analysis and trader since 1997, I have been through a few bull/bear market cycles. I believe I have a good pulse on the market and timing key turning points for both short-term swing trading and long-term investment capital. The opportunities starting to present themselves will be life-changing if handled properly.
FREE GOLD OR SILVER WITH MEMBERSHIP!
Kill two birds with one stone and subscribe for two years to get yourFREE PRECIOUS METAL and get enough trades to profit through the next metalsbull market and financial crisis!
Production, costs, guidance and financials of this miner are reviewed in this CIBC report.
In a July 30 research note, CIBC analyst Cosmos Chiu reported that Alacer Gold Corp.’s (ASR:TSX; ALACF:OTMKTS; AQG:ASX) “Q2/19 results included solid production and better-than-expected sales that drove an earnings per share beat.”
Chiu reviewed Alacer’s production and related cost during Q2/19. The company produced 99,500 ounces (99.5 Koz), above CIBC’s forecasted 98.1 Koz. The all-in sustaining cost (AISC) was also better than expected, coming in at $669 per ounce versus CIBC’s $743 per ounce estimate.
Production for all of H1/19 totaled 95 Koz, on the lower end of full-year guidance of 90110 Koz. Consequently, Alacer increased oxide production guidance for the year to 125145 Koz at an AISC of $650700 per ounce, down from previous cost guidance of $700750 an ounce.
The Çöpler sulfide oxide plant, currently being ramped up, outperformed in Q2/19, delivering 57 Koz, a 53% quarter-over-quarter increase.
Year-to-date production at Çöpler was 94 Koz, against full-year 2019 guidance of 230270 Koz. The plant remains on track to meet the lower end of that range. “We currently model 229 Koz production from the sulfides in 2019, at an AISC of $622 per ounce,” Chiu commented.
As for Alacer’s Q2/19 financials, Chiu noted, adjusted EPS of $0.08 exceeded CIBC’s $0.04 forecast and consensus’ $0.03 projection, primarily due to higher-than-expected sales from the Çöpler sulfide plant.
Cash flow per share also was a beat at $0.13 versus CIBC and consensus’ $0.11 estimate.
At the end of Q2/19, Alacer had $125 million in cash, including restricted cash, and net debt of about $180 million. CIBC estimates that Alacer’s free cash flow in 2019 will surpass $150 million, based on the current gold price of $1,425 per ounce.
Finally, Chiu presented potential upcoming key catalysts. They include continued ramp-up of Çöpler, exploration results from the Çöpler complex and engineering study results regarding the addition of a stand-alone leach pad at Çöpler or a significant expansion of the existing one.
CIBC has an Outperformer rating and a CA$6 per share target price on Alacer Gold, whose stock is currently trading at around CA$5.21 per share.
Disclosure: 1) Doresa Banning compiled this article for Streetwise Reports LLC and provides services to Streetwise Reports as an independent contractor. She or members of her household own securities of the following companies mentioned in the article: None. She or members of her household are paid by the following companies mentioned in this article: None. 2) The following companies mentioned in this article are billboard sponsors of Streetwise Reports: None. Click here for important disclosures about sponsor fees. 3) Comments and opinions expressed are those of the specific experts and not of Streetwise Reports or its officers. The information provided above is for informational purposes only and is not a recommendation to buy or sell any security. 4) The article does not constitute investment advice. Each reader is encouraged to consult with his or her individual financial professional and any action a reader takes as a result of information presented here is his or her own responsibility. By opening this page, each reader accepts and agrees to Streetwise Reports’ terms of use and full legal disclaimer. This article is not a solicitation for investment. Streetwise Reports does not render general or specific investment advice and the information on Streetwise Reports should not be considered a recommendation to buy or sell any security. Streetwise Reports does not endorse or recommend the business, products, services or securities of any company mentioned on Streetwise Reports. 5) From time to time, Streetwise Reports LLC and its directors, officers, employees or members of their families, as well as persons interviewed for articles and interviews on the site, may have a long or short position in securities mentioned. Directors, officers, employees or members of their immediate families are prohibited from making purchases and/or sales of those securities in the open market or otherwise from the time of the interview or the decision to write an article until three business days after the publication of the interview or article. The foregoing prohibition does not apply to articles that in substance only restate previously published company releases.
Disclosures from CIBC, Alacer Gold Corp., Earnings Update, July 30, 2019
Analyst Certification: Each CIBC World Markets Corp./Inc. research analyst named on the front page of this research report, or at the beginning of any subsection hereof, hereby certifies that (i) the recommendations and opinions expressed herein accurately reflect such research analyst’s personal views about the company and securities that are the subject of this report and all other companies and securities mentioned in this report that are covered by such research analyst and (ii) no part of the research analyst’s compensation was, is, or will be, directly or indirectly, related to the specific recommendations or views expressed by such research analyst in this report.
Analysts employed outside the U.S. are not registered as research analysts with FINRA. These analysts may not be associated persons of CIBC World Markets Corp. and therefore may not be subject to FINRA Rule 2241 restrictions on communications with a subject company, public appearances and trading securities held by a research analyst account.
Potential Conflicts of Interest: Equity research analysts employed by CIBC World Markets Corp./Inc. are compensated from revenues generated by various CIBC World Markets Corp./Inc. businesses, including the CIBC World Markets Investment Banking Department. Research analysts do not receive compensation based upon revenues from specific investment banking transactions. CIBC World Markets Corp./Inc. generally prohibits any research analyst and any member of his or her household from executing trades in the securities of a company that such research analyst covers. Additionally, CIBC World Markets Corp./Inc. generally prohibits any research analyst from serving as an officer, director or advisory board member of a company that such analyst covers.
In addition to 1% ownership positions in covered companies that are required to be specifically disclosed in this report, CIBC World Markets Corp./Inc. may have a long position of less than 1% or a short position or deal as principal in the securities discussed herein, related securities or in options, futures or other derivative instruments based thereon.
Recipients of this report are advised that any or all of the foregoing arrangements, as well as more specific disclosures set forth below, may at times give rise to potential conflicts of interest.
Important Disclosure Footnotes for Alacer Gold Corp. (ASR)
CIBC World Markets Inc. expects to receive or intends to seek compensation for investment banking services from Alacer Gold Corp. in the next 3 months.
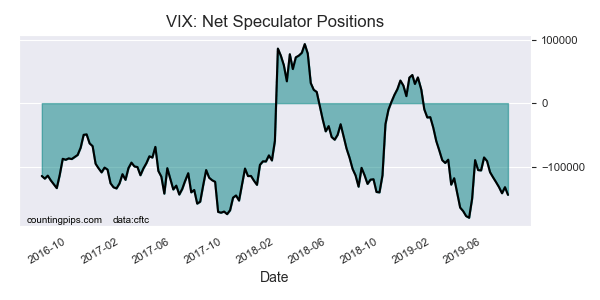
Finally, VIX speculators boosted their bearish bets this week after a short cool off last week. Bearish bets have now increased to the highest level since May 7th and have now had rising bearish positions in 23 out of 30 weeks in 2019.
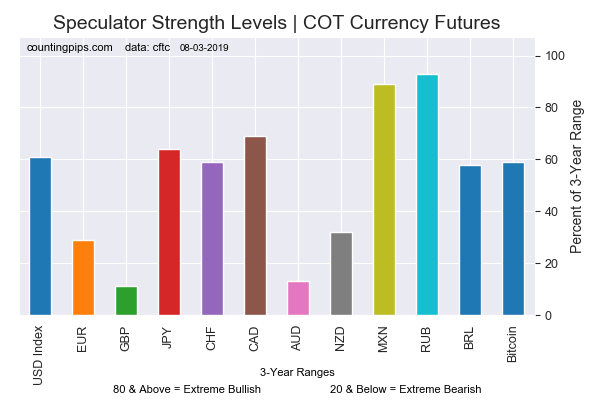
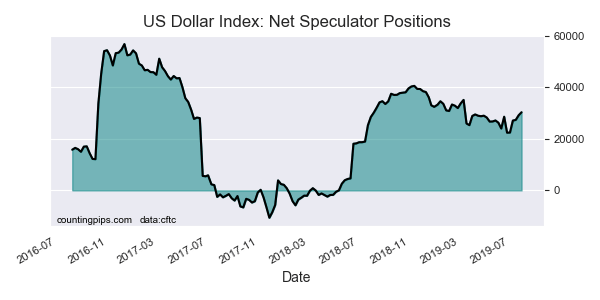
Large currency speculators raised their net positions in the US Dollar Index futures markets this week, according to the latest Commitment of Traders (COT) data released by the Commodity Futures Trading Commission (CFTC) on Friday. See full article.
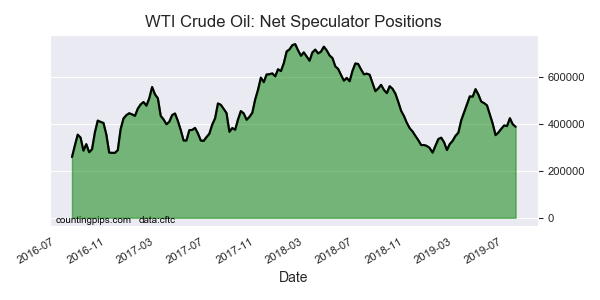
The large speculator contracts of WTI crude futures totaled a net position of 387,291 contracts, according to the latest data this week. This was a change of -10,560 contracts from the previous weekly total. See full article.
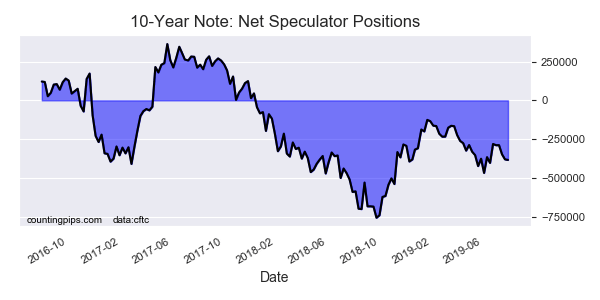
Large speculator contracts of the 10-Year Bond futures totaled a net position of -383,842 contracts, according to the latest data this week. This was a change of -3,673 contracts from the previous weekly total. See full article.
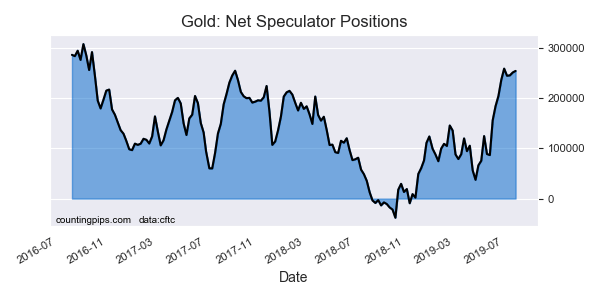
Large precious metals speculator contracts of the Gold futures totaled a net position of 254,388 contracts, according to the latest data this week. This was a change of 3,138 contracts from the previous weekly total. See full article.
Large stock market volatility speculator contracts of the VIX futures totaled a net position of -144,314 contracts, according to the latest data this week. This was a change of -12,047 contracts from the previous weekly total. See full article.
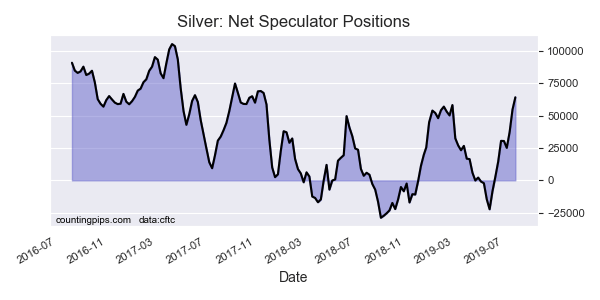
Large precious metals speculator contracts of the silver futures totaled a net position of 64,297 contracts, according to the latest data this week. This was a change of 9,536 contracts from the previous weekly total. See full article.
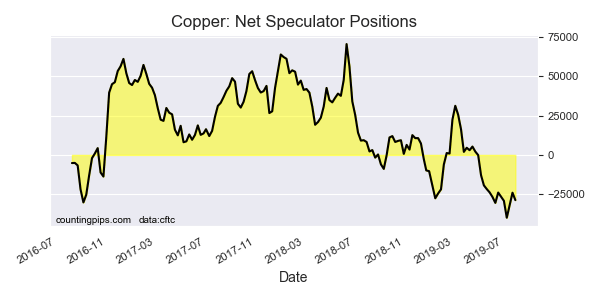
Metals speculator contracts of the copper futures totaled a net position of -28,755 contracts, according to the latest data this week. This was a change of -4,706 contracts from the previous weekly total. See full article.
*COT Report: The COT data, released weekly to the public each Friday, is updated through the most recent Tuesday (data is 3 days old) and shows a quick view of how large speculators or non-commercials (for-profit traders) were positioned in the futures markets.
The CFTC categorizes trader positions according to commercial hedgers (traders who use futures contracts for hedging as part of the business), non-commercials (large traders who speculate to realize trading profits) and nonreportable traders (usually small traders/speculators).
 Article by ForexTime