China’s currency fall rocks global markets – what should investors do?

By George Prior

Global financial markets have been rocked by China’s currency falling below an important threshold – and investors must consider action to protect their wealth and capitalize on the opportunities.

This is the message from Tom Elliott, International Investment Strategist at deVere Group, one of the world’s largest independent financial advisory organizations.

It comes after the Chinese renminbi fell to under 7 to the U.S. dollar on Monday – the lowest in more than a decade – igniting drops in stocks and emerging market currencies and driving a rally in government bonds.

Mr Elliott notes: “The nervousness in financial markets over the falling renminbi in recent weeks has reached panic levels, as the Chinese currency passes the psychologically important barrier of RMB 7 to the dollar.

“Just as in July and August 2015, when China engineered a small devaluation to support growth, global stock markets have panicked.”

He continues: “This has happened for three reasons.

“First, because a weaker renminbi will export deflationary pressure around the world’s manufacturing industries. Chinese goods, always competitive on price, will be even more competitive. This is therefore bad news for manufacturers outside of China, at a time when global manufacturing is struggling with weakening demand growth and the negative impact of the U.S-China trade dispute on their supply lines and profits.

“Second, with Chinese imports becoming cheaper, the major central banks’ efforts to energize inflation have taken a setback. And with it their attempts to ‘normalize’ interest rates, unwind quantitative easing and escape the black hole of negative real interest rates. Indeed, the size of the Chinese export sector means the direction of the renminbi is a key calculation when economists attempt to forecast global prices.

“Third, unlike the summer of 2015, the devaluation occurs against the background of a trade war with the U.S.”

For investors, the major question now is ‘How will the U.S. respond?’

“Policymakers in Washington will be wondering if Beijing’s refusal to intervene more heavily in the currency markets to support the renminbi is a strategic decision to put pressure on the U.S. in regard to the trade talks. Is it an ‘aggressive’ devaluation? If they conclude it is, we can expect furious reaction from Trump,” says Mr Elliott.

“Or is it that Beijing sees a weaker currency as inevitable, given China’s slowing growth? After all, currencies do go up and down, why should China be different just because we have become used to it being managed in the past through currency intervention.

“It would be ironic for the U.S. to be demanding a more liberal attitude towards trade from China, but to object to China’s currency being allowed to find a new rate in line with market conditions.

“If Washington takes this line, investors can sleep a little easier.”

The International Investment Strategist concludes: “It is worth perhaps remembering the investor’s mantra: where there is chaos, there is opportunity.

“Investors are urged to check their portfolios to ensure that they are best-positioned to capitalize on current opportunities and sidestep the risks.”

About:

deVere Group is one of the world’s largest independent advisors of specialist global financial solutions to international, local mass affluent, and high-net-worth clients.  It has a network of more than 70 offices across the world, over 80,000 clients and $12bn under advisement.

 

Forex Technical Analysis & Forecast 05.08.2019 (EURUSD, GBPUSD, USDCHF, USDJPY, AUDUSD, USDRUB, GOLD, BRENT)

Article By RoboForex.com

EURUSD, “Euro vs US Dollar”

After forming another consolidation range around 1.1090, EURUSD has broken it to the upside. Possibly, the pair may start a new correction with the target at 1.1155. Later, the market may continue trading inside the downtrend to reach 1.1000.

EURUSD
Risk Warning: the result of previous trading operations do not guarantee the same results in the future

GBPUSD, “Great Britain Pound vs US Dollar”

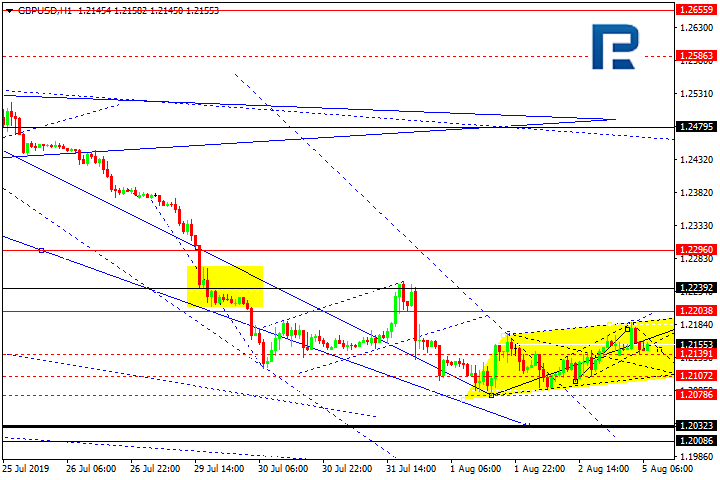
GBPUSD is consolidating around 1.2139. Today, the pair may form a new descending structure towards 1.2107 and then start another growth to reach 1.2200. After that, the instrument may continue trading downwards with the short-term target at 1.2034.

GBPUSD
Risk Warning: the result of previous trading operations do not guarantee the same results in the future

USDCHF, “US Dollar vs Swiss Franc”

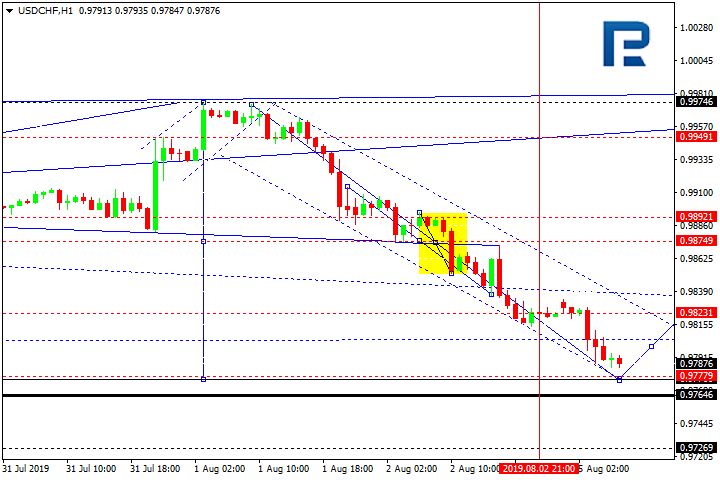
USDCHF has broken 0.9975 downwards. Possibly, the pair may be corrected to the downside with the target at 0.9777. After that, the instrument may form one more ascending structure to continue the uptrend and reach 1.0000.

USDCHF
Risk Warning: the result of previous trading operations do not guarantee the same results in the future

USDJPY, “US Dollar vs Japanese Yen”

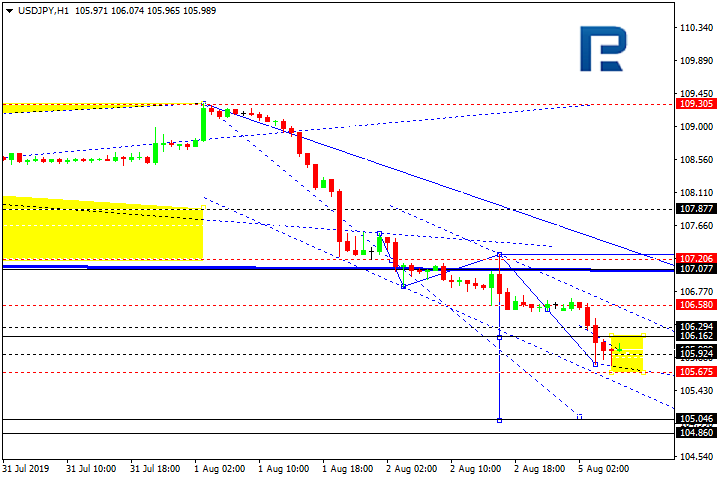
USDJPY has broken 107.20 downwards. Possibly, today the pair may continue trading inside the downtrend with the short-term target at 105.05. Later, the market may start a new growth to return to 107.20 and test it from below.

USDJPY
Risk Warning: the result of previous trading operations do not guarantee the same results in the future

AUDUSD, “Australian Dollar vs US Dollar”

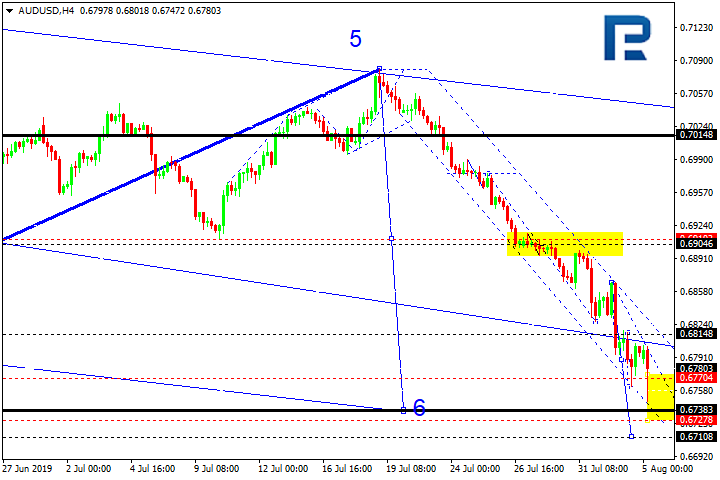
AUDUSD continues moving downwards. Possibly, the pair may reach the key downside target at 0.6738. After that, the instrument may start consolidating near the lows.

AUDUSD
Risk Warning: the result of previous trading operations do not guarantee the same results in the future

USDRUB, “US Dollar vs Russian Ruble”

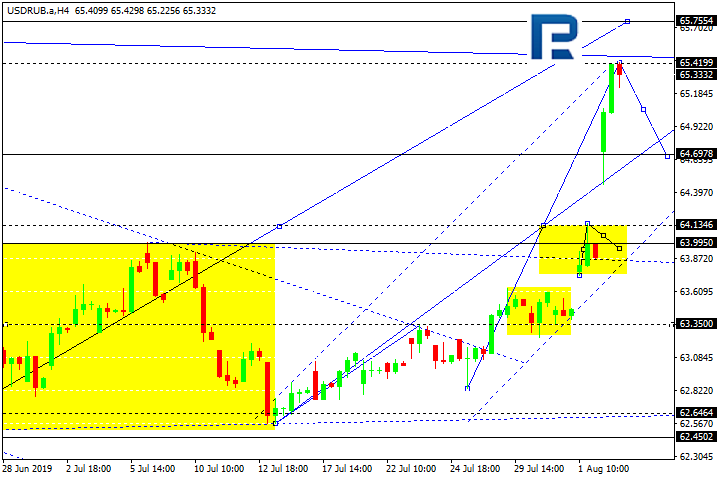
USDRUB has expanded the range up to 65.40 and almost reached the short-term correctional target. Today, the pair may form a new descending structure towards 64.15 and then start another growth with the target at 65.75.

USDRUB
Risk Warning: the result of previous trading operations do not guarantee the same results in the future

XAUUSD, “Gold vs US Dollar”

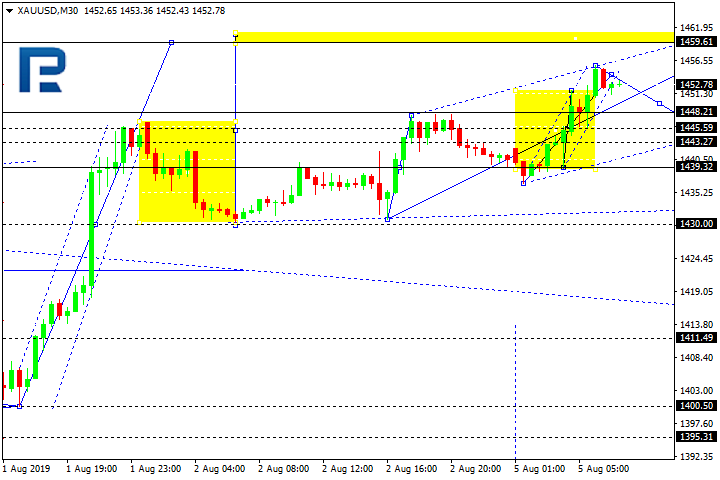
Gold has broken the consolidation range to the downside and may grow 1459.60. Possibly, today the pair may fall to test 1445.60 from above and then grow to break 1455.00. After that, the instrument may continue trading inside the uptrend to reach the above-mentioned target.

GOLD
Risk Warning: the result of previous trading operations do not guarantee the same results in the future

BRENT

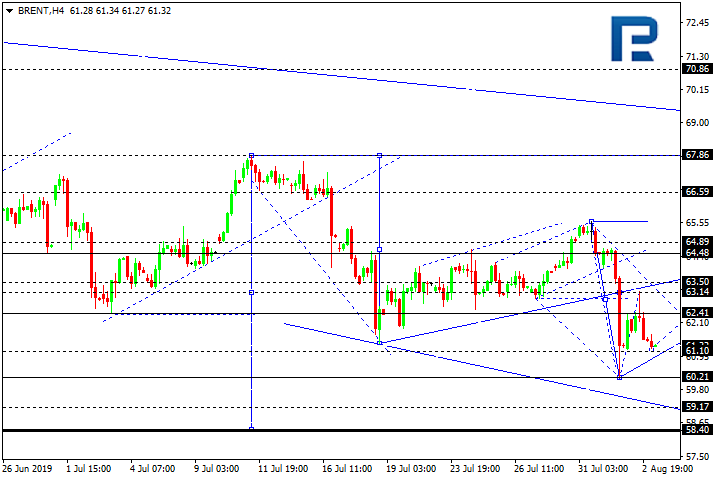
Brent is moving downwards and may reach 58.40. Today, the pair may consolidate around 62.40. Possibly, the pair may continue the correction towards 63.50. Later, the market may return to 62.40 and then form one more ascending structure to reach 64.90 and then continue trading downwards with the target at 58.40.

BRENT
Risk Warning: the result of previous trading operations do not guarantee the same results in the future

Article By RoboForex.com

Attention!
Forecasts presented in this section only reflect the author’s private opinion and should not be considered as guidance for trading. RoboForex LP bears no responsibility for trading results based on trading recommendations described in these analytical reviews.

Fibonacci Retracements Analysis 05.08.2019 (GOLD, USDCHF)

Article By RoboForex.com

XAUUSD, “Gold vs US Dollar”

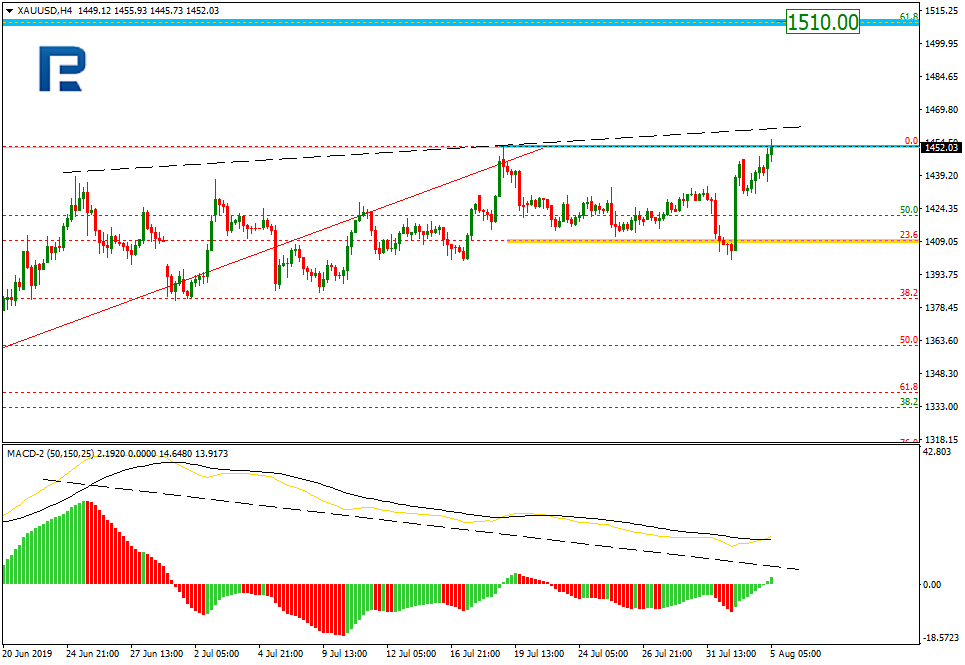
In the H4 chart, after finishing the short-term correction towards 23.6% fibo, XAUUSD is trying to break the high. The upside target is long-term 61.8% fibo at 1510.00. At the same time, there is a divergence, which means that the current rising tendency may be weak.

GOLD_H4
Risk Warning: the result of previous trading operations do not guarantee the same results in the future

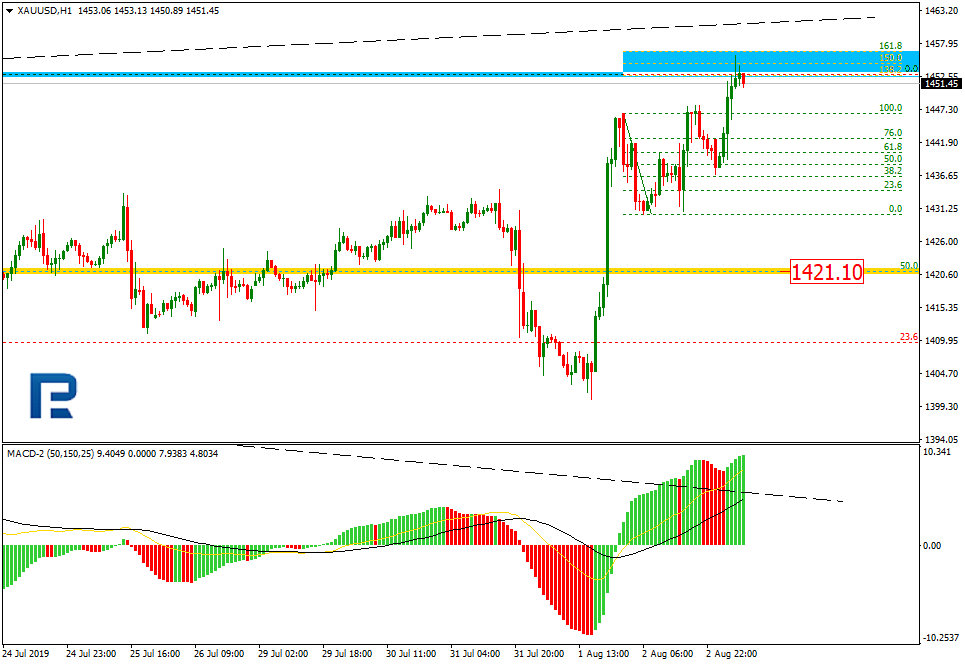
As we can see in the H1 chart, the pair is forming a new rising impulse. After finishing another correction, the impulse has reached the post-correctional extension area between 138.2% and 161.8% fibo. The key support is long-term 50.0% fibo at 1421.10.

GOLD_H1
Risk Warning: the result of previous trading operations do not guarantee the same results in the future

USDCHF, “US Dollar vs Swiss Franc”

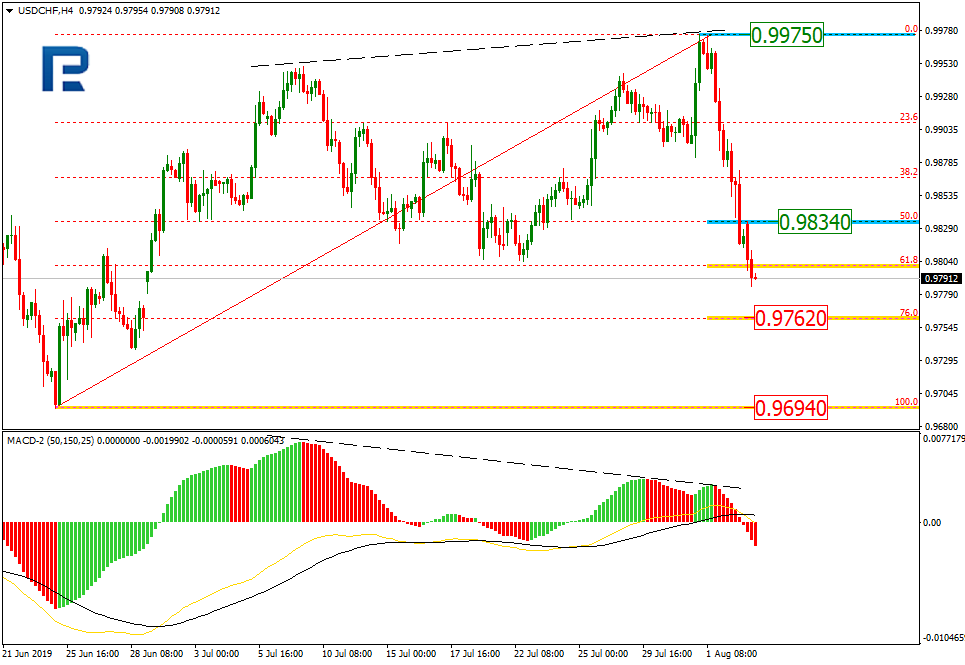
As we can see in the H4 chart, the divergence made USDCHF plunge, by now, it has already broken 61.8% fibo and may continue falling towards 76.0% fibo at 0.9762. The key downside target is the mid-term low at 0.9694. The resistance is 50.0% fibo at 0.9834.

USDCHF_H4
Risk Warning: the result of previous trading operations do not guarantee the same results in the future

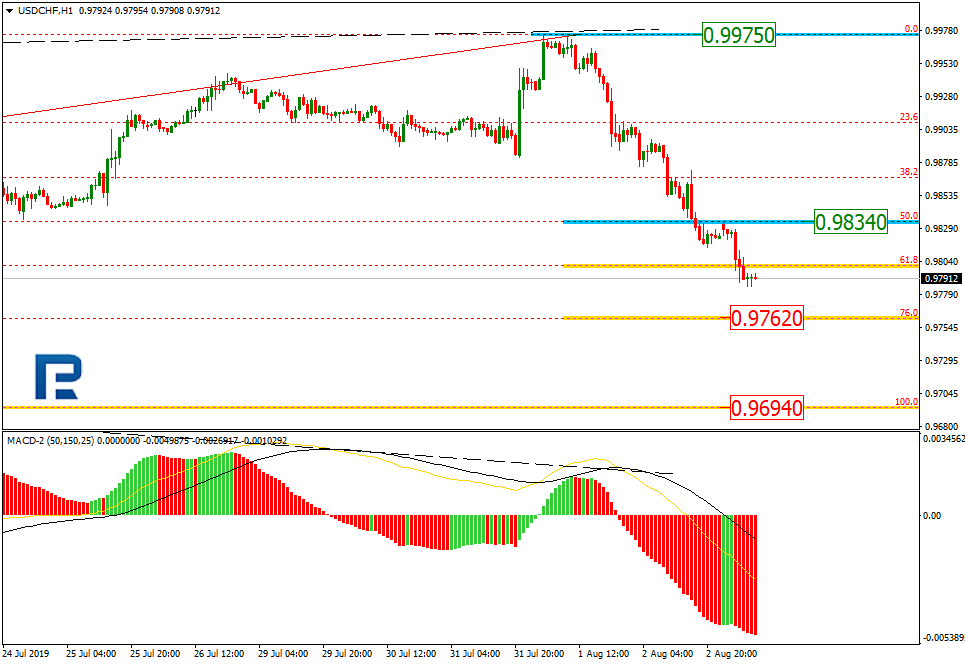
In the H1 chart, the pair is steadily trading downwards to reach 76.0% fibo at 0.9762.

USDCHF_H1

Article By RoboForex.com

Attention!
Forecasts presented in this section only reflect the author’s private opinion and should not be considered as guidance for trading. RoboForex LP bears no responsibility for trading results based on trading recommendations described in these analytical reviews.

Tariff Damage Spreading in US, China within Target in H2 2019

By Dan Steinbock

In the second half of 2019, US economic prospects will soften, despite the Fed rate cut, whereas Chinese growth target is likely to prevail. It’s time to prepare for diminished global economic prospects in 2019-20.

After an important meeting of the Central Committee of the Communist Party of China (CPC), participants said that China seeks to make its fiscal policy more effective and to maintain “reasonably ample” liquidity.

Instead of resorting to a stimulus in the real estate market, the emphasis will be on “proactive fiscal policy and prudent monetary policy.” It is a challenging balancing act, but the right stance in the right time.

Meanwhile, President Trump pledged to impose an additional 10% tariff on Chinese imports to the US, which caused US stocks to tank 280 points. The White House needs a scapegoat as the Fed cuts cannot offset Trump’s tweet policies, US growth is slowing and a slowdown is looming in 2020.

China’s 2019 growth within range

Clearly, the CPC Central Committee seeks to avoid targeted but costly stimulus policies, which could exacerbate new risks of asset bubbles over time, but it will ensure adequate fiscal support.

Since infrastructure investment remains relatively soft by historical standards, fiscal easing on investment may prove likely in the second half of the year. It could be biased toward small enterprises and startups.

Moreover, fiscal easing is likely to be coupled with monetary support, including cuts of the banks reserve requirement ratio. Although the easing bias could cause downward pressure on Chinese bond yields and corporate spreads in the near future, the big picture suggests stabilization and resilience.

In the second quarter, Chinese economy grew 6.2%, a drop relative to 6.4% in the first quarter, yet hardly a surprise in view of global challenges. China’s economic growth is within the target range of 6% to 6.5% set by the government. Indeed, the full-year 2019 growth rate of 6.2% remains achievable, even if growth stabilizes around 6% to 6.2% in the second half.

In view of the CPC Central Committee meeting, policy authorities are likely to stick to the effort to cap debt growth. While that will support Chinese economy in the long term, the potential risk in this approach is premature tightening in the short-term. To avoid adverse outcomes, fiscal easing is likely in the second half of the year, while monetary easing will be likely to offset riskier scenarios.

Such stances could benefit Chinese stocks, which will also be supported by the anticipated foreign inflows, thanks to the inclusion of Chinese assets in international benchmarks. Despite the relatively benign macroeconomic prospects, more optimistic scenarios are constrained by the lingering trade-war uncertainty and caution in economic sentiment.

The US economy is a different story.

Fed cuts cannot contain White House’s policy mistakes

In the second quarter, US GDP grew at a 2.1% pace, which heralds “slowing economy.” Last spring, I predicted in China Daily that collateral damage in the US economy would begin to be felt more broadly by the summer. And a month ago, I argued that this damage is spreading, particularly as the White House is initiating new tariff wars against other countries around the world.

That is one reason why the US Federal Reserve – in a widely expected move, but one that critics see as a sign of diminished independence – cut interest rates by 25 basis points to a range of 2% to 2.25%, for the first time in more than a decade. The Fed also declared a premature end to its balance sheet reduction.

Ironically, the Fed’s statement – unchanged economic conditions, solid job gains, moderately-rising economic activity, though soft business investment – did not necessarily warrant a rate cut (the decision was not unanimous). What motivated Fed chair Jerome Powell’s decision may well have been the muted inflation pressures and particularly global growth concerns, which the Trump White House has undermined since the onset of its tariff wars in spring 2018.

Interestingly, the Fed cut did not cause a rally; it stumped the market. S&P 500 dropped almost 2%; 10-year Treasury yields to about 2%. The Fed cut does not imply a start of a new rate-cut cycle, but it does mean that the post-2008 recovery is now over with darker clouds looming in the horizon.

Trump tariff wars cloud US and global forecasts

When President Trump arrived in the White House, he pledged GDP growth at 4%. More recently, he projected US growth at 3%. Yet, analysts estimate US growth this year at 2.5% or less. Qualitative assessments suggest deterioration, as growth in domestic demand is slumping.

Worse, US GDP growth forecasts for 2020 indicate softening to 1.8%, possibly a (near-recession) slowdown – especially if trade and tech wars still escalate.

In the absence of negative surprises, Chinese GDP growth is likely to stay within the target of 6.2% in 2019 and possibly in 2020 as well, with supportive fiscal and monetary conditions. US tariff wars are likely to penalize Chinese economy by less than 0.5% of GDP, which could be offset by just a modest depreciation of the renminbi.

If recent policy mistakes in the White House will prevail, slower growth in investment spending, rising concern for continued trade wars and destabilizing geopolitics are likely to foster downside risks in global economic prospects, as risks for further downgrades morph into actual realities.

About the Author:

[This commentary was released by China Daily on August 3, 2019; it is based on Dr Steinbock’s briefing about US and Chinese growth in H2 2019.]

Dr. Dan Steinbock is an internationally recognized strategist of the multipolar world and the founder of Difference Group. He has served at India, China and America Institute (US), Shanghai Institutes for International Studies (China) and the EU Center (Singapore). See https://www.differencegroup.net/ 


The Analytical Overview of the Main Currency Pairs on 2019.08.05

by JustForex

The EUR/USD currency pair

Technical indicators of the currency pair:
  • Prev Open: 1.10804
  • Open: 1.11039
  • % chg. over the last day: +0.22
  • Day’s range: 1.10996– 1.11326
  • 52 wk range: 1.1034 – 1.1817

The EUR/USD currency pair began to recover after a long fall. The trading tool has updated the local highs. Currently, EUR/USD quotes are consolidating iaround 1.10950-1.11300. On Friday, the United States published mixed reports on the US labor market in July. Investors expect up-to-date information regarding the trade negotiations between Washington and Beijing. In the near future, we do not exclude the further restoration of the EUR. We recommend opening positions from key support and resistance levels.

The Economic News Feed for 05.08.2019:

  • – Some business activity indicators (GER, EU) – 10:55, 11:00 (GMT+3:00);
  • – Non-manufacturing PMI by ISM (US) – 17:00 (GMT+3:00);
EUR/USD

Indicators point to the strength of buyers: the price has fixed above 100 MA.

The MACD histogram is in the positive zone and above the signal line, which gives a strong signal to buy EUR/USD.

The Stochastic Oscillator is in the neutral zone, the %K line crossed the %D line. There are no signals at the moment.

Trading recommendations
  • Support levels: 1.10950, 1.10600, 1.10250
  • Resistance levels: 1.11300, 1.11600, 1.11850

If the price consolidates above 1.11300, expect further correction toward 1.11600-1.11850.

Alternatively, the price could descend toward 1.10700-1.10500.

The GBP/USD currency pair

Technical indicators of the currency pair:
  • Prev Open: 1.21512
  • Open: 1.21199
  • % chg. over the last day: -0.29
  • Day’s range: 1.20903 – 1.21447
  • 52 wk range: 1.2080 – 1.3385

Yesterday, the Bank of England, as expected, kept its key interest rate unchanged at 0.75%. The regulator is concerned about the hard Brexit scenario. The Central Bank also worsened the forecast for UK GDP growth for 2019-2020. At the moment, the GBP/USD currency pair is in lateral movement. The trading tool tests the key support and resistance levels 1.20800 and 1.21600. Investors are expecting a report on the US labor market. We recommend opening positions from key levels.

At 11:30 (GMT+3:00), the UK will publish the business activity index for the construction sector.

GBP/USD

The price fixed below 50 MA and 100 MA, which signals the strength of sellers.

The MACD histogram is in the negative zone and below the signal line, which gives a strong signal to sell GBP/USD.

The Stochastic Oscillator is in the neutral zone, the %K line crossed the %D line. There are no signals at the moment.

Trading recommendations
  • Support levels: 1.20800, 1.20200
  • Resistance levels: 1.21600, 1.22500, 1.23000

If the price consolidates below 1.20800, expect a further drop toward 1.20500-1.20200.

Alternatively, the price could recover toward 1.22000-1.22300.

The USD/CAD currency pair

Technical indicators of the currency pair:
  • Prev Open: 1.32122
  • Open: 1.32110
  • % chg. over the last day: -0.05
  • Day’s range: 1.31916 – 1.32425
  • 52 wk range: 1.2727 – 1.3664

The technical picture on the USD/CAD currency pair is still ambiguous. The trading instrument is in lateral movement. CAD is currently testing local support and resistance levels at 1.32000 and 1.32350. USD/CAD quotes have the potential for further growth. We recommend paying attention to the dynamics of oil quotes. Positions must be opened from key levels.

Today, Canada’s financial markets are closed due to the holiday.

USD/CAD

Indicators signal the strength of buyers: the price has fixed above 50 MA and 100 MA.

The MACD histogram is in the positive zone and continues to rise, indicating bullish sentiment.

The Stochastic Oscillator is in the neutral zone, the %K line crossed the %D line. There are no signals at the moment.

Trading recommendations
  • Support levels: 1.32000, 1.31800, 1.31500
  • Resistance levels: 1.32350, 1.32650, 1.32800

If the price consolidates above 1.32350 expect further growth toward 1.32650-1.32800.

Alternatively, the price could drop toward 1.31800-1.31500.

The USD/JPY currency pair

Technical indicators of the currency pair:
  • Prev Open: 107.334
  • Open: 106.528
  • % chg. over the last day: -0.70
  • Day’s range: 105.786 – 106.682
  • 52 wk range: 104.97 – 114.56

The USD/JPY currency pair continues to show a pronounced downtrend. The trading instrument approached annual lows. Demand for “safe” assets remains high due to the escalation of the trade conflict between the US and China. At the moment, USD/JPY quotes are consolidating in the range of 105.800-106.300. In the near future, technical correction is not ruled out. Today we recommend paying attention to economic releases from the USA. Positions must be opened from key levels.

The Economic News Feed for 05.08.2019 is calm.

USD/JPY

Indicators signal the strength of sellers: the price has fixed below 50 MA and 100 MA.

The MACD histogram is in the negative zone and below the signal line, which gives a strong signal to sell USD/JPY.

The Stochastic Oscillator is in the neutral zone, the %K line crossed the %D line. There are no signals at the moment.

Trading recommendations
  • Support levels: 105.800, 105.500
  • Resistance levels: 106.300, 106.800, 107.200

If the price consolidates below 105.800, expect further descend toward 105.500-105.300.

Alternatively, the price could rise toward 106.700-107.000.

by JustForex

DAX30 CFD breaking below EMA(200) – significant losses ahead?

By Admiral Markets

Source: Economic Events August 5, 2019 – Admiral Markets’ Forex Calendar

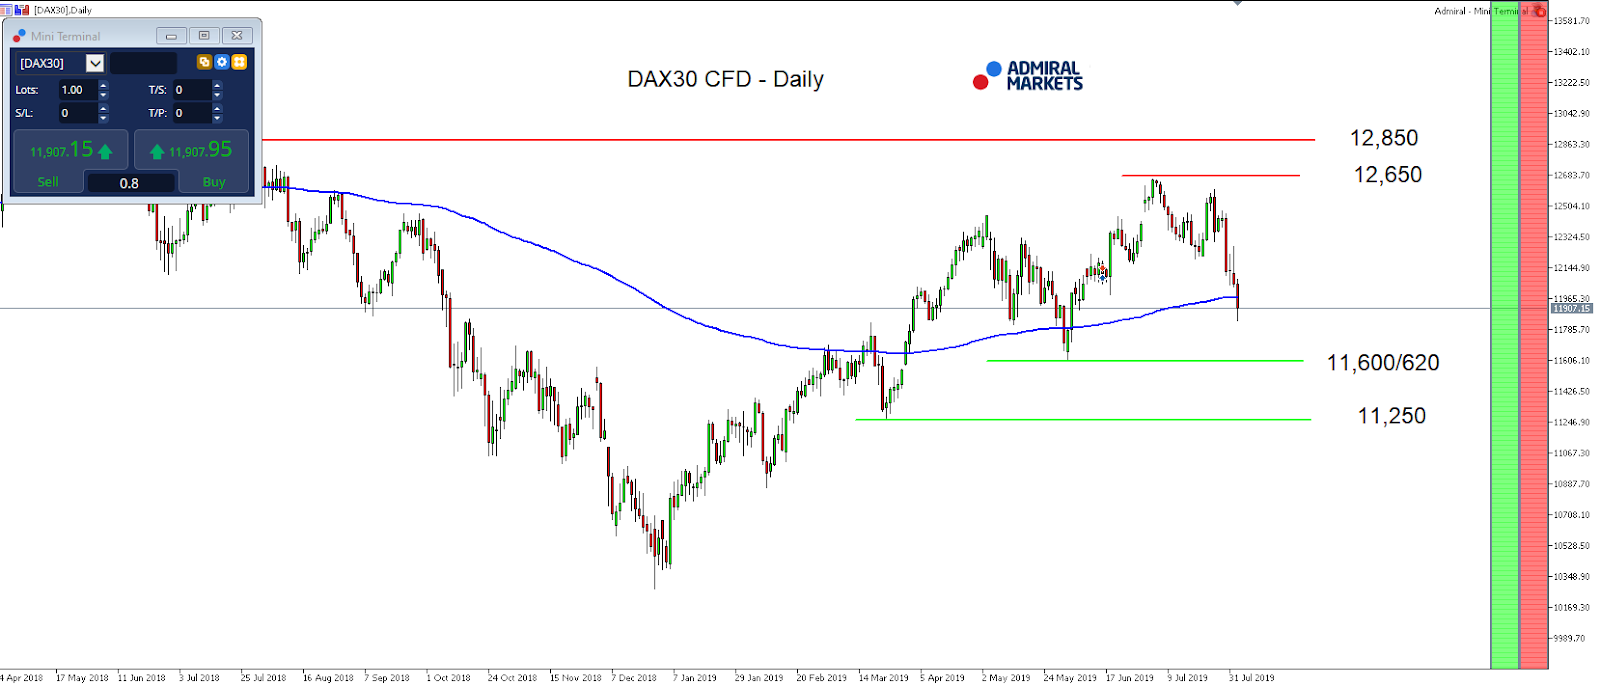
As we begin the trading week, we want to have a look at the DAX30 CFD. After the FED rate decision last Wednesday and the first hours of trading on Thursday, it looked as if the German index could easily stabilise above the psychological relevant level around 12,000 points.

This changed dramatically after US president Trump announced a new round of tariffs late last Thursday. Among them were 10% new tariffs on Chinese goods beginning September, pushing Equities aggressively lower and levelling the path for the DAX30 CFD to close the week below 12,000 points.

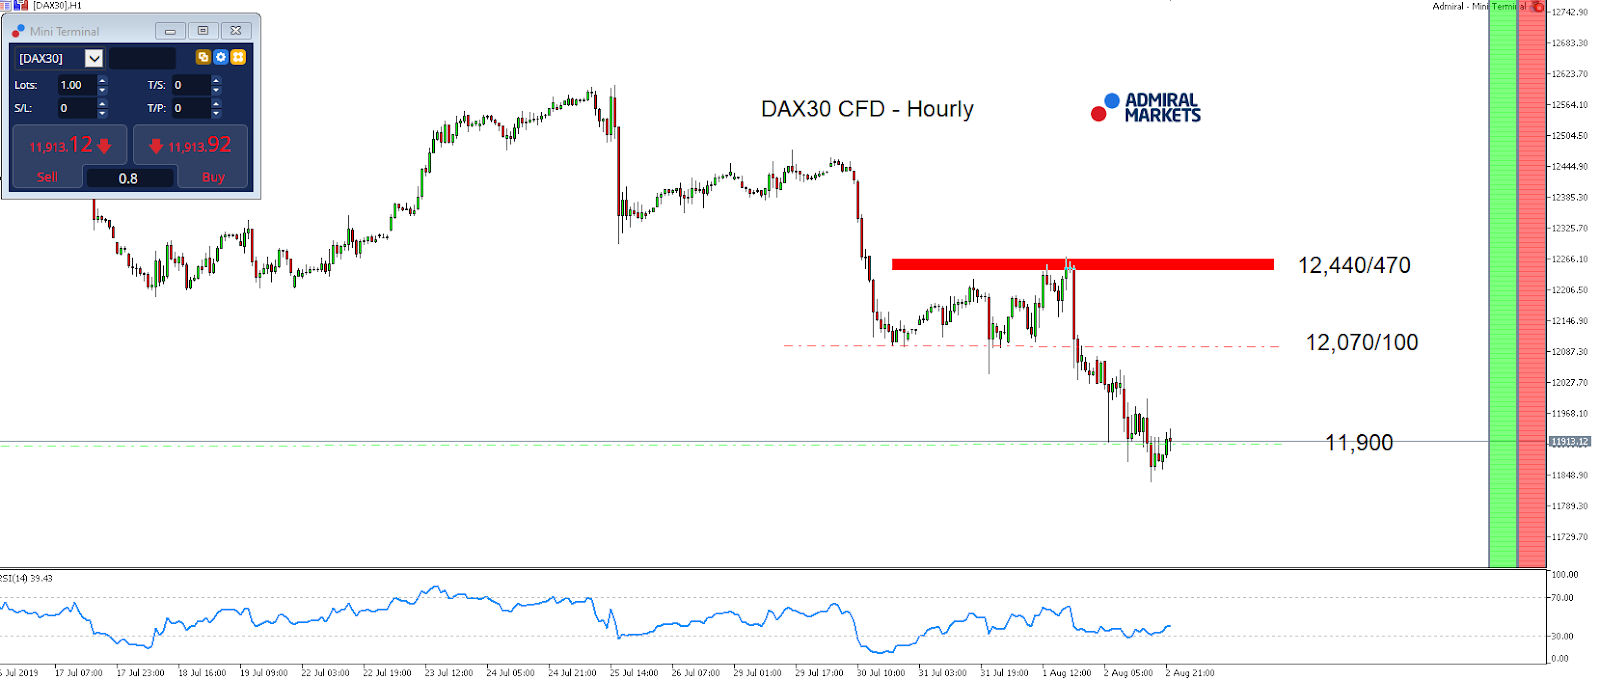
And with a thin economic docket today and the rest of the week, the approach seems to clearly be ‘sell the bounce’ as the German index is vulnerable to further losses, especially if the region around 11,900 points cannot be held.

A break below is also going hand in hand with a break back below the EMA(200) on a daily time frame, switching the overall mode to bearish again, and making it likely that bigger market participants start to unwind their long-positions in Equities.

Below 11,900 points the next target on the downside can be found around the June lows around 11,600 points:

Source: Admiral Markets MT5 with MT5-SE Add-on DAX30 CFD Hourly chart (between July 16, 2019, to August 2, 2019). Accessed: August 2, 2019, at 10:00pm GMT – Please note: Past performance is not a reliable indicator of future results, or future performance.

Source: Admiral Markets MT5 with MT5-SE Add-on DAX30 CFD daily chart (between April 24, 2018, to August 2, 2019). Accessed: August 2, 2019, at 10:00pm GMT – Please note: Past performance is not a reliable indicator of future results, or future performance.

In 2014, the value of the DAX30 CFD increased by 2.65%, in 2015, it increased by 9.56%, in 2016 it increased by 6.87%, in 2017 it increased by 12.51%, in 2018 it fell by 18.26%, meaning that after five years, it was up by 10.5%.

Discover the world’s #1 multi-asset platform

Admiral Markets offers professional traders the ability to trade with a custom, upgraded version of MetaTrader 5, allowing you to experience trading at a significantly higher, more rewarding level. Experience benefits such as the addition of the Market Heat Map, so you can compare various currency pairs to see which ones might be lucrative investments, access real-time trading data, and so much more. Click the banner below to start your FREE download of MT5 Supreme Edition!

Download MetaTrader 5 and begin trading today!

Disclaimer: The given data provides additional information regarding all analysis, estimates, prognosis, forecasts or other similar assessments or information (hereinafter “Analysis”) published on the website of Admiral Markets. Before making any investment decisions please pay close attention to the following:

  1. This is a marketing communication. The analysis is published for informative purposes only and are in no way to be construed as investment advice or recommendation. It has not been prepared in accordance with legal requirements designed to promote the independence of investment research, and that it is not subject to any prohibition on dealing ahead of the dissemination of investment research.
  2. Any investment decision is made by each client alone whereas Admiral Markets shall not be responsible for any loss or damage arising from any such decision, whether or not based on the Analysis.
  3. Each of the Analysis is prepared by an independent analyst (Jens Klatt, Professional Trader and Analyst, hereinafter “Author”) based on the Author’s personal estimations.
  4. To ensure that the interests of the clients would be protected and objectivity of the Analysis would not be damaged Admiral Markets has established relevant internal procedures for prevention and management of conflicts of interest.
  5. Whilst every reasonable effort is taken to ensure that all sources of the Analysis are reliable and that all information is presented, as much as possible, in an understandable, timely, precise and complete manner, Admiral Markets does not guarantee the accuracy or completeness of any information contained within the Analysis. The presented figures refer that refer to any past performance is not a reliable indicator of future results.
  6. The contents of the Analysis should not be construed as an express or implied promise, guarantee or implication by Admiral Markets that the client shall profit from the strategies therein or that losses in connection therewith may or shall be limited.
  7. Any kind of previous or modeled performance of financial instruments indicated within the Publication should not be construed as an express or implied promise, guarantee or implication by Admiral Markets for any future performance. The value of the financial instrument may both increase and decrease and the preservation of the asset value is not guaranteed.
  8. The projections included in the Analysis may be subject to additional fees, taxes or other charges, depending on the subject of the Publication. The price list applicable to the services provided by Admiral Markets is publicly available from the website of Admiral Markets.
  9. Leveraged products (including contracts for difference) are speculative in nature and may result in losses or profit. Before you start trading, you should make sure that you understand all the risks.

By Admiral Markets

EURUSD: bulls run out of steam at the 90th degree

By Alpari.com

Previous:

Trading on the safe haven currencies closed up last week, with everything else losing ground. The biggest loser against the US dollar was the pound (-1.80%), followed by the Aussie dollar (-1.60%), the Kiwi dollar (-1.45%), the Canadian dollar (-0.27%), and the euro (-0.17%). The yen posted a rise of 1.94% against the greenback, while the Swiss franc jumped 1.11%.

As the US-China trade conflict heated up once again, and investors retreated to the safe havens, the US jobs report was largely ignored. 164k new jobs were added outside the agricultural sector against a downwards revised reading of 193k for June (down from 244k). The reading for May was revised downwards from 72k to 62k, bringing the aggregate revision for the two months to -44k. The unemployment rate remained unchanged at 3.7%. Average hourly earnings rose by 0.3%, the same amount as the previous month.

The EURUSD pair traded within a 30-pip range. Judging by the chart, you wouldn’t have guessed that the NFP report came out on Friday.

Day’s news (GMT+3):

  • 10:50 France: Markit services PMI (Jul).
  • 10:55 Germany: Markit services PMI (Jul).
  • 11:00 Eurozone: Markit services PMI (Jul).
  • 11:30 UK: Markit services PMI (Jul).
  • 11:30 Eurozone: Sentix investor confidence (Aug).
  • 16:45 US: Markit services PMI (Jul).
  • 17:00 US: ISM non-manufacturing PMI (Jul).

EURUSD H1Current situation:

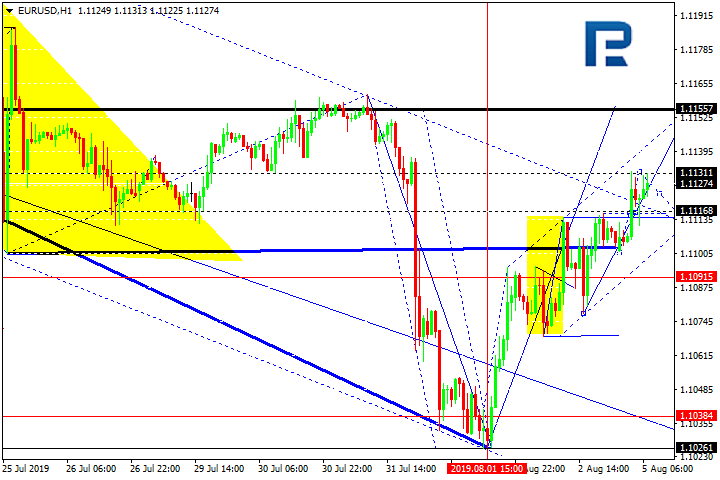
On Monday the 5th of August, trading on the euro opened up, with investors continuing their retreat towards safe haven assets on the back of increased trade tensions. Gold and yen are on the rise, the Chinese yuan has dropped against the US dollar, and Asian stocks are declining.

At the time of writing, the euro is trading at 1.1124 against the dollar. The pair is taking a breather at the 90th degree. There’s a chance the pair could move within a wedge formation to reach 1.1142. Given that the indicators are overbought, and that the market is in risk-off mode, I’m predicting a decline to 1.1110. I don’t think the pair will go any lower because of the fact that the euro is a funding currency, and as stocks begin to decline overseas, the Europeans will start opening long positions on the euro.

Iran has reportedly detained another tanker on the Strait of Hormuz, further increasing tensions with the US. If Trump insists on a military response, the rise on the EURUSD will continue all the way to 1.1175. There’s a crucial support level at the 45th degree (1.1080).

By Alpari.com

The US-China Relations Are Escalating

by JustForex

The US dollar is falling against a basket of currency majors due to the escalation of trade relations between the US and China. It should be recalled that US President, Donald Trump, promised to impose additional 10% tariffs on the remaining $300 billion worth of Chinese imports. This decision was caused due to the fact that China slowed down closing a trade deal with the US. In turn, China threatened to take retaliatory measures. The Chinese government has asked state-owned enterprises to suspend imports of US agricultural products. The US dollar index (#DX) closed Friday’s trading session in the negative zone (-0.30%).

On Friday, mixed economic data on the US labor market were also published. So, the number of people employed in the nonfarm sector counted to 164K in July, which met the expectations of investors. However, the previous value was revised downward from 224K to 193K. The unemployment rate counted to 3.7% in July, which also met experts’ forecasts. The growth of the average hourly earnings exceeded market expectations and counted to 0.3% (m/m). Today we expect the publication of important economic data from Germany, the UK, and the US.

The “black gold” prices show negative dynamics. Currently, futures for the WTI crude oil are testing the $54.70 mark.

Market Indicators

On Friday, aggressive sales were observed in the US stock markets: #SPY (-0.75%), #DIA (-0.36%), #QQQ (-1.47%).

The 10-year US government bonds yield has updated local lows. At the moment, the indicator is at the level of 1.75-1.76%.

The news feed for 2019.08.05:

– Some indicators on economic activity in Germany and the Eurozone at 10:55 (GMT+3:00) and 11:00 (GMT+3:00), respectively;
– UK services PMI at 11:30 (GMT+3:00);
– ISM non-manufacturing PMI in the US at 17:00 (GMT+3:00).

by JustForex

Trump’s Surprise Tariff Threat Sinks Markets

By Orbex

US President Trump’s announcement on additional tariffs on new import products from China last Friday shocked the markets. All related asset classes fell significantly lower as risks amid China’s retaliation increased. With the Nonfarm payrolls disappointing and a rather quiet week on the US economic calendar, the dollar could weaken further. Treasury yields seem to be pricing in another rate cut.

Dollar Falls on Market Reaction

With investors running to safety due to increasing trade escalation between the US and China, markets have remained highly risk-averse since last week. Following a rather poor NFP release last Friday, the slide on the common currency pair is likely to persist to lower levels. A chance for a breather could appear after today’s ISM NMI release, where economists expect an expansion from 55.1 to 56.4.

USDJPY Heads Towards Fresh 2019 Low

The breakout below the 78.6% Fibonacci retracement near 106.60 this morning revalidates the initial market response following Trump’s announcement. With no lower support near the said level, the 2019 flash-crash low of 105 comes back on the investors’ radar. This will remain the next major support until a downside breakout takes us to 104.60.

USDJPY

Gold Reaches May 2013 High

Increased tensions in the Middle East and trade war escalations are likely to keep market participants closer to safe-haven assets. With chances of a September rate cut increasing and central banks looking to accommodate as much as needed. Gold is likely to extend its up move in the coming days, and perhaps even for the medium term.

XAUUSD Could Retrace A Tad Lower

The price extension to 1460 this morning really shows off this week’s market sentiment. Following a breakout above last month’s high at 1453, investors now eye the 1475 level, reached in April 2013. With a retracement expected to weigh on the exchange rate, a short-term decline can be expected from intraday flows, but nothing that could change the longer-term outlook.

Oil Turns Lower By Trade War Narrative

The oil markets were hit hard last week, sliding lower amid a poor API report on weekly crude oil inventories and by Trump’s sudden trade shift against China. With new tariffs adding concerns about oil demand and the ISM manufacturing worsening, oil prices could dampen lower in the short and mid-term.

WTI Could Break Down to Fresh Lows

With oil prices failing to fall outside the ascending channel investors now will keep a close eye at 54.85support. The 3-week low at 53.62 will be the next minor support should bulls weaken their bets, but this level could be still a few days out of reach given the stochastic is oversold.

WTI

By Orbex


Weekly Market Outlook: RBA & RBNZ

By Orbex

The economic docket for the week ahead is expected to remain somewhat slow. The RBA and the RBNZ will be holding their respective monetary policy meetings this week. As a result, focus shifts to the AUD and the NZD for the week ahead. Both the central banks are currently on an easing cycle.

New Zealand will also be releasing its quarterly jobs report covering the three months ending June 2019. New Zealand’s unemployment rate has been hovering around 4.2% and 4.3% over the past two quarterly periods.

Here’s a quick recap of what’s to come in the currency markets this week.

Eurozone 

The services PMI reports will be coming out this week from the eurozone. The services sector is expected to pull through amid a slowdown in the manufacturing sector. An upbeat report is unlikely to do much for the euro area. With the ECB already signaling that it will ease come September, the services PMI report could be brushed aside.

The UK will be reporting on its GDP figures this week. Forecasts show that economic activity is expected to rise by 1.8% on the year in the second quarter. This marks an unchanged print from the previous quarter. Besides the GDP report, the monthly industrial and manufacturing production figures are also due.

The European Central Bank will be releasing its monetary policy meeting minutes this week. The meeting minutes could prove to be critical for the markets. With the central bank announcing its willingness to ease further, the minutes could provide further details into the ECB’s plans.

Economic data from the United States this week takes a backseat. The week starts off with the ISM’s non-manufacturing PMI report that is due to come out on Monday.

RBA Likely to Maintain Easing Bias

The Reserve Bank of Australia has been in an easing cycle, in line with the global central banks. The RBA has already lowered interest rates twice this year in June and July. The cash rate currently stands at 1.00%, which marks a record low for the country’s interest rates.

Following the two rate cuts, it is unlikely that the RBA will be following through with another rate cut this month. If it does, it would be the third consecutive cut, which is unlikely to happen in August.

Economists do expect the RBA to deliver one more rate cut later this year, perhaps during the autumn period. This would bring Australia’s interest rates to a new low of 0.75%.

The central bank is likely to remain on the sidelines this week. The RBA will, however, focus on forward guidance, as it is also seeing a slowdown in the labor market. Australia’s unemployment rate has been consistently below the RBA’s target for a while now. Therefore, the central bank could wait for the jobs report for July and August before deciding on the next move.

Will the RBNZ Cut Interest Rates Again?

The markets are quite divided heading into this week’s monetary policy meeting. The Reserve Bank of New Zealand could cut interest rates once again, marking a second consecutive monthly rate cut.

The RBNZ’s official cash rate stands at 1.50%. The central bank lowered interest rates in May this year, delivering a 25 basis point rate cut. This brought the official cash rate from 1.75% to 1.50%.

The RBNZ’s rate cut this week could bring the official cash rate to 1.25%. This would mark a historic low in the OCR.

The RBNZ’s forward guidance will also play an important role this week. The central bank is expected to maintain an easing bias. Further rate cuts cannot be ruled out, and the RBNZ’s monetary policy meeting comes in a week that also includes the quarterly labor market data.

The cooling economic conditions are likely to reflect in the labor market as well. This could potentially lower the prospects of inflation expectations. New Zealand’s inflation is likely to slip further away from the RBNZ’s inflation target rate.

By Orbex