Belarus’ central bank lowered its benchmark refinancing rate by 50 basis points to 9.50 percent to ensure interest rates remain neutral and inflation meets the target this year in light of a more intense slowdown of inflation in the second quarter of this year. It is the first rate cut by the National Bank of the Republic of Belarus since June 2018 but extends the easing cycle that was begun in April 2016. Since then the bank’s repo rate has been lowered by a total of 15.50 percentage points. In addition to the cut to the refinancing rate, the central bank’s board said the rate on overnight credit would be cut by 75 basis points to 10.75 percent while the rate on overnight deposits would be cut by 25 basis points to 8.25 percent. All the central bank’s new and lower interest rates will take effect from Aug. 14. Inflation in Belarus slowed to 5.7 percent in June from 6.2 percent in May and the central bank said its assessment of consumer price growth, which excludes seasonal changes, shows a decline in inflation to below its target of 5.0 percent. In the previous three quarters, inflation was higher than this indicator, the bank added. “Further decisions in the field of the National Bank’s key interest rates will depend on the correlation between the inflationary and deflationary factors,” the central bank said.
The National Bank of the Republic of Belarus released the following press release on Aug. 7:
“On August 14, 2019, the refinancing rate will be reduced from 10% to 9.5% per annum and the rate on overnight credit – from 11.5% to 10.75% per annum and that on overnight deposit – from 8.5% to 8.25% per annum.
The corresponding decisions were taken by the Board of the National Bank of the Republic of Belarus following the results of the meeting on monetary policy held on August 7, 2019.
In 2019 Q2, the intensity of inflationary processes slowed down. The assessment of consumer price growth, excluding seasonality for 2019 Q2, shows its decrease below the target level being 5% (during the previous three quarters, the growth was higher than this indicator).
The decisions taken in the field of interest rate policy ensure that it remains neutral in the context of the forecasted deceleration in inflation processes and the achievement of the inflation target for 2019.
The reduction in overnight credit and overnight deposit rates will narrow the interest rate collar on instruments designed to regulate banks’ liquidity and will increase the efficiency of the monetary policy transmission mechanism.
Further decisions in the field of the National Bank’s key interest rates will depend on the correlation between inflationary and deflationary factors.
The next meeting on monetary policy of the Board of the National Bank of the Republic of Belarus is planned for November 6, 2019.”
Allakos Inc. shares are soaring today as the company reported Q2/19 earnings and announced positive results from its phase 2 study for its AK002 inhibitor used in the treatment of eosinophil and mast cell related diseases.
Clinical stage biotech company Allakos Inc. (ALLK:NASDAQ)announced second quarter earnings today for the period ending June 30, 2019, and released a statement that it had successfully completed its phase 2 study for AK002 used in the treatment of eosinophil and mast cell related diseases. The market has responded very favorably to the news with the firm’s shares opening nearly 100% higher today.
In the earnings report, Allakos, still a clinical stage company, did not report any revenue in the quarter. The firm stated that research and development (R&D) expenses were $14.1 million in Q2/19 compared to $7.1 million in Q2/18. The increase in R&D expenses was primarily related to an increase in contract research and development activities in support of the advancement of AK002, the company’s lead antibody, as well as an increase in consulting and personnel-related costs.
General and administrative expenses (SG&A) were $5.9 million in Q2/19 versus $2.4 million in Q2/18. The firm noted that the increase in SG&A expenses was primarily attributable to an increase in personnel-related costs as a result of an increase in employee headcount, and incremental expenses incurred from outside professional service expenses associated with becoming a publicly traded company in July 2018.
The company reported a net loss of $19.1 million Q2/19 compared to $9.4 million Q2/18, an increase of $9.7 million. Net loss per basic and diluted share improved to $0.44 for Q2/19 compared to $4.17 in Q2/18. The firm ended Q2/19 with $153.1 million in cash, cash equivalents and marketable securities.
In a separate release today, the company announced positive results from its phase 2 randomized, double-blind, placebo-controlled trial of AK002 in patients with eosinophilic gastritis and/or eosinophilic gastroenteritis. The firm reported “all AK002 dose arms showed clinically meaningful and statistically significant benefits compared to placebo on all prespecified primary and secondary endpoints, including gastrointestinal tissue eosinophil counts and patient reported disease symptoms…Statistically significant differences in patient symptoms between the active and placebo groups occurred one day following AK002 administration…patients with comorbid eosinophilic esophagitis treated with AK002 experienced statistically significant decreases in esophageal eosinophil counts and substantial reductions in patient reported dysphagia symptoms.”
Dr. Evan Dellon, M.D., a principal investigator of the study and professor of gastroenterology at the University of North Carolina, Chapel Hill, stated, “Eosinophilic gastritis, eosinophilic gastroenteritis, and eosinophilic esophagitis are severe debilitating diseases with no approved therapies…AK002 is unique in that it targets both eosinophils and mast cells, two major effector cell types that cause disease-related tissue damage. In this study, AK002 reduced eosinophil and mast cell counts and showed a statistically significant improvement in disease symptoms one day after administration.” Dr. Dellon elaborated further, “These are clinically meaningful changes, and these data suggest that AK002 could provide rapid and sustained benefit in patients with eosinophil gastrointestinal diseases and I look forward to the continued development of AK002 in these severe orphan conditions.”
Eosinophilic gastritis, eosinophilic gastroenteritis and eosinophilic esophagitis are severe orphan inflammatory diseases characterized by the presence of high levels of eosinophils in the stomach, duodenum or esophagitis, respectively. Allakos has received orphan drug designation for AK002 in eosinophilic gastritis and eosinophilic gastroenteritis.
Allakos describes itself as a clinical stage biotechnology company developing antibodies that target immunomodulatory receptors present on immune effector cells involved in allergic, inflammatory and proliferative diseases. The firm’s lead antibody AK002, which has been tested in five clinical studies, targets Siglec-8, an inhibitory receptor selectively expressed on human mast cells and eosinophils. AK002 has been shown to inhibit mast cells and deplete eosinophils, and in the studies, AK002 eliminated blood eosinophils and improved disease symptoms in patients with eosinophilic gastritis and/or eosinophilic gastroenteritis, eosinophilic esophagitis, severe allergic conjunctivitis, chronic urticaria and indolent systemic mastocytosis.
Allakos shares opened today up nearly 100% higher at $61.00 (+$30.00, + 96.77%) compared to Friday’s closing price of $31.00. Since the open, shares have traded between $60.34 and $71.95, setting both 52-week and all-time intraday highs on more than 15 times average volume. At present, shares are trading at $71.07 (+40.07, +129.26%).
Disclosure: 1) Stephen Hytha compiled this article for Streetwise Reports LLC and provides services to Streetwise Reports as an independent contractor. He or members of his household own securities of the following companies mentioned in the article: None. He or members of his household are paid by the following companies mentioned in this article: None. 2) The following companies mentioned in this article are billboard sponsors of Streetwise Reports: None. Click here for important disclosures about sponsor fees. 3) Comments and opinions expressed are those of the specific experts and not of Streetwise Reports or its officers. The information provided above is for informational purposes only and is not a recommendation to buy or sell any security. 4) The article does not constitute investment advice. Each reader is encouraged to consult with his or her individual financial professional and any action a reader takes as a result of information presented here is his or her own responsibility. By opening this page, each reader accepts and agrees to Streetwise Reports’ terms of use and full legal disclaimer. This article is not a solicitation for investment. Streetwise Reports does not render general or specific investment advice and the information on Streetwise Reports should not be considered a recommendation to buy or sell any security. Streetwise Reports does not endorse or recommend the business, products, services or securities of any company mentioned on Streetwise Reports. 5) From time to time, Streetwise Reports LLC and its directors, officers, employees or members of their families, as well as persons interviewed for articles and interviews on the site, may have a long or short position in securities mentioned. Directors, officers, employees or members of their immediate families are prohibited from making purchases and/or sales of those securities in the open market or otherwise from the time of the interview or the decision to write an article until three business days after the publication of the interview or article. The foregoing prohibition does not apply to articles that in substance only restate previously published company releases.
The cyclical nature of the American labor market may affect the dynamics of PCI.
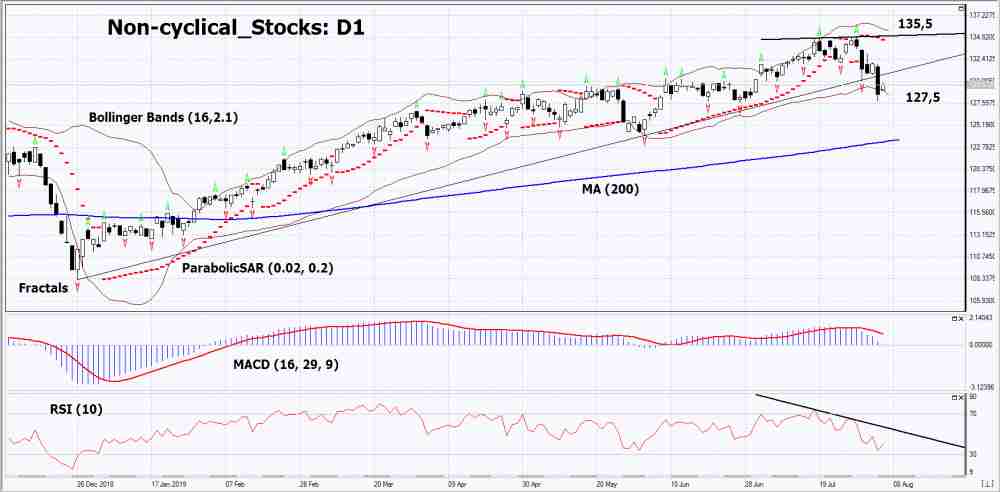
In this review, we suggest to consider a personal composite instrument (PCI) Non-cyclical_Stocks – Stock Index Non-cyclic stocks. It reflects the price dynamics of a portfolio of 6 shares of the world’s largest companies that produce consumer goods and services. Will the Non-cyclical_Stocks quotations fall?
After the announcement of new duties on Chinese goods, a correction began on the US stock market. Investors fear China’s retaliation and sanctions on US goods. Regarding American companies in the consumer sector, it can be noted that the unemployment rate in the US is now 3.7%. This is a minimum since 1969. The American labor market, as a rule, shows a cyclicality around an average level of 6%. In case of an increase in unemployment to the average historical level, the income of consumer companies may decrease.
On the daily timeframe Non-cyclical_Stocks: D1 has broken down the uptrend support line. Technical analysis indicators formed a downtrend signal. Further downward correction is possible in case of publication of negative macroeconomic and corporate data.
The Parabolic indicator demonstrates a downtrend signal.
The Bolinger bands widened, indicating a volatility increase. Both Bollinger Lines Slope Down.
The RSI indicator is below the 50 mark . It has formed a divergence to decrease.
The bearish momentum may develop if Non-cyclical_Stocks drops below its last low: 127.5. This level can be used as an entry point. The initial stop lose may be placed higher than the last upper fractal, historical high, Bollinger upper line and Parabolic signal: 135.5. After opening the pending order, the stop shall be moved following the signals of Bollinger and Parabolic to the next fractal minimum. Thus, we are changing the potential profit/loss to the breakeven point. More risk-averse traders may switch to the 4-hour chart after the trade and place a stop loss moving it in the direction of the trade. If the price meets the stop level (135,5) without reaching the order (127,5), we recommend to cancel the order: the market sustains internal changes that were not taken into account.
Tensions between the US and China have continued to erupt this week.
President Trump unexpectedly announced fresh 10% tariffs on a further $300 billion of Chinese goods, due to start September 1st. Following this, the US Treasury has now labeled China as a “currency manipulator”.
The accusation comes in the wake of the sharp weakening of CNH on Monday. This saw USDCNH trading up through the 7 level for the first time since the GFC in 2008.
The Treasury’s statement marks a follow through on Trump’s consistent threats to reinstate the ‘currency manipulator’ label, which has not been applied since 1994. The Treasury said that China had artificially weakened CNH against USD to gain “an unfair competitive advantage in international trade”.
Ahead of the US Treasury’s official statement, Trump took to Twitter, as usual, to criticize China, writing:
China Responds
However, China has immediately responded and firmly rejected the accusation. The People’s Bank of China said in a statement released yesterday:
“The United States disregards the facts and unreasonably affixes China with the label of ‘currency manipulators,’ which is a behavior that harms others and oneself…The Chinese side firmly opposes this.”
The statement continued, with the PBoC saying that such a move by the US will not only “seriously undermine the international financial order, but also trigger financial market turmoil. It will also greatly hinder international trade and the global economic recovery, and ultimately will suffer from it.”
US To Pursue IMF Decision
While the US will now make a case to the International Monetary Fund following its accusation, the claim is unlikely to lead to any formal penalties. The accusation is more symbolic than anything.
“This unilateral act of the United States also undermines the global multilateral consensus on exchange rate issues and has a serious negative impact on the stable operation of the international monetary system… The Chinese side advises the U.S. to leap over the cliffs and return to the correct track of rationality.”
Trade Deal Hopes in Tatters
This latest escalation in tensions has cast further doubt on the likelihood of a trade deal. While a further round of trade talks is scheduled for September, it seems increasingly likely that these talks will be abandoned.
Goldman Sachs: No Trade Deal Until 2020
In a research note released this week, Goldman Sachs advised clients that it now no longer expected the US and China to deliver a trade deal before 2020.
In the note, the leading US investment bank said:
“While we had previously assumed that President Trump would see making a deal as more advantageous to his 2020 re-election prospects, we are now less confident that this is his view,”
Goldman Sachs: Fed to Cut Again
Commenting on the implications of Fed monetary policy, the note said that the Fed was “increasingly responsive” to trade war risks. It added:
“In light of growing trade policy risks, market expectations for much deeper rate cuts, and an increase in global risk related to the possibility of a no-deal Brexit, we now expect a third 25bp (basis point) rate cut in October, for a total of 75bp of cuts,”
Technical Perspective
For now, USDCNH remains near the middle of the range between the 7 level and the 7.1382 breakout highs. While above 7, focus remains on a further break higher though we are more likely to see a period of consolidation for now. Drifts back towards 7 should find buyers while any moves higher will likely meet offers into the new highs.
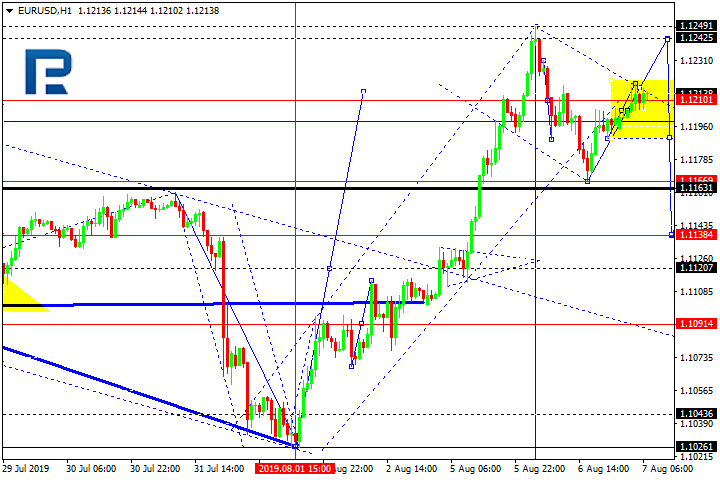
EURUSD has finished the first descending impulse along with the correction at 1.1210. According to the main scenario, the price may form the second descending impulse to break 1.1166 and then continue trading inside the downtrend with the short-term predicted target at 1.1120. However, an alternative scenario implies that the pair may form one more ascending structure to reach 1.1242 and then resume trading downwards.
GBPUSD, “Great Britain Pound vs US Dollar”
GBPUSD has reached the target of Flag pattern. Today, the pair may continue trading inside the downtrend towards 1.2000. The first downside target is at 1.2133. Later, the market may form one more ascending structure towards 1.2171 and then start another decline to reach 1.2078. After that, the instrument may grow towards 1.2130 and then continue trading downwards with the key downside target at 1.2000.
USDCHF, “US Dollar vs Swiss Franc”
USDCHF has completed the first ascending wave along with the correction. Possibly, today the pair may form the second impulse to break 0.9815 and then continue trading inside the uptrend with the predicted target at 0.9870. However, an alternative scenario implies that the price may form a new descending structure to reach 0.9725 and then resume moving upwards.
USDJPY, “US Dollar vs Japanese Yen”
USDJPY is still consolidating around 106.10 in the center of the range. Today, the pair may fall towards 105.60 and then start a new growth to return to 106.10. Later, the market may continue trading downwards with the key downside target at 105.11. However, an alternative scenario implies that the price may continue the correction to reach 106.60.
AUDUSD, “Australian Dollar vs US Dollar”
AUDUSD has reached its downside target. Possibly, today the pair may form a new consolidation range near the lows. Possibly, the pair may start another decline towards 0.6670 and then form one more ascending structure with the target at 0.6770.
USDRUB, “US Dollar vs Russian Ruble”
USDRUB is consolidating at the top of the ascending wave. Possibly, the pair may update 65.50 and then resume trading downwards with the first target at 64.15.
XAUUSD, “Gold vs US Dollar”
Gold is moving upwards. After breaking 1475.80 and forming a continuation pattern, today the pair may extend this structure towards 1497.11 (an alternative scenario). According to the main scenario, the price may start forming the first descending wave with the target at 1440.00.
BRENT
Brent is still moving downwards; it has broken 59.90 and may continue falling towards 58.45. After that, the instrument may form a new consolidation range with a reversal pattern. The pair is expected to start the first ascending wave with the target at 63.15.
Attention! Forecasts presented in this section only reflect the author’s private opinion and should not be considered as guidance for trading. RoboForex LP bears no responsibility for trading results based on trading recommendations described in these analytical reviews.
Over the past few weeks and months, we’ve been alerting our followers to the incredible setups in Natural Gas and Crude Oil. If you’ve been following our research, you already know on May 21st we called for Oil to break down from $62 level with a target of $55 then $49 price levels.
We’ve been alerting that Natural Gas was setting up an incredible seasonal trade with a move that was likely to push lower into the $2.00 to $2.20 level – suggesting any move into this range would be a solid buying opportunity for the seasonal upside move. Well, here we are about 35 days later and look at what happened.
Crude Oil Weekly Chart
The US/China trade issues and global economic turmoil is taking a toll on Crude Oil. Price rotated downward very sharply last week with an incredible -8% downside move in one day. Currently, price is resting just above the Moving Average and should soon breakdown below this level towards the $49 price level. At that point, price should stall, briefly, before attempting to find support below $50.
Our Fibonacci price modeling system suggests true support is found near $45 and $40. Be prepared for a potential downside move of -20% to -25% from current levels.
Natural Gas Weekly Chart
Natural Gas has done exactly what we expected. On this Weekly chart, you can see our shaded BLUE support range area and our GREEN and RED arrows from months ago highlighting what we expected to happen in price. Yes, price is lower than we currently expected, but it has aligned with our expected price rotation almost perfectly.
At this point, the sub $2.20 level is a perfect opportunity for skilled technical traders to prepare for the seasonal trend that will push Natural Gas back above the $2.65 to $3.15 level. Allow us to go through our expectations with you so you understand how to plan for and trade this move.
August is typically moderately bearish for NG. So expect to try to pick your entry for this trade in August. The ratio of bearish price activity in August is 1.2x the bullish price activity.
September is STRONGLY BULLISH – with an upside ratio of 10x compared to historical downside price activity. September is where we should see a big upside price move.
October is still STRONGLY BULLISH – with an upside ratio of 3x compared to historical downside price activity.
November is moderately bullish with a 1.3x upside ratio compared to downside price activity.
VIDEO – TODAYS MARKET ANALYSIS SPX, BONDS, GOLD, OIL, NAT GAS
If you want to get access to my trading indicators and market prediction tools checkout these charts here
CONCLUDING THOUGHTS:
This means two things. First, Crude Oil should continue to breakdown and target the $49 price level over the next few days and weeks while Natural Gas sets up an incredible upside price setup below $2.25 for skilled technical traders. Oil is moving lower because of lower demand related to the global economic slowdown and larger supply issues. Natural Gas is setting up a seasonal pattern that could become a fantastic trading opportunity for traders that time their entries and understand the setup. In late August or early September price should begin to rally well above $2.50 with an ultimate upside target of well above $3.00.
In short, if you want to know what the market is going to nearly every day and get my trade alerts complete with entry, targets and stop prices join my Wealth Building Newsletter – TheTechnicalTraders.com
As we can see in the H4 chart, EURUSD is testing the descending channel’s upside border and forming several reversal patterns, including Engulfing. At the moment, we may assume that despite the fundamental background the price may reverse and fall towards 1.1112 to continue forming the descending channel. However, one shouldn’t exclude a possibility that the price may break the resistance level and continue growing towards 1.1276.
USDJPY, “US Dollar vs. Japanese Yen”
As we can see in the H4 chart, the ascending tendency continues. After breaking the channel’s downside border and forming Hammer reversal pattern close to the support level, USDJPY has completed a slight pullback. Right now, the pair is testing the level again. Judging by the previous movements, it may be assumed that after testing the horizontal support line the price may resume trading upwards to reach 107.25. However, we shouldn’t ignore a possibility that the instrument may break the support line, update the low at 105.51, and continue its decline.
Attention! Forecasts presented in this section only reflect the author’s private opinion and should not be considered as guidance for trading. RoboForex LP bears no responsibility for trading results based on trading recommendations described in these analytical reviews.
A day after equities plunged and the yields on the treasury bonds fell sharply, there was some sense of normalcy. Major equity indices managed to post a modest recovery following the sharp sell-off. However, it is unlikely that the clouds of uncertainty have lifted. The US has officially labeled China as a currency manipulator. This potentially has implications as the US is likely to bring in the IMF to reduce China’s so-called advantage due to its weaker exchange rate.
Euro Turns Flat on the Day
The euro currency was seen trading flat by late Tuesday’s US session. However, prices were flat after the euro rose to a one-month high. The common currency rose to intraday highs of 1.1248 before easing back on the day. Economic data from the eurozone was sparse and it was a similar case from the US as well, keeping EURUSD in check.
EURUSD to Settle into a Sideways Range
The currency pair managed to lift off right after hitting a fresh two-year low just a week ago. While this helped EURUSD to rise to a one-month high, the current momentum looks to be fading. This could keep the sideways range within 1.1250–1.1140 back into the foreground. However, the bias to the upside looks to be building up.
Oil Remains Weak on Trade War Escalations
WTI crude oil prices continued to remain weak. This was initially due to the stronger USD and later followed up by the US announcing new tariffs on Chinese imports. The threat of rising trade wars has dampened the global outlooking, putting downward pressure on the oil markets. Today’s EIA’s report on crude oil inventories will be closely watched. Forecasts show a possible drawdown to the tune of 2.9 million barrels.
WTI Likely to Lose the 54.42 Support
Price action in WTI crude oil currently indicates that oil prices could be turning weaker in the near term. The support level at 54.42 which held up so far is looking to give way to further declines. Today’s EIA inventory could be just the catalyst. A breakdown below the 54.42 support will push oil prices down to the 51.70 level of support next.
Gold Rallies on the Back of Risk Aversion
The precious metal continued to maintain the strong upside momentum. Gold prices rose to fresh highs on Tuesday, testing highs of 1474. The gains in gold come about as the recent declines in equity markets saw a strong risk aversion. Investors shed the risk appetite and fled to safe-haven assets amid continued uncertainty.
XAUUSD Likely to Test 1500 Next
If the current momentum is anything to go by, gold prices could be seen rising to 1500 in the near term. This would mark a new six-year high, at which gold is already trading. Technically, the upside breakout from the ascending triangle pattern indicates the minimum upside target to the 1500 level. Any declines could be limited to the breached resistance level of 1431–1428 region.
During yesterday’s trading, the majors showed a variety of trends. EUR/USD quotes retreated from local highs. Financial market participants continue to monitor trade negotiations between the US and China. At the moment, the EUR/USD currency pair is consolidating in the range 1.11850-1.12150. A trading instrument can recover further We recommend opening positions from key levels.
The Economic News Feed for 07.08.2019 is calm.
Indicators indicate the strength of buyers: the price has fixed above 50 MA and 100 MA.
The MACD histogram is in the positive zone, but below the signal line, which gives a weak signal to buy EUR/USD.
The Stochastic Oscillator is in the neutral zone, the %K line is below the %D line, which indicates a bearish sentiment.
Trading recommendations
Support levels: 1.11850, 1.11600, 1.11150
Resistance levels: 1.12150, 1.12450, 1.12800
If the price consolidates above 1.12150, expect the quotes to grow toward 1.12450-1.12600.
Alternatively, the price can descend toward 1.11600-1.11400.
The GBP/USD currency pair
Technical indicators of the currency pair:
Prev Open: 1.21297
Open: 1.21368
% chg. over the last day: +0.06
Day’s range: 1.21355 – 1.21678
52 wk range: 1.2080 – 1.3385
The GBP/USD currency pair continues to trade in a protracted flat. Unidirectional trends are not observed. Participants in financial markets expect additional drivers. At the moment, the local support and resistance levels are: 1.21300 and 1.21800, respectively. We recommend keeping track of current information on the Brexit issue. In the near future, technical correction of the trading instrument after a prolonged fall is not out of the question. Positions must be opened from key levels.
The Economic News Feed for 07.08.2019 is calm.
Indicators do not give accurate signals, the price crossed 50 MA and 100 MA.
The MACD histogram is near the 0 mark.
The Stochastic Oscillator is in the neutral zone, the %K line is below the %D line, which gives a signal to sell GBP/USD.
Trading recommendations
Support levels: 1.21300, 1.20850, 1.20500
Resistance levels: 1.21800, 1.22500, 1.23000
If the price consolidates above 1.21800, the price will correct toward 1.22300-1.22500.
Alternatively, the price can reduce toward 1.20850-1.20600.
The USD/CAD currency pair
Technical indicators of the currency pair:
Prev Open: 1.32012
Open: 1.32756
% chg. over the last day: +0.50
Day’s range: 1.32635 – 1.33149
52 wk range: 1.2727 – 1.3664
The USD/CAD currency pair has again moved up. The trading tool has updated local highs. CAD is currently consolidating near the resistance at 1.33100. 1.32650 is already a “mirror” support. Pressure on the Canadian dollar is caused by a negative dynamics of oil prices. USD/CAD quotes have the potential for further growth. Investors expect important economic releases from Canada. Positions must be opened from key levels.
At 17:00 (GMT+3:00) Ivey index of business activity in Canada will be published.
Indicators point to the strength of buyers: the price has fixed above 50 MA and 100 MA.
The MACD histogram is located in the positive zone and above the signal line, which gives a strong signal to buy USD/CAD.
The Stochastic Oscillator is in the neutral zone, the %K line is below the %D line, which indicates a bearish sentiment.
Trading recommendations
Support levels: 1.32650, 1.32400, 1.32000
Resistance levels: 1.33100, 1.33500
f the price consolidates above 1.33100, expect further growth toward 1.33400-1.33600.
Alternatively, the quotes can drop toward 1.32400-1.32100.
The USD/JPY currency pair
Technical indicators of the currency pair:
Prev Open: 105.944
Open: 106.460
% chg. over the last day: +0.35
Day’s range: 105.933 – 106.464
52 wk range: 104.97 – 114.56
An ambiguous technical picture has developed on the USD/JPY currency pair. The trading instrument is in lateral movement. The “safe haven” currency is tested by the local support and resistance levels: 106,000 and 106.550, respectively. USD/JPY quotes have the potential for further correction. We recommend that you pay attention to the dynamics of yield on US government bonds. Positions must be opened from key levels.
The Economic News Feed for 07.08.2019 is calm.
Indicators do not provide accurate signals, the price has crossed 50 MA.
The MACD histogram is in the negative zone, which gives a weak signal to sell USD/JPY.
The Stochastic Oscillator is in the neutral zone, the %K line is above the %D line, which indicates a correction of USD/JPY quotes.
Trading recommendations
Support levels: 106.000, 105.550
Resistance levels: 106.550, 107.100, 107.500
If the price consolidates above 106.550, expect further correction toward 107.000-107.200.
Alternatively, the quotes can decrease toward 105.600-105.400.
USD is seeing some mild upside over the European morning on Wednesday, though moves remain subdued. The USD index is still languishing near the bottom of last week’s decline which pierced below the 97.11 level briefly. Price trades 97.44 last, sitting just up off support for now. Absence of key data today is likely to keep flows fairly contained amidst otherwise quiet summer trading.
Euro Heads Lower
EURUSD remains hemmed in against the 1.1217 level resistance today. In line with continued data weakness in the eurozone, the market is widely expecting the ECB to ease at its next opportunity. This week, German industrial production was shown to have fallen a further 1.5% over June, now down over 5% on the year so far.
Brexit Woes Weigh On Pound
GBPUSD remains under pressure today. Rhetoric from both the EU and the UK suggests that a no-deal Brexit is now the most likely outcome and UK PM Johnson has vowed to take the UK out of the EU by the current October 31stdeadline “do or die”. GBPUSD trades 1.2143 last, sitting just up off the recent 1.2073 lows.
Equities Extend Their Recovery
Risk assets have continued their recovery rally over the European morning on Wednesday. SPX500 has rallied hard off the sub 2816.41 lows posted yesterday, to trade 2885.03 last, fast approaching resistance at the 2890.56 level. The outlook for equities remains precarious however, given the ongoing tensions between the US and China. Yesterday, the US labeled China a “currency manipulator” for the first time since 1994, provoking an immediate rebuttal from the Chinese who denied the accusations.
Gold Still Bid
Safe havens have been mixed today with gold slightly higher against USD while JPY trades slightly lower. XAUUSD trades 1486.48 last with price firmly on its way to test the next resistance at 522.79 which was the 2012 and mid-2011 lows. USDJPY trades 106.27 last with price remaining hemmed in between support at the 105.55 level and resistance at 106.77.
Crude Down Despite Further Inventories Draw
Oil prices have been under pressure again today following a large slide yesterday which came despite the API reporting an 8th consecutive weekly drawdown in US crude stores, It seems that with the uptick in tensions between the US and China, concerns over the demand outlook are once again trumping shifts in inventory levels. The headline EIA report later today could fuel some movement if it confirms the drawdown. However, for now, crude trades 53.37, sitting well below the broken 54.90 support and on its way down to test next support at the 50.80 level.
High Betas Head Lower
USDCAD has continued its break higher today with price trading up to test the 1.3300 level which is holding as resistance for now. The break lower in crude prices is weighing on CAD, allowing for USD to rise against its counterpart in the near term as trade war concerns also knock CAD lower.
AUDUSD has been higher today, fuelled by cross flows from AUDNZD in the wake of an unexpected .50% rare cut from the RBNZ. AUDUSD trades .6732 last, though is still sitting well below the recent .6761 level which was broke yesterday to print fresh 2019 lows.