The USD/CAD holding 1.3000 after trade war fears hit markets again

By Admiral Markets

Source: Economic Events August 7, 2019 – Admiral Markets’ Forex Calendar

Today we want to have a look at the USD/CAD. After focussing 1.3000 into the end of the second quarter, the currency pair has seen a short rebound, stabilising above the psychologically relevant level.

One of the main reasons for the Loonie not taking on further bullish momentum, seems to be that the recent trade war fears, which not only triggered higher volatility (note: increasing volatility is usually CAD negative) but saw Crude Oil further decreasing after it got hit by around 7% last Thursday, when markets were threatened by global growth concerns after US President Donald Trump tweeted about more tariffs on Chinese goods from September onwards.

While this overall outlook makes it unlikely to see a drop below 1.3000 in the near future, or at least the short-term, the USD/CAD could probably see a push lower.

Today’s release of the Ivey PMI, giving an impression on Canada’s Business Confidence, is expected to come in at 53, slightly above last months’ reading at 52.4.

A better-than-expected reading could trigger CAD strength, since it would underline the hints from the BoC earlier in July where the central bank signalled that it currently sees no reason to follow any move by the Fed to lower rates.

That means on the other hand in our opinion that any disappointing reading could result in further USD/CAD gains back above 1.3300.

The technical key level seems to be found around 1.3260/3300: recapturing this region with backwind from a weak Ivey PMI reading would 1.3430/50 as a target on the downside.

Finding resistance here, on the other hand, leaves the currency pair vulnerable to another stint down to 1.3000/3050:
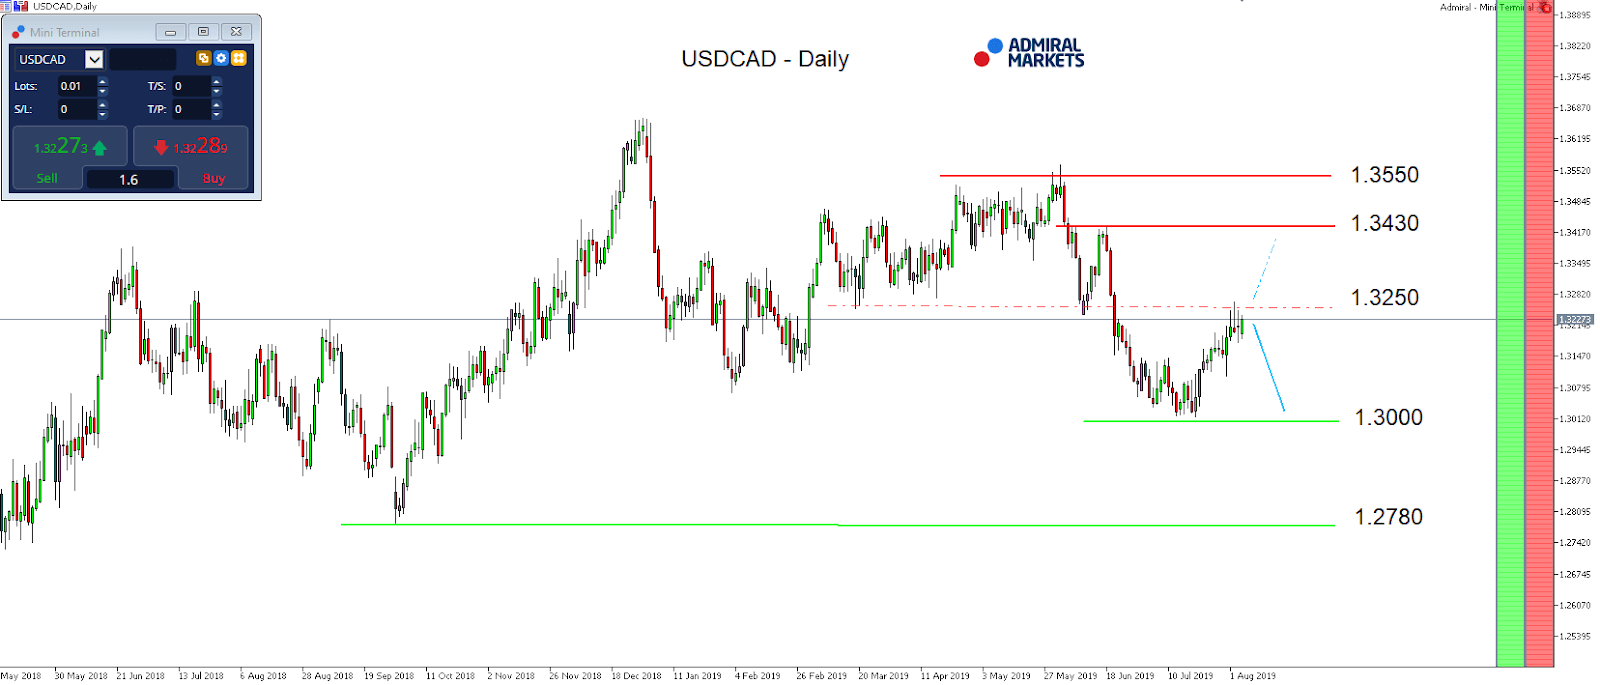
Source: Admiral Markets MT5 with MT5-SE Add-on USD/CAD Daily chart (between May 8, 2018, to August 6, 2019). Accessed: August 6, 2019, at 10:00pm GMT – Please note: Past performance is not a reliable indicator of future results, or future performance.

In 2014, the value of the USD/CAD increased by 9.4%, in 2015, it increased by 19.1%, in 2016, it fell by 2.9%, in 2017, it fell by 6.4%, in 2018, it increased by 8.4%, meaning that after five years, it was up by 28.4%.

Discover the world’s #1 multi-asset platform

Admiral Markets offers professional traders the ability to trade with a custom, upgraded version of MetaTrader 5, allowing you to experience trading at a significantly higher, more rewarding level. Experience benefits such as the addition of the Market Heat Map, so you can compare various currency pairs to see which ones might be lucrative investments, access real-time trading data, and so much more. Click the banner below to start your FREE download of MT5 Supreme Edition!

Download MetaTrader 5 and begin trading today!

Disclaimer: The given data provides additional information regarding all analysis, estimates, prognosis, forecasts or other similar assessments or information (hereinafter “Analysis”) published on the website of Admiral Markets. Before making any investment decisions please pay close attention to the following:

  1. This is a marketing communication. The analysis is published for informative purposes only and are in no way to be construed as investment advice or recommendation. It has not been prepared in accordance with legal requirements designed to promote the independence of investment research, and that it is not subject to any prohibition on dealing ahead of the dissemination of investment research.
  2. Any investment decision is made by each client alone whereas Admiral Markets shall not be responsible for any loss or damage arising from any such decision, whether or not based on the Analysis.
  3. Each of the Analysis is prepared by an independent analyst (Jens Klatt, Professional Trader and Analyst, hereinafter “Author”) based on the Author’s personal estimations.
  4. To ensure that the interests of the clients would be protected and objectivity of the Analysis would not be damaged Admiral Markets has established relevant internal procedures for prevention and management of conflicts of interest.
  5. Whilst every reasonable effort is taken to ensure that all sources of the Analysis are reliable and that all information is presented, as much as possible, in an understandable, timely, precise and complete manner, Admiral Markets does not guarantee the accuracy or completeness of any information contained within the Analysis. The presented figures refer that refer to any past performance is not a reliable indicator of future results.
  6. The contents of the Analysis should not be construed as an express or implied promise, guarantee or implication by Admiral Markets that the client shall profit from the strategies therein or that losses in connection therewith may or shall be limited.
  7. Any kind of previous or modeled performance of financial instruments indicated within the Publication should not be construed as an express or implied promise, guarantee or implication by Admiral Markets for any future performance. The value of the financial instrument may both increase and decrease and the preservation of the asset value is not guaranteed.
  8. The projections included in the Analysis may be subject to additional fees, taxes or other charges, depending on the subject of the Publication. The price list applicable to the services provided by Admiral Markets is publicly available from the website of Admiral Markets.
  9. Leveraged products (including contracts for difference) are speculative in nature and may result in losses or profit. Before you start trading, you should make sure that you understand all the risks.


By Admiral Markets

The Dollar Index Is Consolidating. Reserve Bank of New Zealand Collapsed Kiwi and Aussie

by JustForex

The US dollar won back part of losses during yesterday’s trading session. The US dollar index (#DX) closed in the positive zone (+0.11%). However, the US currency is still under pressure due to tensions between the US and China. The US Treasury has officially accused China of manipulating the national currency. At the same time, US President Donald Trump tried to suttle fears about a trade war with China and wrote on Twitter that the United States have a “very strong position.”

During the Asian trading session, the Reserve Bank of New Zealand has taken a decision on the key interest rate. Thus, the regulator unexpectedly lowered the indicator by 50 basis points to 1.00% per annum, while experts expected the interest rate to be lowered to just 1.25%. This decision of the Central Bank caused aggressive sales of Kiwi and Aussie.

The black gold prices are still declining. The WTI crude oil futures are currently testing the $53.45 per barrel mark. At 17:30 (GMT+3:00), the US crude oil inventories will be published.

Market Indicators

The bullish sentiment was observed yesterday in the US stock markets: #SPY (+1.40%), #DIA (+1.24%), #QQQ (+1.40%).

The 10-year US government bond yield fell sharply again. At the moment, the indicator is at the level of 1.68-1.69%.

The news feed for 2019.08.07:

– The index of business activity from Ivey in Canada at 17:00 (GMT+3:00).

by JustForex

Canada’s Ivey PMI To Rise In July

By Orbex

The monthly Ivey PMI report for Canada is scheduled for release today. Forecasts point to a recovery in the purchasing manager’s index for July, rising to 55.0.

This would mark a recovery from June’s reading where activity hit a four-month low. The index fell to 52.4 in June, down from 55.9 in May. It was the lowest level seen since February this year when PMI touched a low of 50.6.

This was the only second-lowest level since September 2018, when the index fell to 50.4.

Canada Ivey PMI
Canada Ivey PMI, June 2019

The decline in the index came on the back of weaker employment figures amid falling supplier deliveries.

The gauge of the employment index eased to 52.7 from 55.1 in May, while the adjusted supplier deliveries index contracted, falling to 48.9 from 52.4 in May. June’s figures were dismal.

This was the lowest level since February when the employment index was down at 51.8.

Aptly, the labor market indicators for June were weak. Canada’s economy shed 2,200 jobs during the month while the unemployment rate held steady. The data came out ahead of the BoC meeting in early July.

The Bank of Canada is currently on the sidelines as it waits to assess more incoming economic data. So far, preliminary reports showed that the economy is on track to rebound in the second half of the year.

While most of the central banks are shifting to an easing bias, the Bank of Canada is likely to keep interest rates on hold for now.

Canada’s Economic Landscape in July

In the first half, Canada’s economy slowed sharply amid global turbulence.

In June, Canada’s GDP slowed, following an increase of 0.5% and 0.3% respectively in March and April. The advance GDP report showed that Canada’s economy grew by 0.2%. This was slightly better than the expectations of a 0.1% increase.

The global economic conditions were relatively stable for the most part. The US and China resumed trade talks only closer to the end of the month. The impending Fed rate cut is also something that has been positive for the US.

As such, businesses in the Ivey PMI could show some optimism in the data for July.

But with the weakening in China, some of the Canadian firms could also experience a slowdown. This could potentially impact the Ivey PMI data in July. The impact of the US-China trade wars could be limited in scope for the moment.

The energy sector is also something that could impact the readings. The energy sector could also see a slowdown after a rebound earlier this year. With consumer debt rising, the spending could also decrease considerably.

On Friday last week, Markit released the data for Canada’s manufacturing PMI. The data showed that the manufacturing activity slightly picked up pace in July, rising to 52.6 from 49.2 in June.

But manufacturers signaled another decline in production during the reporting month. This came due to a substantial decrease in new orders. The uptick in business optimism offset the declines.

Meanwhile, business outlook and staffing levels picked up for the third month in a row.

Will Ivey PMI Beat Estimates?

The prospects for a beat on estimates are slim. However, looking at the ground conditions, it is possible to see an increase in the purchasing manager’s index from June’s lows.

The question remains whether this increase will be sustainable in the longer-term or not.

For the moment, the impact of the Ivey PMI will be seen in the upcoming economic indicators. This includes the Canadian jobs report due this Friday.

By Orbex


Markets portray semblance of calm, as investors remain skittish over US-China conflict

By Han Tan, Market Analyst, ForexTime

Following the selloff at the onset of the week, US equities rebounded while Asian equities saw a mixed start to the day. The Dollar index (DXY) couldn’t hang on to its recent two-year high around the 99 level, and the steep unwinding in DXY has prompted gains in most G10 and Asian currencies.

The PBOC’s daily reference rate on Wednesday, while just a hair below the psychologically-important 7 level, signals further attempts to stabilise the CNY and assure investors that weakness in the onshore Yuan is mitigated.

Has the US-China conflict reached a point of no return?

Risk appetite is expected to remain soft amid intensifying concerns over the global economic landscape that has already been weighed down by the protracted US-China trade impasse. Despite the next round of US-China trade talks slated for next month, the looming additional US tariffs on Chinese goods set for September 1, coupled with China’s pledged “necessary countermeasures”, have only caused investors’ shoulders to slump further. Market participants are growing increasingly fretful that the prospects of a US-China compromise are at risk of being snuffed out completely.

With tensions between the world’s two largest economies now officially extending beyond trade and tech into the currency arena, the bar has been significantly raised on the likelihood of a near-term trade deal. Investors will remain vigilant over any potential headlines pertaining to the US-China conflict, even as markets are still licking their wounds from the recent unexpected developments that only point to an intensifying deadlock between the economic giants.

Such concerns only serve to ensure that safe haven assets remain in vogue, with Gold having breached the psychologically-important $1480 level, while yields on 10-year US Treasuries have now dipped below 1.69 percent.

Dollar could see bouts of volatility in lead up to September FOMC meeting

Markets have been given a reinvigorated sense that the Federal Reserve will be forced to belie its less-than-dovish stance, given the growing economic headwinds stemming from the intensifying US-China tensions. The Fed Funds futures at present still point to three more Fed rate cuts in 2019, despite Fed officials insisting that policymakers are not embarking on a prolonged easing cycle.

With the ramp up in underlying demand for safe haven assets such as US Treasuries, that should create a relatively supportive environment for the Greenback. Still, the Dollar’s performance this month is expected to be heavily swayed by shifting market expectations over the Fed’s policy path, which could spark further bouts of volatility in DXY over the near term.

Brent dips into bear market

Concerns over the escalating US-China conflict have dragged Brent futures into a bear market, which is now trading around the $59/bbl mark at the time of writing. Any further deterioration in global economic conditions, dragged down by more trade barriers imposed either by the US or China, could cripple global demand for Oil. That is likely to fuel Oil’s bias for weakness, despite the best efforts by OPEC+ producers to put a floor underneath crude prices.


Disclaimer: The content in this article comprises personal opinions and should not be construed as containing personal and/or other investment advice and/or an offer of and/or solicitation for any transactions in financial instruments and/or a guarantee and/or prediction of future performance. ForexTime (FXTM), its affiliates, agents, directors, officers or employees do not guarantee the accuracy, validity, timeliness or completeness, of any information or data made available and assume no liability as to any loss arising from any investment based on the same.


Forex-Time-LogoArticle by ForexTime

ForexTime Ltd (FXTM) is an award winning international online forex broker regulated by CySEC 185/12 www.forextime.com

EURUSD: correction to the trend line

By Alpari.com

Previous:

On Tuesday the 6th of August, trading on the euro closed slightly down. The stock market, along with the US dollar, was propped up by the strengthening of the yuan, which dropped from 7.1399 to 7.0415 against the greenback. The correction on the EURUSD pair, coupled with an increased appetite for risk, dragged the euro down to 1.1168. The pair then recovered some of its losses to close at 1.1198.

Washington labelled China a currency manipulator after the USDCNY rate broke the 7.00 mark. PBOC Deputy Governor Chen Yulu condemned the move by the US, saying that China has never used its currency as a tool for competition and that the exchange rate is determined by market supply and demand.

Day’s news (GMT+3):

  • 10:30 UK: Halifax house prices (Jul).
  • 17:00 Canada: Ivey PMI (Jul).
  • 17:30 US: EIA crude oil stocks change (2 Aug).
  • 22:00 US: consumer credit change (Jun).

EURUSD H1Current situation:

Yesterday’s expectations were met. The pair bounced from the 67th degree to recover to 1.1206. In the Asian session, the euro rose further to 1.1220 on the back of a renewed retreat to safe haven assets following the yuan’s decline. Gold has hit fresh highs.

At the time of writing, the euro is trading at 1.1203. The pair is currently in decline on account of the Kiwi dollar’s collapse. The Reserve Bank of New Zealand lowered its key rate by 50 base points to 1.00%, while only a 25-base-point reduction was expected.

The pair has returned to the trend line. The balance line runs through 1.1190 (sma 55). Despite the Kiwi dollar’s decline, the US-China dispute continues to dominate the headlines. I’m going to risk predicting a recovery from the LB to 1.1236.

If the hourly candlestick closes below 1.1180, this prediction will no longer be valid. In this case, there will be an increased risk of a correction to 1.1145 (90 degrees). White House economic adviser Larry Kudlow has said that he expects another round of talks between the US and China to take place in September. Judging by Trump’s rhetoric, however, it seems unlikely that the two sides will reach a compromise and resume trade talks.

By Alpari.com

New Zealand Dollar nosedives as RBNZ shocks with bigger rate cut

By Lukman Otunuga, Research Analyst, ForexTime

The New Zealand Dollar weakened against every single G10 currency this morning after the Reserve Bank of New Zealand (RBNZ) shocked markets by cutting interest rates by 50 basis points – bringing the official cash rate to a record low of 1%.

According to the central bank, “Global economic activity continues to weaken, easing demand for New Zealand’s goods and services” while “Heightened uncertainty and declining international trade have contributed to lower trading-partner growth”.

With the RBNZ purchasing premium tickets on the global monetary easing bandwagon and signalling further cuts, the New Zealand Dollar is positioned to weaken further. This is already being reflected in the NZDUSD which tumbled a staggering 150+ pips to levels not seen since January 2016 below 0.6400.

The technical picture is extremely bearish on the daily charts with bears exerting pressure on the 0.6400 level as of writing. Sustained weakness below this level will signal further downside with the next key point of interest at 0.6350. Alternatively, if 0.6400 proves to be a reliable support, prices have the potential to rebound back towards 0.6850 before resuming the downtrend.

Disclaimer: The content in this article comprises personal opinions and should not be construed as containing personal and/or other investment advice and/or an offer of and/or solicitation for any transactions in financial instruments and/or a guarantee and/or prediction of future performance. ForexTime (FXTM), its affiliates, agents, directors, officers or employees do not guarantee the accuracy, validity, timeliness or completeness, of any information or data made available and assume no liability as to any loss arising from any investment based on the same.


Forex-Time-LogoArticle by ForexTime

ForexTime Ltd (FXTM) is an award winning international online forex broker regulated by CySEC 185/12 www.forextime.com

SP500 snaps six-session slide

By IFCMarkets

Dollar strengthens as Bullard says trade war can’t guide Fed policy

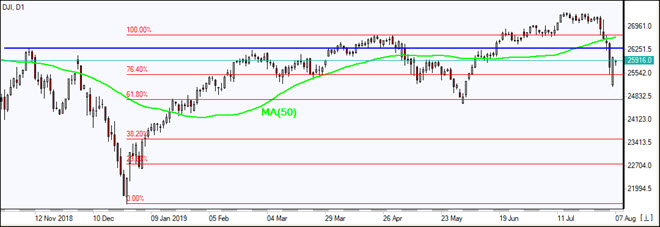
US stock indexes recovered on Tuesday as China’s central bank stabilized its currency with a fix Tuesday at 6.9683 yuan per dollar. The S&P 500 rebounded 1.3% to 2881.77. Dow Jones industrial advanced 1.2% to 26029.52. The Nasdaq rose 1.4% to 7833.27. The dollar strengthening resumed as St. Louis Federal Reserve President James Bullard said the Fed “can’t realistically move monetary policy in a tit-for-tat trade war”: the live dollar index data show the ICE US Dollar index, a measure of the dollar’s strength against a basket of six rival currencies, gained 0.2% to 97.58 but is higher currently. Stock index futures point to lower market openings today

DJI drops below MA(50)    08/07/2019 Market Overview IFC Markets chart

DAX 30 leads European indexes losses

European stocks retreat continued on Tuesday despite China’s move to stabilize yuan below 7 level. The EUR/USD declined while GBP/USD inched up yesterday and both pairs are moving in verse directions currently. The Stoxx Europe 600 ended 0.4% lower. The German DAX 30 dropped 0.8% to 11567.96 despite 2.5% increase in new industrial orders month-on-month in June, though they were still down by 3.6% on the year. France’s CAC 40 slipped 0.1%. UK’s FTSE 100 lost 0.7% to 7117.69.

Australia’s All Ordinaries Index rebounded while other Asian indexes retreat

Asian stock indices are mixed today as the People’s Bank of China set the daily fix for the yuan below 7 and a bit weaker than expected. Nikkei lost 0.3% to 20516.56 as yen climb against the dollar resumed. Chinese stocks are falling: the Shanghai Composite Index is down 0.1% and Hong Kong’s Hang Seng index is 0.2% lower. Australia’s All Ordinaries Index rebounded 0.6% as Australian dollar’s slide against the greenback accelerated.

Brent steady

Brent futures prices are steady today. The American Petroleum Institute late Tuesday report indicated US crude inventories fell by 3.4 million barrels last week. Prices however fell yesterday: October Brent lost 1.4% to $58.94 a barrel on Tuesday. Today at 16:30 CET the Energy Information Administration will release US Crude Oil Inventories.

Market Analysis provided by IFCMarkets

Note:
This overview has an informative and tutorial character and is published for free. All the data, included in the overview, are received from public sources, recognized as more or less reliable. Moreover, there is no guarantee that the indicated information is full and precise. Overviews are not updated. The whole information in each overview, including opinion, indicators, charts and anything else, is provided only for familiarization purposes and is not financial advice or а recommendation. The whole text and its any part, as well as the charts cannot be considered as an offer to make a deal with any asset. IFC Markets and its employees under any circumstances are not liable for any action taken by someone else during or after reading the overview.

The Sound Money Showdown in U.S. States

By Money Metals News Service

Policies relating to sound money have been the subject of substantial debate at the state level this year, with bills, hearings, and/or votes taking place in nearly a dozen legislatures.

As most state legislatures have now wrapped up their work for the year, let’s review the victories (both offensive and defensive)—and lone defeat—for sound money during the 2019 session.

The Sound Money Defense League’s primary goal is to remove every kind of taxation imposed on constitutional money. Given its practical importance, the hottest issue in the states has been taxation—i.e. whether citizens should face a levy when buying or selling gold and silver.

  • House Bill 2684, introduced by West Virginia Delegate Pat McGeehan, aimed to remove all taxes (sales tax, corporate income tax, and personal income tax) from gold and silver. Meanwhile, Senate Bill 502, sponsored by Senator Craig Blair, exempted only precious metals from the state’s sales tax.

The West Virginia bill removing sales taxes passed overwhelmingly through both chambers, and Governor Jim Justice signed SB 502 into law.

  • House Bill 2140, introduced by Kansas Representative Jim Kelly, included a sales tax exemption on the sale of gold and silver as part of a larger bill rife with new taxes. Governor Laura Kelly signed the measure in May.
  • Since 2014, Nebraska has recognized gold and silver as money and waives sales taxes on the metals. However, a few tax-revenue-hungry politicians tried to sneak a new sales tax on the metals into a larger bill earlier this year. After sound money advocates and in-state supporters mobilized to persuade Nebraska legislators that taxing money is wrong, the cynical new tax was removed from the bill.
  • Washington State has not collected sales taxes on sound money for more than three decades. This year, however, we faced two serious attacks on gold and silver in Olympia.

Jp Cortez, policy director of the Sound Money Defense League, joined Dan Duncan and other in-state dealers and policy experts to warn legislators of the grave policy error they were considering—a blunder that would drive coin conventions and investment dollars to neighboring states.

After overwhelming backlash from in-state coin dealers, grassroots supporters, and the Sound Money Defense League, both Washington repeal bills died in committee.

  • The battle to preserve an existing sales tax exemption did not succeed in Ohio. Under the dark cloud left by a rare-coin scammer who stole tens of millions of dollars from Buckeye State taxpayer a decade ago, the legislature ignored the pleas of hundreds of taxpayers, business owners, and collectors and revoked the sales-tax exemption for gold and silver.

We’re disappointed in this setback at the hands of tax-hungry politicians. Any tax-revenue proceeds Ohio gains will almost certainly be offset by lost revenues when business and coin conventions flee the state. The Sound Money Defense League hopes to persuade Ohio’s legislature to rectify this policy error in the future.

  • Wisconsin is still considering Assembly Bill 200, introduced by Representative Shae Sortwell. This bill aims to remove sales taxes from gold and silver and should be heard in the fall.
  • Several other states, including Arkansas, Maine, Minnesota, and Tennessee, actively considered measures to remove sales taxes on sound money—with formal hearings occurring in all but Minnesota. Although these efforts came up short this year, a foundation of support has been established for renewed efforts next year.

In total, 39 states now have full or partial exemptions from sales taxes on the monetary metals.

  • Sound money allies in Wyoming introduced three bills to enable the state treasurer to invest state funds in physical gold and silver held securely in or near the state.

These measures ignited a discussion as to whether the state treasurer already has the authority to protect state funds by holding gold—and it put a spotlight on Wyoming’s staggering losses on its investments in Third-World debt (hundreds of millions of dollars lost) while having now ownership in even a single ounce of gold.

While these Wyoming bills did not pass, the Wyoming state treasurer is reportedly exploring how best to incorporate gold into the state’s portfolio to protect its reserves.

  • An ally in Arizona introduced a similar bill to Wyoming’s, but the sunbelt state does not currently have reserve funds which can be allocated to the monetary metals – the state’s modest reserves have been pledged as collateral for bank loans on government buildings!

Sound money is no longer a fringe concept relegated to whispers in dark corners. The Federal Reserve has failed as a steward of the dollar since its creation. Individuals, state legislatures, and even other countries are waking up to the value and importance of sound money.

Grasping the importance of sound money and seeing success at the state level, our allies are expected to introduce additional sound money measures next session.  Building on the success of 2019, all eyes are on 2020 as sound money continues to gain acceptance once again.

————————————

Were it not for the generosity of concerned Americans, the Sound Money Defense League could not fight on the front lines for tax-free sound money. However, we can’t continue our mission of restoring gold and silver as America’s constitutional money without your help.

Can you please donate $100, $50, or $25 to help continue our fight against tax-hungry politicians that want to tax your money? Your donation makes a huge difference for our organization. Please click here to make a contribution.


The Money Metals News Service provides market news and crisp commentary for investors following the precious metals markets.

Keep Your Wealth from Falling into the Negative Interest Rate Vortex

By Money Metals News Service

The world is in the midst of one of the strangest asset bubbles of all time. Instead of being fueled by the hope of bigger and bigger gains, it is being driven by a resignation to incurring lower and lower… and ultimately negative, yields on capital.

This summer, the global inventory of bonds yielding less than zero reached a record $13 trillion.

Falling Interest Rates

Negative yielding instruments are concentrated mainly in Europe and Japan, where they have spread from sovereign to corporate issuances. Now even some “junk”-rated bonds are teetering around 0%.

While negative nominal interest rates have yet to make their way to the United States, the Federal Reserve has toyed with the idea of cutting rates below zero in the event of a severe economic downturn.

At their August 2016 Jackson Hole gathering, Fed officials heard economist Marvin Goodfriend make the case for negative rates. “It is only a matter of time before another cyclical downturn calls for aggressive negative nominal interest rate policy,” he said.

The U.S. economy, now into its longest official expansion since Fed came into existence, is overdue for a recession. When one does hit, Goodfriend suggests the Federal funds rate could be dropped to as low as negative 2%.

Treasury Holders Face Very Real Prospect of Negative Real Returns

In the meantime, negative real interest rates are an extant and growing problem confronting American investors.

Lose

Yields on Treasuries with maturities as long as 10 years have recently been pushed below the Fed’s target inflation rate of 2%.

Any slight pickup in inflation could put the entire Treasury yield curve into negative real territory.

To illustrate, a bond with a positive 2% yield denominated in a currency that is depreciating at a 3% annual rate produces a negative (-1%) real yield. It’s no better than a bond sporting an actual -1% yield in an environment of 0% inflation.

According to a recent analysis by conducted by Bloomberg, $25 trillion in bonds worldwide sport negative real yields.

That will likely hit $30 trillion (more than half of all bonds) if the Fed cuts rates twice this year – even higher if the central bank cuts three times as many Fed observers, including White House economist Larry Kudlow, expect.

Neither governments nor banks advertise the real, after-inflation rates on the debt instruments they offer. If they did, millions of savers would see quite clearly that the interest they’re being paid is a losing proposition.

Of course, inflation data can be manipulated in various ways to suppress the extent of actual price level increases people experience in the economy. That’s one reason why so-called “inflation-adjusted” bonds should be viewed with skepticism.

Fortunately for investors, certain asset classes tend to thrive in an environment of negative real interest rates. Among the standouts are precious metals.

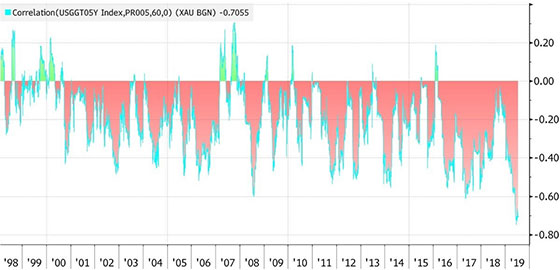
When real interest rates on paper are negative, gold becomes attractive to hold as an alternative – and tends to perform well. This is proven out in the following chart, which uses the yield on five-year inflation-linked Treasuries as a proxy for investor expectations of real interest rates.

Gold Shows an Inverse Correlation to the Real Interest Rate Outlook

Bloomberg Correlation Chart

A common knock against gold is that it doesn’t generate interest or dividends like financial assets. While trivially true, it’s irrelevant because gold is ultimately a form of money that can gain value versus shakier financial assets regardless of their nominal yield.

Only when you can get a comfortable (and secure) after-inflation yield from a bond should it be viewed as having a meaningful advantage over gold.

In today’s unprecedented $13 trillion negative interest rate environment, gold’s 0% yield has never been more attractive by comparison! Gold has a higher yield than $13 trillion in bonds in existence so far. Precious metals certainly have greater appreciation potential than bonds denominated in euros, yen, dollars, or any other fiat currency.

In Bond Markets, Greater Fool Theory Prevails… For Now

That so many investors around the world are apparently content to let their wealth get sucked into a negative-yield vortex is, frankly, baffling.

The proliferation of negative-yielding securities has befuddled economists of all stripes. It seems to violate a basic principle of economics – that debtors must pay creditors some level of interest to compensate them for putting their money at risk and giving up immediate access to it.

The “greater fool” mentality might best explain the peculiar phenomenon of lenders becoming willing to pay interest to borrowers via bonds.

It has pushed other asset bubbles throughout history to irrational and previously unthinkable heights.

Holders of negative yielding bonds apparently believe that future bond buyers will get suckered into accepting even lower yields. But, at some point, there will be no greater fools left to sell to.

When the global bond bubble bursts, proud owners of negative-yielding paper will start suffering unanticipated capital losses as bond values get marked down. Perhaps then, they will come to their senses and seek more prudent places in which to hold wealth – such as precious metals.


The Money Metals News Service provides market news and crisp commentary for investors following the precious metals markets.

Will The RBNZ Cut Rates?

By Orbex

The RBNZ was one of the first to cut rates in the current cycle. However, now that the RBA has done so twice in a row, they seem to be a bit behind the curve. Compounding the pressure is the Fed’s rate cut last week which shrunk the yield divide.

It’s been quite some time now since markets have been pricing in a rate cut for August. So it would be quite a surprise if it didn’t happen!

Where we could get some market volatility, though, is from the accompanying monetary policy statement.

What to Look For

As if to confirm that there will be a rate cut this time around, there is a press conference for the Governor an hour after the rate decision. This is likely when we will get the key comment that will allow the market to price in expectations for what the bank will do in the future and what that means for the Kiwi.

One of the factors to look at is whether there was a split in the votes. So far, all the decisions made by the new committee have been unanimous. It will help us get some understanding of future decisions if we see who is likely to or is willing to dissent.

A split vote could move the markets as well, although this time around the chance of that seem remote given the how broad the consensus of a rate cut is.

The Path Forward

Many analysts are going so far as to consider it likely that there will be two rate cuts by the end of the year – which would keep pace with Australia. This is in line with the guidance that the bank reiterated last time. How strong the bank is on affirming this potential (or if they move the timeline up) would be one of the factors that could move the currency.

Lately, the NZD has been one of the stronger performers, which has been largely attributed to the central bank’s position more than any fundamental economic factors. Several analysts are pricing in weakness in the kiwi going forward. The expectation is that the reference rate will be cut along with the race to the bottom by other central banks.

The Situation

A cut would once again take the reference rate to a record low. It would also be an unusual situation for the RBNZ which has traditionally kept interest rates relatively high and avoided intervention.

Incidentally, the market has a habit of wishful thinking, pricing in more rate cuts than there actually will be.

Let’s not forget that even though the inflation rate isn’t up to the target level, it did tick up a decimal on an annualized basis during the last quarter. That actually is above last year’s average, when the consensus was that the RBNZ’s next move would be a hike.

Projections Are Not Facts

A review of the justifications given by analysts for further rate cuts in New Zealand seems to be based on business sentiment, and expectations of lack of growth. However, those are not major concerns for the central bank, which, in the last statement, specified that they cared about employment and price stability.

The trend on employment appears to continue as relatively positive, with the unemployment rate at the structural level. Inflation is off, but not by a lot.

While the bank might have a vested interest in jawboning the market to support growth, that doesn’t mean they are willing to embark on an extended rate-cutting program in what is otherwise a stable economy.

By Orbex