Shares of WPX Energy are trading higher after it released second quarter earnings and raised full-year oil guidance by 4%. The firm also announced it is initiating a 24-month, $400 million share repurchase program.
After the close of trading yesterday, WPX Energy Inc. (WPX:NYSE) reported unaudited second quarter earnings for the period ending June 30, 2019. The company registered total product revenues of $558 million in Q2/19, a 7% increase over Q2/18, with the quarterly oil sales component growing by 9% in the same period. Total product revenues were $1,065 million in H2/19, up 15% over the $927 million recorded in H2/18.
Total production in Q2/19 averaged 159.6 MBoe/day, which was 28% higher than a year ago, with oil and natural gas liquids volumes comprising 79% of total volumes. Oil sales of $511 million from 97.9 Mbbl/d accounted for 92% of Q2/19 product revenues.
Cash flow from operations in H2/19, inclusive of hedge impact, increased 48% over H2/18 to $634 million. The H2/19 results included $362 million realized in Q2/19.
The report indicated income available to common stockholders of $305 million, or income of $0.72 per share on a diluted basis in Q2/19. The firm advised that the results include a $247 million recorded gain related to WPX’s equity interest in the sale of the Oryx II pipeline project, and excluding the Oryx gain and other items, such as derivatives, WPX posted adjusted net income of $0.09 per share.
Additionally, WPX announced that its board of directors has authorized a plan for the company to repurchase up to $400 million of shares over the next 24 months. WPX’s Chairman and CEO Rick Muncrief commented, “This accelerates our original plan to return capital to shareholders in 2021…and the current market sentiment has created favorable circumstances for an action like this, and if the market remains irrational, we will be opportunistic. . .We expect to generate $100 million to $150 million in free cash flow in the back half of this year, which will help support our repurchase program.”
The company revised its 2019 full-year total production estimates to 160165 Mboe/d in 2019, up from prior estimates of 149161 Mboe/d, and now expects to produce 101103 Mbbl/d of oil for full-year 2019, up from prior estimates of 96100 Mbbl/d. The firm indicated that Q3/19 oil volumes are driving the upward revision.
WPX Energy is an independent oil and natural gas exploration and production company that focuses on exploiting, developing and growing its oil positions in the Delaware (Permian area sub-basin) and San Juan basins in Texas and New Mexico and in the Williston Basin in North Dakota. The firm states that it is engaged in the exploitation and development of long-life unconventional properties. In the company’s 2018 10-K report filed with the SEC the firm lists that its portfolio of proven oil and natural gas reserves as of December 31, 2018, was 479 MMboe reflecting a mix of 61% crude oil, 21% natural gas and 18% NGLs. The company operates 657 wells in the Delaware basin and also owns interests in 808 wells operated by others, and holds approximately 130,000 net acres there. Additionally, the firm operates 323 wells in the Williston Basin and also owns interest in 87 wells operated by others, and holds 85,087 net acres in the Williston Basin.
WPX shares opened up nearly 18% higher today at $10.53 (+$1.60, +17.92%) compared to yesterday’s close of $8.93. Shares have traded between $9.38-10.65 on greater than average volume. Currently shares are trading at $9.78 (+$0.85, +9.52%).
Disclosure: 1) Stephen Hytha compiled this article for Streetwise Reports LLC and provides services to Streetwise Reports as an independent contractor. He or members of his household own securities of the following companies mentioned in the article: None. He or members of his household are paid by the following companies mentioned in this article: None. 2) The following companies mentioned in this article are billboard sponsors of Streetwise Reports: None. Click here for important disclosures about sponsor fees. 3) Comments and opinions expressed are those of the specific experts and not of Streetwise Reports or its officers. The information provided above is for informational purposes only and is not a recommendation to buy or sell any security. 4) The article does not constitute investment advice. Each reader is encouraged to consult with his or her individual financial professional and any action a reader takes as a result of information presented here is his or her own responsibility. By opening this page, each reader accepts and agrees to Streetwise Reports’ terms of use and full legal disclaimer. This article is not a solicitation for investment. Streetwise Reports does not render general or specific investment advice and the information on Streetwise Reports should not be considered a recommendation to buy or sell any security. Streetwise Reports does not endorse or recommend the business, products, services or securities of any company mentioned on Streetwise Reports. 5) From time to time, Streetwise Reports LLC and its directors, officers, employees or members of their families, as well as persons interviewed for articles and interviews on the site, may have a long or short position in securities mentioned. Directors, officers, employees or members of their immediate families are prohibited from making purchases and/or sales of those securities in the open market or otherwise from the time of the interview or the decision to write an article until three business days after the publication of the interview or article. The foregoing prohibition does not apply to articles that in substance only restate previously published company releases.
India’s central bank cut its policy repo rate for the fourth time this year and retained its accommodative monetary policy stance in response to slowing economic growth and continued downside risks from “the global slowdown and escalating trade tensions.”
The Reserve Bank of India (RBI) cut its repo rate by a further 35 basis points to 5.40 percent and has now cut the rate by a total of 110 points this year following cuts in June, April and February.
The RBI, which was expected to lower its rate between 25 and 50 basis points, signaled it would be ready to lower rates further to boost economic growth as the inflation outlook remains benign.
“Addressing growth concerns by boosting aggregate demand, especially private investment, assumes the highest priority at this juncture while remaining consistent with the inflation mandate,” RBI said, adding private consumption and investment activity remain “sluggish.”
Reflecting a contraction of merchandise exports in June and a moderation in industrial production, RBI lowered its forecast for economic growth in the 2019-20 financial year, which began April 1, to 6.9 percent from a previous forecast of 7.0 percent, with risks somewhat to the downside.
India’s gross domestic product has slowed in the last three quarters, with annual growth in the first quarter of this year of 5.8 percent, down from 6.6 percent in the fourth quarter of last year and 7.0 percent in the third quarter of 2018.
For the first quarter of the 2020-21 year, – or the second calendar quarter of 2020 – RBI forecast growth of 7.4 percent.
Low inflation is allowing the RBI to ease its monetary policy stance in an attempt to boost inflation to its target of 4.0 percent, plus/minus 2 percentage points.
In June retail inflation rose to 3.18 percent from 3.05 percent in May but excluding food and fuel inflation was unchanged in June after falling to 4.1 percent in May from 4.6 percent in April.
RBI’s inflation forecast was largely unchanged from June, with headline inflation seen at 3.5-3.7 percent in the second half of the 2019-20 year compared with the previous forecast of 3.4-3.7 percent.
As in June, RBI’s monetary policy committee was unanimous in its policy decision.
The Reserve Bank of India released the following third bi-monthly monetary policy statement 2019-20 by its Monetary Policy Committee:
“On the basis of an assessment of the current and evolving macroeconomic situation, the Monetary Policy Committee (MPC) at its meeting today decided to:
reduce the policy repo rate under the liquidity adjustment facility (LAF) by 35 basis points (bps) from 5.75 per cent to 5.40 per cent with immediate effect.
Consequently, the reverse repo rate under the LAF stands revised to 5.15 per cent, and the marginal standing facility (MSF) rate and the Bank Rate to 5.65 per cent.
The MPC also decided to maintain the accommodative stance of monetary policy.
These decisions are in consonance with the objective of achieving the medium-term target for consumer price index (CPI) inflation of 4 per cent within a band of +/- 2 per cent, while supporting growth.
The main considerations underlying the decision are set out in the statement below.
Assessment
Global Economy
2. Global economic activity has slowed down since the meeting of the MPC in June 2019, amidst elevated trade tensions and geo-political uncertainty. Among advanced economies (AEs), GDP growth in the US decelerated in Q2:2019 on weak business fixed investment. In the Euro area too, GDP growth moderated in Q2 on worsening external conditions. Economic activity in the UK was subdued in Q2 with waning consumer confidence on account of Brexit related uncertainty and weak industrial production. In Japan, available data on industrial production and consumer confidence suggest that growth is likely to be muted in Q2.
3. Economic activity remained weak in major emerging market economies (EMEs), pulled down mainly by slowing external demand. The Chinese economy decelerated to a multi-year low in Q2, while in Russia subdued economic activity in Q1 continued into Q2 on slowing exports and retail sales. In Brazil, the economy is struggling to gain momentum after contracting in Q1 on weak service sector activity and declining industrial production. Economic activity in South Africa appears to be losing pace in Q2 as the manufacturing purchasing managers’ index (PMI) contracted for the sixth month in succession in June and business confidence remained weak.
4. Crude oil prices fell sharply in mid-May on excess supplies from an increase in non-OPEC production, combined with a further weakening of demand. Consequently, extension of OPEC production cuts in early July did not have much impact on prices. Gold prices have risen sharply since the last week of May, propelled by increased safe haven demand amidst rising downside risks to growth and a worsening geo-political situation. Inflation remained benign in major advanced and emerging market economies.
5. Financial markets were driven by the monetary policy stances of major central banks and intensifying geo-political tensions. In the US, the equity market recovered most of the losses suffered in May, boosted by dovish guidance by the US Fed and some transient respite in trade tensions with China. EM stocks lagged behind their developed market counterparts, mainly reflecting the weak performance of Chinese and South Korean stocks. Bond yields in the US, which were already trading with a softening bias on increased probability of policy rate cuts, fell markedly in early August on escalation of trade tensions. Bond yields in some more member countries in the Euro area moved into negative territory as expectations of more accommodative monetary policy by the European Central Bank gained traction. In EMEs, bond yields edged lower on more accommodative guidance by systemic central banks. In currency markets, the US dollar weakened against major currencies in June on dovish guidance by the US Fed but appreciated in July. EME currencies, which traded with an appreciating bias in July, depreciated in early August on escalation of trade tensions.
Domestic Economy
6. On the domestic front, the south-west monsoon gained intensity and spread with the cumulative rainfall 6 per cent below the long-period average (LPA) up to August 6, 2019. In terms of its spatial distribution, 25 of the 36 sub-divisions received normal or excess rainfall as against 28 sub-divisions last year. The total area sown under kharif crops was 6.6 per cent lower as on August 2 than a year ago. The live storage in major reservoirs on August 1 was at 33 per cent of the full reservoir level as compared with 45 per cent a year ago. Rainfall during the second half of the season (August-September) has been forecast to be normal by the India Meteorological Department (IMD).
7. Industrial growth, measured by the index of industrial production (IIP), moderated in May 2019, pulled down by manufacturing and mining even as electricity generation picked up on strong demand. In terms of the use-based classification, the production of capital goods and consumer durables decelerated. However, consumer non-durables accelerated for the third consecutive month in May. The growth in the index of eight core industries decelerated in June, dragged down by a contraction in petroleum refinery products, crude oil, natural gas and cement. Capacity utilisation (CU) in the manufacturing sector, measured by the order books, inventory and capacity utilisation survey (OBICUS) of the Reserve Bank rose marginally to 76.1 per cent in Q4:2018-19 from 75.9 per cent in Q3; seasonally adjusted CU, however, fell to 74.5 per cent in Q4 from 75.6 per cent in Q3. The Reserve Bank’s business assessment index (BAI) for Q1:2019-20 improved marginally, supported by a modest recovery in profit margins of the surveyed firms even as production and order books slowed. The manufacturing PMI rose to 52.5 in July from 52.1 in June, underpinned by a pick-up in production, higher new orders and optimism on demand conditions in the year ahead.
8. High frequency indicators of services sector activity for May-June present a mixed picture. Tractor and motorcycle sales – indicators of rural demand – continued to contract. Amongst indicators of urban demand, passenger vehicle sales contracted for the eighth consecutive month in June; however, domestic air passenger traffic growth turned positive in June after three consecutive months of contraction. Commercial vehicle sales slowed down even after adjusting for base effects. Construction activity indicators slackened, with contraction in cement production and slower growth in finished steel consumption in June. Import of capital goods – a key indicator of investment activity – contracted in June. The services PMI expanded to 53.8 in July from 49.6 in June on increase in new business activity, new export orders and employment.
9. Retail inflation, measured by y-o-y change in the CPI, edged up to 3.2 per cent in June from 3.0 per cent in April-May, driven by food inflation, even as fuel inflation and CPI inflation excluding food and fuel moderated.
10. Inflation in the food group rose to 2.4 per cent in June from 2.0 per cent in May and 1.4 per cent in April, caused by a sharp pick up in prices of meat and fish, pulses and vegetables. Inflation also edged up in cereals, milk, spices and prepared meals. However, inflation in eggs and non-alcoholic beverages softened. Prices of fruits, and sugar and confectionery remained in deflation in June.
11. Inflation in the fuel and light group moderated in June, with electricity moving into deflation. Fuels such as firewood and chips, and dung cake have been in deflation from April. Inflation in liquified petroleum gas (LPG) and subsidised kerosene prices, however, remained elevated.
12. CPI inflation excluding food and fuel fell by 50 basis points to 4.1 per cent in May from 4.6 per cent in April, and remained unchanged in June. The softness in inflation in this category was broad-based across clothing and footwear; household goods and services; transport and communication; and recreation and amusement. Housing inflation remained unchanged over the last three months. Despite some moderation, inflation in the health sub-group remained elevated. Inflation in personal care and effects edged up in June due to a resurgence in gold prices.
13. Inflation expectations of households remained unchanged in the July 2019 round of the Reserve Bank’s survey for the three months ahead horizon as compared with the previous round, but they moderated by 20 basis points for the one year ahead horizon. Input cost pressures from prices of agricultural and industrial raw materials continued to ease in May and June. Nominal growth in rural wages was muted, while growth in staff costs in the manufacturing sector eased in Q1. Manufacturing firms participating in the Reserve Bank’s industrial outlook survey expect input cost pressures to soften on account of lower raw material costs in Q2.
14. Liquidity in the system was in large surplus in June-July 2019 due to (i) return of currency to the banking system; (ii) drawdown of excess cash reserve ratio (CRR) balances by banks; (iii) open market operation (OMO) purchase auctions; and (iv) the Reserve Bank’s foreign exchange market operations. The Reserve Bank absorbed liquidity of ₹ 51,710 crore in June, ₹ 1,30,931 crore in July and ₹ 2,04,921 crore in August (up to August 6, 2019) on a daily net average basis under the LAF. Two OMO purchase auctions amounting to ₹ 27,500 crore were conducted in June, thereby injecting durable liquidity into the system. The weighted average call money rate (WACR) – the operating target of monetary policy – was aligned with the policy repo rate in June, but it traded below the policy repo rate on a daily average basis by 14 bps in July and 17 bps in August (up to August 6, 2019).
15. The transmission of policy repo rate cuts to the weighted average lending rates (WALRs) on fresh rupee loans of banks has improved marginally since the last meeting of the MPC. Overall, banks reduced their WALR on fresh rupee loans by 29 bps during the current easing phase so far (February-June 2019).
16. Merchandise exports contracted in June 2019, weighed down by the subdued performance of gems and jewellery, petroleum products, rice, engineering goods and cotton. After a modest increase in May, imports also contracted in June, impacted by falling prices of petroleum products and reduced imports of pearls and precious stones, transport equipment, machinery, metalliferous ores, chemicals and fertilisers. As the fall in imports was larger than that of exports, the trade deficit declined modestly during May-June on a y-o-y basis. Provisional data suggest a sequential decline in net services exports in May 2019. On the financing side, net foreign direct investment flows moderated to US$ 6.8 billion in April-May 2019 from US$ 7.9 billion a year ago. Net foreign portfolio investment (FPI) flows in the domestic capital market amounted to US$ 2.3 billion during the current financial year so far (up to August 5, 2019) as against net outflows of US$ 8.5 billion in the same period last year. India’s foreign exchange reserves were at US$ 429.0 billion on August 2, 2019 – an increase of US$ 16.1 billion over end-March 2019.
Outlook
17. In the second bi-monthly monetary policy resolution of June 2019, CPI inflation was projected at 3.0-3.1 per cent for H1:2019-20 and 3.4-3.7 per cent for H2:2019-20, with risks broadly balanced. The actual headline inflation outcome for Q1:2019-20 at 3.1 per cent was in alignment with these projections.
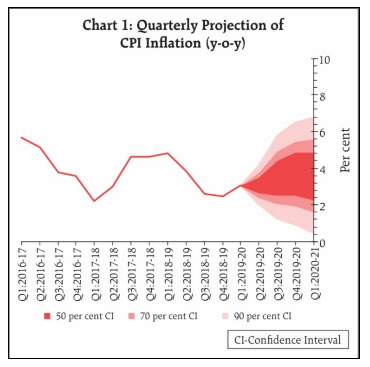
18. The baseline inflation trajectory for the next four quarters will be shaped by several factors. First, the uptick in food inflation may be sustained by price pressures in vegetables and pulses as more recent data suggest. Uneven spatial and temporal distribution of monsoon could exert some upward pressure on food items, though this risk is likely to be mitigated by the recent catch up in rainfall. Second, despite excess supply conditions, crude oil prices may likely remain volatile due to geo-political tensions in the Middle-East. Third, the outlook for CPI inflation excluding food and fuel remains soft. Manufacturing firms participating in the industrial outlook survey expect output prices to ease in Q2. Fourth, one year ahead inflation expectations of households polled by the Reserve Bank have moderated. Taking into consideration these factors and the impact of recent policy rate cuts, the path of CPI inflation is projected at 3.1 per cent for Q2:2019-20 and 3.5-3.7 per cent for H2:2019-20, with risks evenly balanced. CPI inflation for Q1:2020-21 is projected at 3.6 per cent (Chart 1).
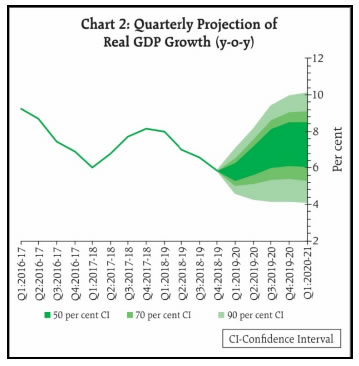
19. In the MPC’s June resolution,realGDP growth for 2019-20 was projected at 7.0 per cent – in the range of 6.4-6.7 per cent for H1:2019-20 and 7.2-7.5 per cent for H2 – with risks evenly balanced. Various high frequency indicators suggest weakening of both domestic and external demand conditions. The Business Expectations Index of the Reserve Bank’s industrial outlook survey shows muted expansion in demand conditions in Q2, although a decline in input costs augurs well for growth. The impact of monetary policy easing since February 2019 is also expected to support economic activity, going forward. Moreover, base effects will turn favourable in H2:2019-20. Taking into consideration the above factors, real GDP growth for 2019-20 is revised downwards from 7.0 per cent in the June policy to 6.9 per cent – in the range of 5.8-6.6 per cent for H1:2019-20 and 7.3-7.5 per cent for H2 – with risks somewhat tilted to the downside; GDP growth for Q1:2020-21 is projected at 7.4 per cent (Chart 2).
20. The MPC notes that inflation is currently projected to remain within the target over a 12-month ahead horizon. Since the last policy, domestic economic activity continues to be weak, with the global slowdown and escalating trade tensions posing downside risks. Private consumption, the mainstay of aggregate demand, and investment activity remain sluggish. Even as past rate cuts are being gradually transmitted to the real economy, the benign inflation outlook provides headroom for policy action to close the negative output gap. Addressing growth concerns by boosting aggregate demand, especially private investment, assumes the highest priority at this juncture while remaining consistent with the inflation mandate.
21. All members of the MPC unanimously voted to reduce the policy repo rate and to maintain the accommodative stance of monetary policy.
Four members (Dr. Ravindra H. Dholakia, Dr. Michael Debabrata Patra, Shri Bibhu Prasad Kanungo and Shri Shaktikanta Das) voted to reduce the policy repo rate by 35 basis points, while two members (Dr. Chetan Ghate and Dr. Pami Dua) voted to reduce the policy repo rate by 25 basis points.
22. The minutes of the MPC’s meeting will be published by August 21, 2019.
23. The next meeting of the MPC is scheduled during October 1, 3 and 4, 2019.”
Hitting bonanza grades during a gold bull means good things for investors.
GoldStockBull subscribers know that gold mining stocks have done quite well in recent months. But companies that have recently found bonanza-grade gold have upside potential above and beyond that of their peers.
2019 is proving to be a great year for gold. As COMEX Gold consolidates above $1,400 and now even $1,450, it’s clear that the six-year bear market has come to an end.
In fact, when measured against some fiat currencies, including the Australian dollar (AUD), gold has even reached all-time record highs!
What about gold mining stocks that offer significant leverage at times like these?
In this article, we look at two gold mining companies that have recently discovered “bonanza-grade gold intercepts.” What does that mean?
Bonanza Grade Gold Definition
As an investor, it’s crucial to keep an eye out for the latest news about the companies you hold shares in. Most trading platforms make this easy by showing links to the latest press releases put out by companies in your portfolio.
But there’s a problem. The press releases of mining companies often contain industrial jargon that investors may not understand. One example is the term “bonanza-grade gold.”
Grade refers to the extent of mineralization of a deposit of metal ore. The higher the grade, the more gold there is inside a smaller space of rock.
Miners want large deposits of higher-grade ore because it makes their operations more efficient. Higher-grade deposits yield more gold while requiring less work. Discovering a deposit of bonanza-grade gold is rare and bodes well for the future of a junior miner.
The World Gold Council defines a high-quality underground mine as having a gold ore density between 8 and 10 g/t (grams per ton), while a low-quality underground mine has a gold ore density of 1 to 4 g/t. Some view bonanza-grade as more than 34 grams of gold per tonne or more than one troy ounce of gold per ton.
Put another way. . .it means big profits if it is discovered in large quantities. And those profits will be passed on to shareholders as the gold explorers move the project into production.
For a good overview and description of this and other mining-related terms not covered here, see this excellent article on Investingnews.com.
Pure Gold is a Canadian company that is “100% focused on the goal of developing Canada’s next gold mine in the Red Lake district of northern Ontario.” The Red Lake district is one of the premier gold-producing areas of Canada, with over 29 million ounces of gold being mined there to date.
The PGM team published a preliminary economic assessment in February that outlined profitable prospects for the Madsen Red Lake Gold Project. And that study assumed a gold price of 1,275 USD per ounce!
From the press release: “This first round of results continues to demonstrate the continuity of our geological model and has reinforced the high-grade nature of both the Wedge deposit and the broader Madsen gold system as a whole,” stated Darin Labrenz, President and CEO of Pure Gold.
Labrenz goes on to say how this discovery has been established as part of a related system that is five kilometers in length.
To that end, the release also states this: “The resources at Wedge form a part of a series of genetically and geometrically related high-grade gold zones that span a five-kilometer structural corridor from Madsen to Wedge, with expansive gaps along strike and down plunge that remain highly prospective for additional resource growth.”
To clarify, this means that there are empty caverns inside the drilling locations, some of them being horizontal (along the strike) and some of them being vertical (down-plunge). It’s not currently known whether or not these empty spaces also contain bonanza-grade gold, but that is a firm possibility.
Westhaven Discovers Bonanza Grade Gold
Westhaven Ventures holds the single largest claim of land on the Spences Bridge Gold Belt (SBGB) in Vancouver, British Columbia. The SBGB is underexplored and in close proximity to existing infrastructure, meaning exploration costs are low and potential mining rewards are high. The company has three big projectsProspect Valley, Shovelnose, and Skoonka Creek.
The most notable takeaway from their recent press release is this: “Hole SN19-11 returned 2.98m of 176.33 g/t Au and 131.43 g/t Ag, including 1.00m of 521 g/t Au and 381 g/t Ag in Vein Zone 1.”
Translation: In this drill of about three meters, one-third of it was bonanza-grade gold and silver, with concentrations over 50x and 30x what miners consider high grade,respectively.
Other strikes included high-grade and bonanza-grade intercepts at depths of anywhere from 17 to 52 meters. All of these occurred in Vein 2, in the South Zone of the Shovelnose operation, which the company plans on expanding in light of these findings.
These Recent Finds Equal Big Investment Potential
Both of these companies increased their odds of moving their respective projects into production as a result of discovering these unusually high-grade deposits. It also suggests that they selected prime locations for their operations, where additional bonanzas may be waiting to be found. And eventually, it means their economic studies will return more favorable numbers and their profit margins will be higher than previously expected.
Combine all of that with the price of gold breaking out against all fiat currencies in 2019, and it’s hard to see a scenario where these miners don’t do exceptionally well.
At Gold Stock Bull, we focus on identifying undervalued junior gold miners with high-grade projects that have yet to be fully appreciated by the wider market. The GSB portfolio has posted very strong gains in 2019 and we believe the best is yet to come.
We just added a new junior gold company to our watch list that hit bonanza-grade gold recently and has attracted investment capital from some of the brightest names in the industry. This company has a market cap of around $100 million, but the share price has huge upside as gold moves to $1,500 and higher. We think this could be a five-bagger for those that buy early!
Subscribe to the GSB investment newsletter today to receive in-depth market insights, technical and fundamental analysis, and real-time trade alerts from Jason Hamlin. We believe the subscription will pay for itself many times over within the first year.
Brian Nibley is a freelance writer based out of California. He specializes in topics relating to cryptocurrency and blockchain technology, finance, and marketing. Visit his portfolio at bdncontent.com, his blog at Bnibley.blogspot.com, and connect on LinkedIn at linkedin.com/in/bdncontent.
Disclaimer: Gold Stock Bull holds the companies mentioned in the GSB model portfolio/watch list and Jason Hamlin also owns shares. Brian Nibley does not own shares of the companies mentioned. This is not a recommendation to invest, please perform your own due diligence.
Gold Stock Bull is not an investment advisory service, nor a registered investment advisor or broker-dealer and does not purport to tell or suggest which securities or currencies customers should buy or sell for themselves. All ideas, opinions, and/or forecasts, expressed or implied herein, are for informational purposes only and should not be construed as a recommendation to invest, trade, and/or speculate in the markets. Any investments, trades, and/or speculations made in light of the ideas, opinions, and/or forecasts, expressed or implied herein, are committed at your own risk, financial or otherwise. The information on this site has been prepared without regard to any particular investor’s investment objectives, financial situation, and needs. Accordingly, investors should not act on any information on this site without obtaining specific advice from their financial advisor. Past performance is no guarantee of future results. Full disclaimer.
Streetwise Reports Disclosure: 1) Brian Nibley and GoldStockBull disclosures are above. Gold Stock Bull determined which companies would be included in this article based on his research and understanding of the sector. 2) The following companies mentioned in this article are billboard sponsors of Streetwise Reports: None. Click here for important disclosures about sponsor fees. 3) Statements and opinions expressed are the opinions of the author and not of Streetwise Reports or its officers. The author is wholly responsible for the validity of the statements. The author was not paid by Streetwise Reports for this article. Streetwise Reports was not paid by the author to publish or syndicate this article. The information provided above is for informational purposes only and is not a recommendation to buy or sell any security. Streetwise Reports requires contributing authors to disclose any shareholdings in, or economic relationships with, companies that they write about. Streetwise Reports relies upon the authors to accurately provide this information and Streetwise Reports has no means of verifying its accuracy. 4) This article does not constitute investment advice. Each reader is encouraged to consult with his or her individual financial professional and any action a reader takes as a result of information presented here is his or her own responsibility. By opening this page, each reader accepts and agrees to Streetwise Reports’ terms of use and full legal disclaimer. This article is not a solicitation for investment. Streetwise Reports does not render general or specific investment advice and the information on Streetwise Reports should not be considered a recommendation to buy or sell any security. Streetwise Reports does not endorse or recommend the business, products, services or securities of any company mentioned on Streetwise Reports. 5) From time to time, Streetwise Reports LLC and its directors, officers, employees or members of their families, as well as persons interviewed for articles and interviews on the site, may have a long or short position in securities mentioned. Directors, officers, employees or members of their immediate families are prohibited from making purchases and/or sales of those securities in the open market or otherwise from the time of the interview or the decision to write an article until three business days after the publication of the interview or article. The foregoing prohibition does not apply to articles that in substance only restate previously published company releases.
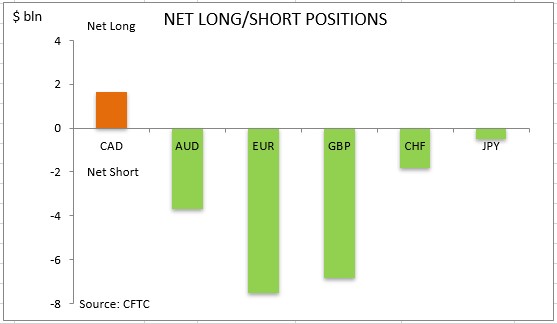
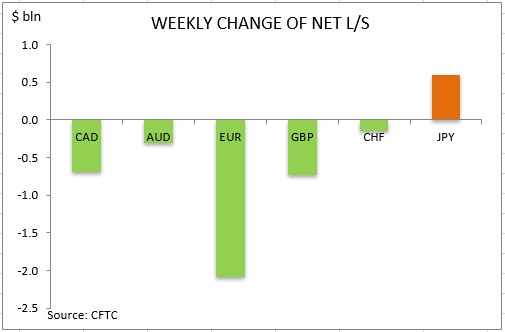
US dollar net long bets increased significantly to $18.71 billion from $15.32 billion against the major currencies during the one week period, according to the report of the Commodity Futures Trading Commission (CFTC) covering data up to July 30 and released on Friday August 2. The dollar strengthening continued ahead of Federal Reserve July 30-31 meeting despite the Bureau of Economic Analysis report US gross domestic product slowed from April to June.
Note: This overview has an informative and tutorial character and is published for free. All the data, included in the overview, are received from public sources, recognized as more or less reliable. Moreover, there is no guarantee that the indicated information is full and precise. Overviews are not updated. The whole information in each overview, including opinion, indicators, charts and anything else, is provided only for familiarization purposes and is not financial advice or а recommendation. The whole text and its any part, as well as the charts cannot be considered as an offer to make a deal with any asset. IFC Markets and its employees under any circumstances are not liable for any action taken by someone else during or after reading the overview.
In an interview with Maurice Jackson of Proven and Probable, executives from this prospect generator exploring in Ontario outline their work on a new project.
Maurice Jackson: Welcome to Proven and Probable, where we provide mining insights in bullion sales. Joining us for a conversation is Dr. John-Mark Staude and special guest Freeman Smith of Riverside Resources Inc. (RRI:TSX.V; RVSDF:OTCQB), where knowledge is golden. Gentlemen, welcome to the show.
Dr. Staude, before we delve into today’s interview, please introduce us to Riverside Resources and the opportunity you present to the market.
John-Mark S.: Riverside’s a prospect generator. With this news, we’re showing how we’re doing work in Canada. We generate projects and have joint-venture partnershipsfor example, the work we’re doing with BHP Billiton Ltd. (BHP:NYSE; BHPLF:OTCPK)which expose our shareholders to multiple commodities, particularly gold, and the upside without having all the dilution because we use the joint-venture prospect-generator model.
Maurice J.: Earlier this year you shared the vision for Riverside Resources for 2019, and it was the five Cs. Please reintroduce the five Cs as they are germane to today’s discussion.
John-Mark S.: One of the key Cs was Canada. Another one was copper, which we deliver with BHP. [Another] was the work on Cecilia, where we’ve had results. But for us the key thing right now with Canada is the news about the new discoveries and the growth we’re doing there. That C is really the big C we’re so excited about now for Riverside, for the next six months and [for] the news flow we’ll have as well.
Maurice J.: Mr. Smith, you’re the vice president of exploration for Riverside, and you’re spearheading the operations in Canada. Why is Riverside focusing its efforts and resources in Ontario?
Freeman Smith: Well, Canada and Ontario have long been known for gold production. Ontario is one of the most prolific greenstone and gold-producing provinces or jurisdictions on the planet, so that’s a very good place to start looking for new, major gold discoveries. I think it’s one of the most productive greenstone belts in a world. A lot of people are coming home to Canada. They’re looking at past work and what’s been left behind and what’s the potential for the future. I think as far as Canada and Ontario goes, there’s lots more to do there, lots more to look for, and lots more potential for discovery.
Maurice J.: Gentlemen, Riverside Resources has some exciting news regarding new outcropping in a high-grade gold asset in Ontario. This sounds quite interesting. Mr. Smith, Introduce us to what is known now as the Oakes Project.
Freeman Smith: The Oakes Project is in an area that’s been looked at, in the past, by Hardrock Mining, which eventually became Greenstone Gold Mines, and it’s also an area that I had worked in the past, so it was something I went to naturally as a place to go looking.
Maurice J.: I’m curious. What caught your attention from an historical data reference standpoint? Do we have geophysics, geochemistry and drilling results?
Freeman Smith: Oh, this area actually has a lot of data. It’s got several generations of geophysics and two or three different building campaigns, all of which produced gold. The people in the past were looking for copper, so they kind of ignored the gold, and if something was left behind for us to sort of pick up on and take off with.
Maurice J.: Now what kind of results are we seeing from the Oakes Project?
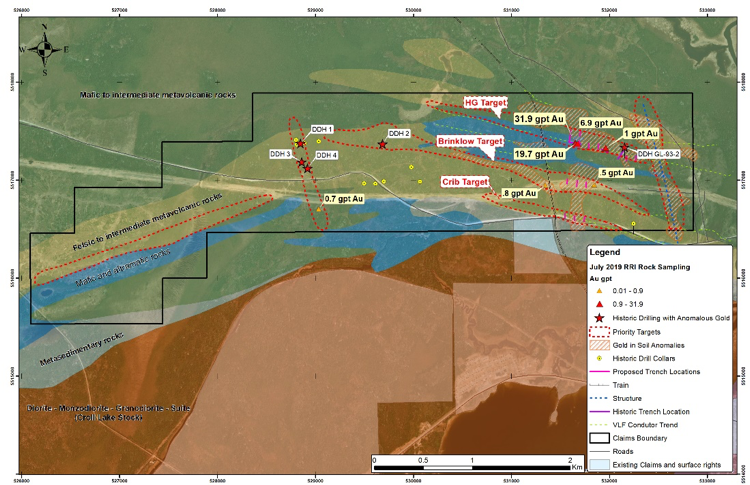
Freeman Smith: Well, in the past trenches, areas that were worked in the past by others, we went back and resampled. We got over an ounce per ton in some areas. These are typical, saw-cut channel samples, but over less than a meter. But they’re showing PGEs (platinum group elements) and excellent gold results, so we try to follow up on that.
Maurice J.: What activity is actively going on there now?
Freeman Smith: Riverside was in the field for several weeks, just returning last week. We did sampling and mapping, looking at the older work. Some of the results came back very good, so I’m sure we’re going to be back out there soon. You can see on the map there’s a number of old prospects and old drill holes that returned anomalous gold and some high-grade values, and that’s another thing we need to go back and check up on.
Maurice J.: Have discussions taken place with potential joint-venture partners?
John-Mark S.: They have, actually, and it’s really interesting. You know, having projects in Canada fits with that key C, and what Freeman’s been able to do is get us out in the field and get out thereswat away all the flies, get rid of the mosquitoesand really get in there and find the gold, and the partners are coming. We’re looking forward to trying to work on deal terms, and yeah, following our business plan, we definitely see an active fall with this and other projects in the belt.
Maurice J.: Dr. Staude, let me ask you this, just from an outsider perspective. What type of tangibles are these joint venture partners looking for?
John-Mark S.: I think three things. First is they really like gold. Gold is hot right now. I had calls this morning. You know, day in and day out, gold’s hot. Secondly, they want to see access. This project is so accessible, you can easily get to it. Third is ownership. Riverside owns this 100% with no underlying deal. Those things make it really ideal for joint-venture partnerships.
Maurice J.: Switching gears, John-Mark, please share the capital structure for Riverside Resources.
John-Mark S.: Riverside has a tight share structure with fewer than 63 million shares out and a good cash position of over $3 million cash plus cash and shares from other parties of over $3 million as well. And on top of that, another $1.5 million work program funded by BHP each year, so we’re in a very good, strong capital position, tight share structure.
Maurice J.: John-Mark, it’s been a busy year for Riverside Resources. What is the next unanswered question? When can we expect an answer and what determines success?
John-Mark S.: I think the next things are more results from Canada, particularly more projects growing out [and] joint-venture partners. We’re very excited by this first step, and we’ve been working very hard to deliver that. 2019 for us: Canada’s big and Mexico with BHP, so we have a number of different things coming.
Maurice J.: Dr. Staude, for someone listening that wants to give more information on Riverside Resources, please share the contact details.
John-Mark S.: Please visit the website www.rivres.com or give us a phone call at (778) 327-6671.
Maurice J.: As a reminder, Riverside Resources trades on the TSX.V:RRI, and on the OTCQB:RVSDF. Riverside Resources is a sponsor of Proven and Probable, and we are proud shareholders for the virtues conveyed in today’s message.
Before you make your next bullion purchase, make sure you call me. I’m your licensed representative from Miles Franklin Precious Metals Investments, where we provide a number of options to expand your precious metals portfolio from physical delivery, off-shore depositories, precious metal IRAs, and private blockchain distributed ledger technology. Call me directly at (855) 505-1900, or you may email [email protected].
Finally, we invite you to visit provenandprobable.com, where we provide mining insights and bullion sales. Gentlemen, thank you for joining us today on Proven and Probable.
Maurice Jackson is the founder of Proven and Probable, a site that aims to enrich its subscribers through education in precious metals and junior mining companies that will enrich the world.
Disclosure: 1) Maurice Jackson: I, or members of my immediate household or family, own shares of the following companies mentioned in this article: Riverside Resources. I personally am, or members of my immediate household or family are, paid by the following companies mentioned in this article: None. My company has a financial relationship with the following companies mentioned in this article: Riverside Resources. Proven and Probable disclosures are listed below. 2) The following companies mentioned in this article are billboard sponsors of Streetwise Reports: None. Click here for important disclosures about sponsor fees. 3) Statements and opinions expressed are the opinions of the author and not of Streetwise Reports or its officers. The author is wholly responsible for the validity of the statements. The author was not paid by Streetwise Reports for this article. Streetwise Reports was not paid by the author to publish or syndicate this article. The information provided above is for informational purposes only and is not a recommendation to buy or sell any security. Streetwise Reports requires contributing authors to disclose any shareholdings in, or economic relationships with, companies that they write about. Streetwise Reports relies upon the authors to accurately provide this information and Streetwise Reports has no means of verifying its accuracy. 4) This article does not constitute investment advice. Each reader is encouraged to consult with his or her individual financial professional and any action a reader takes as a result of information presented here is his or her own responsibility. By opening this page, each reader accepts and agrees to Streetwise Reports’ terms of use and full legal disclaimer. This article is not a solicitation for investment. Streetwise Reports does not render general or specific investment advice and the information on Streetwise Reports should not be considered a recommendation to buy or sell any security. Streetwise Reports does not endorse or recommend the business, products, services or securities of any company mentioned on Streetwise Reports. 5) From time to time, Streetwise Reports LLC and its directors, officers, employees or members of their families, as well as persons interviewed for articles and interviews on the site, may have a long or short position in securities mentioned. Directors, officers, employees or members of their immediate families are prohibited from making purchases and/or sales of those securities in the open market or otherwise from the time of the interview or the decision to write an article until three business days after the publication of the interview or article. The foregoing prohibition does not apply to articles that in substance only restate previously published company releases. As of the date of this article, officers and/or employees of Streetwise Reports LLC (including members of their household) own securities of Riverside Resources, companies mentioned in this article.
Proven and Probable LLC receives financial compensation from its sponsors. The compensation is used is to fund both sponsor-specific activities and general report activities, website, and general and administrative costs. Sponsor-specific activities may include aggregating content and publishing that content on the Proven and Probable website, creating and maintaining company landing pages, interviewing key management, posting a banner/billboard, and/or issuing press releases. The fees also cover the costs for Proven and Probable to publish sector-specific information on our site, and also to create content by interviewing experts in the sector. Monthly sponsorship fees range from $1,000 to $4,000 per month. Proven and Probable LLC does accept stock for payment of sponsorship fees. Sponsor pages may be considered advertising for the purposes of 18 U.S.C. 1734.
The Information presented in Proven and Probable is provided for educational and informational purposes only, without any express or implied warranty of any kind, including warranties of accuracy, completeness, or fitness for any particular purpose. The Information contained in or provided from or through this forum is not intended to be and does not constitute financial advice, investment advice, trading advice or any other advice. The Information on this forum and provided from or through this forum is general in nature and is not specific to you the User or anyone else. You should not make any decision, financial, investments, trading or otherwise, based on any of the information presented on this forum without undertaking independent due diligence and consultation with a professional broker or competent financial advisor. You understand that you are using any and all Information available on or through this forum at your own risk.
Thailand’s central bank surprisingly cut its policy rate by 25 basis points to 1.50 percent to boost economic growth, which is expected to be slower than expected due to a decline in exports, and support the rise of inflation, which is projected to be below the lower bound of the target range. It is the first rate cut by the Bank of Thailand (BOT) since April 2015 and reverses the bank’s interest rate hike in December last year that was carried out to help build more room for easier policy in the event of a economic slowdown and also curb the risks of financial instability. BOT’s monetary policy committee voted 5-2 to lower the policy rate, with 2 members voting to maintain the rate, arguing for the need to preserve policy space. In its statement, the policy committee said the Thai economy is expected to “expand at a lower rate than previously assessed due to a contraction in merchandise exports, which started to affect domestic demand.” In June BOT cut its 2019 economic growth forecast to 3.3 percent from an earlier 3.8 percent compared with 2018 growth of 4.1 percent. “Inflation was projected to be lower than the lower bound of the inflation target,” BOT said, as energy prices had declined at a fast pace while core inflation is expected to ease due to “subdued demand-pull inflationary pressures.” Structural changes, such as an expansion of e-commerce, rising price competitions and technological developments that lowers the cost of production, is also curbing inflation, BOT said. Thailand’s inflation rate rose to 0.98 percent in July from 0.87 percent in June and the BOT had earlier expected inflation to return to its target range of 1.0 to 4.0 percent this year. “The Committee would monitor external risks from intensifying trade tensions, the economic outlook of China and advanced economies that could affect domestic demand, as well as geopolitical risks,” BOT said.
Bank of Thailand’s Monetary Policy Committee released the following decision:
“The Committee voted 5 to 2 to cut the policy rate by 0.25 percentage point from 1.75 to 1.50 percent, effective immediately. Two members voted to maintain the policy rate at 1.75 percent. In deliberating their policy decision, the Committee assessed that the Thai economy would expand at a lower rate than previously assessed due to a contraction in merchandise exports, which started to affect domestic demand. Inflation was projected to be lower than the lower bound of the inflation target. Overall financial conditions remained accommodative. Financial stability risks had already been addressed to some extent, although there remained pockets of risks that warranted monitoring. A more accommodative monetary policy stance would contribute to the continuation of economic growth and should support the rise of headline inflation toward target. Most members thus voted to cut the policy rate at this meeting. Nevertheless, two members viewed that the policy rate cut under the already accommodative monetary policy might not lend additional support to economic growth, compared with potentially increased financial stability risks. Moreover, there remained a need to preserve policy space. The Thai economy was expected to expand at a lower rate than previously assessed and below potential. Merchandise exports contracted more than the previous assessment due to the slowdown of trading partner economies and global trade, which were affected by intensifying trade tensions that could expand to other countries. Tourism would grow at a lower rate. Regarding domestic demand, private consumption was expected to moderate in tandem with a decline in non-farm household income and employment, particularly employment in the export-related manufacturing sector. In addition, private consumption would be restrained by elevated household debt. Private investment was projected to slow down. However, the relocation of production base to Thailand and public-private partnership projects for infrastructure investment would support investment in the period ahead. Public expenditure would grow at a slower pace than previously estimated on account of public investment, which was partly a result of constrained budget disbursement, as well as the expected delay in the enactment of the Annual Budget Expenditure Act, B.E. 2563 (A.D. 2020). The Committee would monitor external risks from intensifying trade tensions, the economic outlook of China and advanced economies that could affect domestic demand, as well as geopolitical risks. Furthermore, the Committee would monitor policy implementation of the new government and public expenditure, as well as the progress of major infrastructure investment and its knock-on effects on private investment, which could affect the momentum of economic growth in the period ahead.
The annual average of headline inflation was projected to be below the lower bound of the inflation target. Key drivers were energy prices, which declined at a fast pace, and core inflation, which was expected to moderate owing to subdued demand-pull inflationary pressures. The Committee viewed that structural changes contributed to more persistent inflation than in the past. Such changes included the expansion of e-commerce, rising price competition, and technological development which reduced costs of production. Financial conditions over the previous period had been accommodative, with ample liquidity in the financial system. Real interest rates remained at a low level, allowing financing by the private sector to continue expanding. However, loans extended to both businesses and consumers would exhibit slower growth. With regard to exchange rates, the Committee expressed concerns over the baht appreciation against trading partner currencies, which might affect the economy to a larger degree amid intensifying trade tensions. However, The Committee would closely monitor developments of exchange rates and capital flows as well as assess the necessity of additional appropriate measures. Financial stability remained sound overall but there remained a need to monitor risks that might pose vulnerabilities to financial stability in the future. The Committee viewed that the implemented macroprudential measures had to some extent curbed accumulation of vulnerabilities in the financial system. Nevertheless, the Committee would monitor rising household debt accumulation, growth in assets held by saving cooperatives and the interconnectedness among saving cooperatives, and leverage by large corporates that could underprice risks. In the following period, given the softening outlook of the Thai economy and a prolonged low interest rate environment, microprudential and macroprudential measures would need to play an increasing role in addressing financial stability risks. Looking ahead, the Committee would continue to closely monitor developments of economic growth, inflation, and financial stability, together with associated risks, especially impacts of trade tensions, in deliberating appropriate monetary policy going forward. Nevertheless, the Thai economy would continue to face structural problems, which would affect competitiveness and economic growth outlook. This should be firmly addressed by all related parties.” www.CentralBankNews.info
Later today we have some key data coming out of Mexico which could move the markets: CPI.
This is the last chance at major data before next week’s Banxico monetary policy decision. Since Banxico has been trying to deal with the high inflation in the country, we might want to pay extra attention to this data.
Just as recently this Monday, the head of the Finance Ministry said that he expected interest rates to decline in order to boost demand. This is representative of the government’s wanting to ease in order to support the economy and keep pace with other world central banks.
It contrasts with Banxico’s view, which cares more about inflation. If inflation trends continue, the government might get its wish.
What We Are Looking For
There are three CPI measures published at the same time.
Typically, the market focuses on the monthly figure since that’s the freshest data. However, it’s the annualized that guides policy. For reference, the Banxico has an objective of 3% annual inflation, the midpoint of an “acceptable” range of 2% to 4%.
The consensus of expectations is that the monthly CPI figure will register at 0.33%, substantially up from 0.06% in the prior month. This would bring the annualize drate to 4.06%. This slightly up from 3.95% but barely above the top of the range. We can actually expect the monthly core rate to decrease to 0.21%from 0.30% in the prior month.
What it Means for the Markets
Under normal circumstances, higher inflation is usually interpreted as negative for the currency.
But, given the recent data trends out of Mexico, the perception is reversed because higher inflation would imply that Banxico will have a reason to hold off on a rate cut. Lower inflation gives them breathing room to take action to prop up the economy.
Mexico has slipped into a position of unofficial stagflation. The CPI has remained relatively high while the economy fails to gain momentum. Last week, the National Statistics Institute (Inegi) disclosed the first year over year contraction in the economy since 2009.
There Isn’t Much Room for an Upside
A recent survey of financial advisors by the Banxico showed that the vast majority said it was a bad time to invest in the country. The survey indicated that most businesses are holding off on both acquisitions and expansions.
On the other hand, retail sales during June came in above expectations. And this supported the comments by President Lopez that he saw domestic demand increasing.
However, the consensus among analysts is that consumer demand doesn’t drive Mexico’s inflation. What drives it is fiscal policy and structural issues. The new government’s economic plan is largely seen as the opposite of the sorts of measures that would lower inflation.
Expectations for the Market
In the end, it’s down to the expectations of what Banxico will do. With high expectations of a rate cut, a significantly higher than expected inflation rate might actually strengthen the currency quite a bit. The market appears to be pricing in a lower inflation rate, limiting the risk on the downside.
Gold leapt more than 1.5% to a fresh six-year high on Wednesday after three central banks cut interest rates in the face of slowing global growth and persistent trade tensions.
Unfavourable global macroeconomic conditions, US-China trade disputes and Brexit drama among many other geopolitical risk factors have accelerated the flight to safety. With central bank across the world joining the global monetary easing train, zero-yielding Gold is poised to perform incredibly well in this low-interest rate environment. The precious metal remains technically and fundamentally bullish and this continues to be reflected in price action.
Focusing on the technical picture, a solid daily close above $1500 is likely to strengthen bulls further and open the doors to $1530. Should $1500 prove to be a stubborn resistance, the precious metal is likely to retrace back towards $1490.
Disclaimer: The content in this article comprises personal opinions and should not be construed as containing personal and/or other investment advice and/or an offer of and/or solicitation for any transactions in financial instruments and/or a guarantee and/or prediction of future performance. ForexTime (FXTM), its affiliates, agents, directors, officers or employees do not guarantee the accuracy, validity, timeliness or completeness, of any information or data made available and assume no liability as to any loss arising from any investment based on the same.
The ongoingUS-China trade war took another dramatic turn last week. Initially, focus had been on the fresh set of trade talks taking place in Shanghai.
Expectations were low given the previous difficulty with talks. However, there was still a level of optimism as the market expected the two sides to finally work together to end the trade war.
Trump’s Twitter Announcement
However, following the two days of talks, which ended with seemingly little-to-none progress, the market was rocked by news of fresh US tariffs on Chinese goods.
Trump announced a further 10% tariff on $300 billion worth of Chinese goods via a post on Twitter. The post read:
China Retaliates with Currency Devaluation & US Agriculture Exit
China immediately responded to the news saying that it plans to retaliate. And it seems they’ve already made their first moves.
In early trading on Monday morning, the Chinese yuan spiked sharply lower against USD. USDCNH was trading above the 7 level for the first time since the Global Financial Crisis in 2008.
The move has been interpreted as a clear retaliation by the Chinese government against Trump. The Treasury Department, therefore, swiftly called out China for currency manipulation early on Tuesday.
Following this, the People’s Bank Of China (PBOC) helped contain the falls. The USDCNH outlook remains bullish above the 7 mark and this is likely to remain the case should the PBOC maintain a limited size of yuan longs.
China did also suspend the purchase of US agricultural products as early as Monday this week in response to Trump’s new trade war rout. China’s Commerce Ministry did this as an indication that China both can and will use other means of retaliation to hit back.
How Else Could China Retaliate & What Would The Market Impact Be?
The two retaliatory moves are likely just the first step for the Chinese.
The option we can expect the most is for a further increase in tariffs on other US goods.
However, China is likely very near the limit of how many tariff increases its own economy can withstand. Tariffs on US goods impact the turnover and profitability of domestic businesses, many of which are already suffering as a result of US tariffs. The game of tit-for-tat tariff raising is, therefore, unlikely to be sustainable for China.
In fact, should China announce tariffs of its own, global equities would be shunted further lower. So the Asian giant will no doubt be considering alternative options now.
Meanwhile, the hit to global trade has been revealed. European, Asian and UK equities have all been under pressure this week along with US and Chinese stocks.
Ban on Rare Earth Exports
Following the breakdown of talks in May and the subsequent tariffs from the US, the prospect of China banning exports of rare earths materials was raised.
These materials are used in many high tech applications and operations. And with China holding a monopoly in their supply, such a move could be devastating for US businesses. This would be especially damaging to the highly profitable US tech sector which has, so far, been relatively shielded from the impact of the trade war.
The potential damage to tech companies would likely be reflected in a sharp move lower in the NASDAQ (along with a general risk-off tone to equities).
Unreliable Entity List
Another route which we might see China taking would be to announce its own “Entity List”. This would be its own version of the one the US used to ban Huawei from dealing with US companies.
The Chinese Ministry of Commerce of China (MOFCOM) announced on May 31st, 2019 that it was drawing up a list to be announced shortly. With such a list, the Chinese government could prohibit Chinese companies from conducting business with specified US companies.
Once again, such a move would weigh heavily on US equities prices.Gold prices would likely be well supported in either instance. Safe-haven inflows are already boosting gold higher this week. The precious metal is now trading at its highest level since May 2013! This comes as investors flood to safety in light of the ongoing equities collapse.
How Will This Impact US Monetary Policy?
The Fed is certain to be watching these developments with disappointment. The central bank cited the ongoing risks from the trade war as a reason for cutting rates last month, despite downplaying the likelihood of further easing.
However, with trade tensions increasing once again, the Fed could need to ease again. This is despite the bank stating that it shouldn’t respond to trade disputes.
The course of Chinese retaliation will undoubtedly be a key factor in the impact on both the US and global economy in the coming months.
Market Impact
The reaction in US equities has been severe. The SPX500 has reversed heavily from recent highs around 3031, breaking back down below the 2958.22 level. Prices broke outside the bullish trend line from last year’s lows, with structural support sitting just beneath at 2811. A break here could pave the way for a much deeper run down to support at the 2727 level. Below there, the 2623 level stands as the next support, by which point the decline would have exceeded the 50% Fibonacci retracement of the current bull trend.
New Zealand’s central bank lowered its benchmark Official Cash Rate (OCR) by a larger-than-expected 50 basis points to 1.0 percent to boost employment and inflation as “global economic growth continues to weaken, easing demand for New Zealand’s goods and services.” In May the Reserve Bank of New Zealand (RBNZ) became the first developed market central bank to cut its rate in the current global monetary cycle, and the central bank has now cut its policy rate by a total of 75 basis points this year. “In the absence of additional monetary stimulus, employment and inflation would like ease relative to our targets,” the RBNZ said, adding “heightened uncertainty and declining international trade have contributed to lower trading partner growth.” Members of the central bank’s monetary policy committee discussed the relative benefits of lowering the policy rate by 25 basis points now along with an easing bias as compared with cutting the rate by 50 points right away. In the end, the committee agreed to lower the rate by 50 basis points as it had “agreed that the larger monetary stimulus would best ensure the Committee continues to meet its inflation and employment objectives.”
The Reserve Bank of New Zealand release the following statement:
“Tēnā koutou katoa, welcome all.
The Official Cash Rate (OCR) is reduced to 1.0 percent. The Monetary Policy Committee agreed that a lower OCR is necessary to continue to meet its employment and inflation objectives.
Employment is around its maximum sustainable level, while inflation remains within our target range but below the 2 percent mid-point. Recent data recording improved employment and wage growth is welcome.
GDP growth has slowed over the past year and growth headwinds are rising. In the absence of additional monetary stimulus, employment and inflation would likely ease relative to our targets.
Global economic activity continues to weaken, easing demand for New Zealand’s goods and services. Heightened uncertainty and declining international trade have contributed to lower trading-partner growth. Central banks are easing monetary policy to support their economies. Global long-term interest rates have declined to historically low levels, consistent with low expected inflation and growth rates into the future.
In New Zealand, low interest rates and increased government spending will support a pick-up in demand over the coming year. Business investment is expected to rise given low interest rates and some ongoing capacity constraints. Increased construction activity also contributes to the pick-up in demand.
Our actions today demonstrate our ongoing commitment to ensure inflation increases to the mid-point of the target range, and employment remains around its maximum sustainable level.
Meitaki, thanks.
Summary record of meeting – August 2019 Statement
The Monetary Policy Committee agreed there was a need for further monetary stimulus to meet its inflation and employment objectives.
The Committee noted recent economic developments were broadly as expected and employment was around the targeted maximum sustainable level. The Committee was pleased to see that the labour market data held up relative to expectations in the June 2019 quarter.
However, the Committee noted that inflation remains below 2 percent and the outlook for employment and inflation was softer. GDP growth had slowed and global conditions had weakened.
The Committee agreed that the balance of risks to achieving its consumer price inflation and maximum sustainable employment objectives was tilted to the downside, although members placed different emphasis on the sensitivities to these risks.
The Committee noted the decline in long-term government bond yields to historically low levels. Financial market participants expect both inflation and policy interest rates to remain low globally for a prolonged period. Some members noted that survey measures of short-term inflation expectations in New Zealand had declined recently. Others were encouraged that longer-term expectations remained anchored at close to 2 percent.
The Committee agreed that weak global economic conditions could see imported inflation remain low if global growth slows further or if commodity prices decline. The members discussed the range of appropriate policy responses should imported inflation persist at low levels.
The Committee welcomed the recent employment and wage data but noted that private sector wage growth was subdued despite businesses having difficulty finding labour. The members discussed that the recent slowdown in growth could dampen wage inflation by more than assumed. Some noted that if cost pressures remain elevated, firms may pass on costs to consumer prices by more than assumed, while others viewed the wage pass through as a natural consequence of a tight labour market and policy stimulus.
The members discussed the recent slower domestic GDP growth and the impact of slowing global demand on New Zealand through the trade, financial and confidence channels. The members noted that heightened global uncertainty was reducing investment and suppressing trading-partner growth. This highlighted the risk of a larger or more prolonged slowdown in global economic growth.
The Committee noted that additional stimulus from central banks had underpinned growth and reduced the likelihood of a more-pronounced slowdown. However, some thought that even with support from monetary stimulus, considerable economic and policy uncertainty could see global growth continue to decline. Other members noted that the easing in global financial conditions since the beginning of the year, or a shift in political environment, could lead to a pick-up in global growth over the next year.
The Committee acknowledged the importance of additional spending from households, businesses, and the government, to meet their inflation and employment targets. They also agreed that additional monetary stimulus was needed. The members discussed several important uncertainties.
The Committee noted that low business confidence had dampened business investment in 2018 and had remained weak in mid-2019. The members discussed that if sentiment remained low, perhaps due to global economic conditions or if profitability remains squeezed, growth might not increase as anticipated over the medium term. The members also noted that the shift in domestic production from manufacturing towards services was also dampening business investment.
The outlook for household spending was discussed with regard to the assumed dampening impact of soft house price inflation. Some members noted lower mortgage rates could contribute to a stronger pick-up in house price inflation, which could support consumption. Other members noted that house price inflation could remain weak, for example if net immigration continued to decline relative to the number of new houses being constructed.
The Committee noted that fiscal assumptions embedded in the projections were consistent with Budget 2019, which included adjustments to reflect that government spending takes time to increase. The members discussed that fiscal policy could be more supportive if future announcements incorporate more spending or if the impact on domestic demand is larger than assumed. This view was balanced by the impact of any increase in government spending being delayed, for example due to timing of the implementation of new initiatives and difficulty finding labour.
The Committee also discussed the contribution of monetary policy to the projected pick-up in growth and inflation. The members noted that estimates of the neutral level of interest rates have continued to decline and this was consistent with generally lower interest rates over time. Members also noted the Bank’s current assessment of analysis on the transmission from monetary policy to growth and inflation. This suggested that the overall strength of these relationships was little changed in the environment of low interest rates.
The Committee agreed to continue to monitor and assess the impacts of monetary policy, including the transmission through to retail interest rates.
The Committee reached a consensus that, relative to the May Statement, a lower path for the OCR over the projection period was appropriate. The lower OCR path reflected the economic projections and the balance of risks discussed.
The members debated the relative benefits of reducing the OCR by 25 basis points and communicating an easing bias, versus reducing the OCR by 50 basis points now. The Committee noted both options were consistent with the forward path in the projections. The Committee reached a consensus to cut the OCR by 50 basis points to 1.0 percent. They agreed that the larger initial monetary stimulus would best ensure the Committee continues to meet its inflation and employment objectives.”