EURCHF Analysis: Weak euro-zone, improving Swiss data bearish for EURCHF

By IFCMarkets

Weak euro-zone and improving Swiss data bearish for EURCHF

Euro area data weakened while Swiss indicators improved. Will the EURCHF decline continue?

Euro-zone economic data were weak after flash reading of GDP indicated economic growth slowed in Q2 in single currency area: contraction in manufacturing sector deepened in July, and services sector expansion slowed as Markit’s manufacturing PMI declined to 46.5 from 47.6 and services PMI slipped to 53.2 from 53.6. For the same month KOF Leading Indicators for Switzerland rose to 97.1 from an upwardly revised 93.8 in June. Indicator improved in manufacturing, services and construction sectors. Weaker eurozone data and improving Swiss data are bearish for EURCHF.

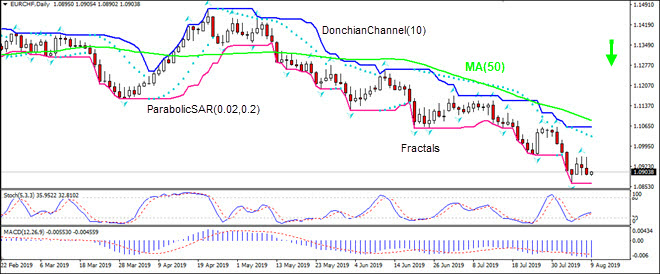
EURCHF falling below MA(50) 08/09/2019 Technical Analysis IFC Markets chart

On the daily timeframe EURCHF: D1 is retracing lower after hitting 10-month high in the end of April, and is below the 50-day moving average MA(50) which is falling. These are bearish developments.

We believe the bearish momentum will continue after the price breaches below the lower Donchian boundary at 1.0862. This level can be used as an entry point for placing a pending order to sell. The stop loss can be placed above the upper Donchian channel at 1.0957. After placing the pending order the stop loss is to be moved every day to the next fractal high, following Parabolic signals. Thus, we are changing the expected profit/loss ratio to the breakeven point. If the price meets the stop-loss level (1.0957) without reaching the order (1.0862) we recommend cancelling the order: the market sustains internal changes which were not taken into account.

Technical Analysis Summary

OrderSell
Sell StopBelow 1.0862
Stop lossAbove 1.0957

Market Analysis provided by IFCMarkets

Gold Explodes Following Equities Crash

By Orbex

Gold

It has been a big week for the yellow metal which exploded to trade its highest levels since 2010. The move was driven by the deterioration in the relationship between the US and China which took a further turn for the worse over the last week. Following last week’s trade talks, the first since talks collapsed in May, President Trump took the markets by surprise. He announced a fresh set of trade tariffs. The new 10% tariffs will be applied to a further $300 billion of Chinese goods entering the US from September 1st.

The move has now thrown trade talks into jeopardy once again. Traders are worried that the next set of talks due to take place in September, will be abandoned. Following the announcement, the Chinese then responded.

On Monday the yuan was sharply devalued. USDCNH was sent back over the 7 level for the first time since the 2008 global financial crisis. The mood soured further on Tuesday as the US Treasury Dept issued a statement labeling China as a currency manipulator. This is the first time the label has been officially applied since 1994. It was immediately met with a counter statement from the Chinese central bank the PBoC which denied the claims.

Equities collapsed on Monday in response to the development, fuelling massive safe-haven inflows for gold. While equities have since recovered some of the losses, seeing some softening from recent highs in gold, the yellow metal is still set to end the week at fresh highs. This is keeping focus on further upside in the near term.

Technical Perspective

xauusd

The breakout in gold this week saw price trading back above the 1472.06 level for the first time since 2010. While above here, the focus is on further upside. The next level to watch is the 1522.75 level. This holds the 2012 and mid-2011 low and is a major long term level for gold. The level has not been retested since it was broken in 2013 and should find decent selling on the first test.

Silver

Silver prices have tracked the moves in gold this week with the market surging to its highest level since early 2018. Along with the tensions stemming from the US-China trade war, the precious metals have also been boosted by a wave of fresh central bank easing this week. This was headlined by a .50% rate cut by the RBNZ which was double the market forecast. With expectations for further easing from the Fed as well as easing from the ECB in coming months, the outlook remains positive for metals. Further upside likely to transpire in the near term.

Technical Perspective

forex silver

Silver broke out above the 16.5877 level this week to trade fresh 2019 highs of 17.2430. While above the 16.5877 level, the focus remains on further upside. The next topside level to watch is 17.3336 which is the mid 2018 high. This comes in just below the overall 2018 high at 17.6936. Any break back below the 16.5877 level is likely to find support into the 16.1994 zone.

By Orbex


Part II – Metals and VIX Are About To Pull A “Crazy Ivan”

By TheTechnicalTraders.com

In the first part of this multi-part research post, we highlighted what we are calling a Crazy Ivan price event (borrowed from the movie Red October – (source).  The one thing we want you to take away from this article is that August 19, 2019, should be a major price inflection date where the price is very likely to begin a new downside price trend in the US and global stock markets.  This will likely push commodity prices to extremes and may very well push Gold and Silver into the stratosphere as fear and greed take hold across the planet.

Part I we highlighted how the VIX and the NQ are set up to react to this Crazy Ivan pricing event and how we believe many traders/investors are simply unaware of the potential for this type of large reversion price move.  We want to be clear, we believe the US markets will be somewhat immune from extended downside risks.  This does not mean there won’t be a downside price move and this does not mean that the markets won’t experience the Crazy Ivan reversion trend.  It will likely happen just as we are expecting, yet we believe the US stock markets will quickly recover from this move – like it has done many times in the past.

Our research that highlighted this August 19, 2019 date and the potential for what we are calling the Crazy Ivan price move is rooted in our super-cycle analysis, predictive modeling tools, and other specialized proprietary price modeling solutions and utilities.  We believe we’ve identified a key inflection point/date that will start what we are calling a “breakdown move” which will lead to the Crazy Ivan event throughout the globe.  As we stated in the first part of this article – we don’t know the exact composition of this event yet, but we do know that is should begin to happen near or after August 19, 2019.

Now, let’s get busy digging into the Gold and Silver charts for all our followers.

Gold 2-Week Chart Interval

This first Gold 2-Week chart highlights our Fibonacci price modeling tool and helps to show us where the price is targeting for the initial upside move from the April 21~24 Momentum Base pattern that we called back in January 2019.  We believe the current breakout upside price move will initially target the  $1597 level before briefly stalling, then rallying further to target the $1785 level or higher.

We believe the Crazy Ivan event could push Gold much higher than our projected levels under certain circumstances:

A. The US Dollar weakens throughout the initial process of the Crazy Ivan event

B.  Cryptos collapse as governments clamp down on rogue exchanges/currencies

C.  Massive credit and debt issues arise in China, Asia or the EU that threaten future economic output and operations

D.  Some type of crisis event unfolds where global investors believe war or conflict is imminent. (think Hong Kong, North Korea or somewhere in that general vicinity).

Without these additional impetuses in the metals market, we believe the price will follow our Crazy Ivan expectations (YELLOW LINES, below) fairly closely over the next 30 to 60+ days.

Silver Daily Chart Interval

Silver, on the other hand, is set up to break substantially higher based on the upside move we expect in Gold and the possibility that the Gold/Silver ratio will continue to contract to lower levels.  Recently, the Gold/Silver ratio fell from approximately 93 to 86.  This move relates the total number of ounces of Silver one must buy to equal the price of one ounce of Gold.  Currently, this level is back up to 89.5 as Gold has rallied faster than Silver has rallied.

But what happens when traders catch onto the fact that Gold and Silver will rally as this Crazy Ivan event takes place and that Silver is the true undervalued metal across the planet?  At the peak of Gold/Silver prices near April 2011, the Gold/Silver ratio was resting near 32 (yes you read that properly).  What would that look like on the Silver chart, below, if Gold continued to rally to levels above $2000?  It is really simple to find out.

$2000 (Gold per ounce) / 32 = $62.50 per ounce for Silver

What if Gold rallied a full 100% Fibonacci measured move from the previous 1999-2011 rally?  That peak level would be $2700 in Gold and the calculation is still simple.

$2700 (estimate Gold peak) / 32 = $84.375 per ounce for Silver.

Could it happen like this?  Yes, in theory, and reality it really could happen that Gold rallies to a level that equals a full 100% Fibonacci price extension and the ratio level falls to levels near 32.  If that were to happen, then these calculations would be accurate.

This is why we believe the Crazy Ivan event will become the catalyst for some really incredible trading opportunities and big price swings over the next 6 to 13+ months.

CONCLUDING THOUGHTS:

Our $21 upside price target in Silver is really muted compared to our long term price projections.  Yet everything hinges on this August 19, 2019 breakdown cycle date and what happens after that.  Our research suggests this current downside price move may have been a volatility explosion related to the lack of liquidity in the global markets and to hint that the markets are capable of being far more irrational for far longer than anyone expects.

We are only 9 days into August and we have already closed out 24.16% in gains from the falling SP500 using SDS, and the pop in gold using UGLD, and from the oversold bounce and rally in silver miners SIL.

We urge all of our followers to pay attention to our research, consider your options very closely and prepare for this next move by pulling some of your active portfolio away from risks and into more protective measures.  This Crazy Ivan event is just 10 days away and we really want to urge all of our followers to not under-estimate this event cycle.

WARNING SIGNS ABOUT GOLD, SILVER, MINERS, AND S&P 500

In early June I posted a detailed video explaining in showing the bottoming formation and gold and where to spot the breakout level, I also talked about crude oil reaching it upside target after a double bottom, and I called short term top in the SP 500 index. This was one of my premarket videos for members it gives you a good taste of what you can expect each and every morning before the Opening Bell. Watch Video Here.

I then posted a detailed report talking about where the next bull and bear markets are and how to identify them. This report focused mainly on the SP 500 index and the gold miners index. My charts compared the 2008 market top and bear market along with the 2019 market prices today. See Comparison Charts Here.

On June 26th I posted that silver was likely to pause for a week or two before it took another run up on June 26. This played out perfectly as well and silver is now head up to our first key price target of $17. See Silver Price Cycle and Analysis.

More recently on July 16th, I warned that the next financial crisis (bear market) was scary close, possibly just a couple weeks away. The charts I posted will make you really start to worry. See Scary Bear Market Setup Charts.

FREE GOLD OR SILVER WITH MEMBERSHIP!

Become a technical trader and profit like a pro!
Click Here

Chris Vermeulen


High Betas Bouncing Back

By Orbex

Dollar Down on Friday

The US dollar continued to stagnate over the European morning on Friday. Following last week’s heavy losses, the USD index has spent the week in a block of consolidation just above the 97.11 level. Expectations of further easing from the Fed, as well as the negative impact from the escalating trade war with China, are likely to keep USD pressured in the near term.

EUR Still Capped by 1.1217

EURUSD has benefited from the weakness in USD today, trading in the green over the European morning. Despite the upside over trading so far today, price has yet to close above the 1.1217 level, which has capped price all week. In the near term, expectations of ECB easing continue to weigh on the outlook for EURUSD.

GBP Still At Support

GBPUSD remains muted over the early European session on Friday, despite the weakness in USD. The growing risk of a no-deal Brexit is weighing heavily on GBP sentiment. Price is keeping glued to the 1.2073 support level where the market has stagnated all week.

Risk Recovery Grinds On Slowly

Risk assets have had a quiet end to the week also. Following a solid recovery over the early part of the week, the SPX500 has lost momentum now and is stalling below the 2958.22 resistance, trading 2924.93 last. A wave of fresh central bank easing this week has helped underpin equities following the heavy sell-off on Monday. Incoming US data will be watched over the coming weeks as the market tries to gauge the likelihood of further easing from the Fed, which would help keep equities supported.

Safe Havens Muted

Safe havens have had a mixed end to the week with gold a little softer over the session while JPY has strengthened. XAUUSD trades 1503.51 last, sitting just below the recent highs. Gold exploded to levelsnot seen since 2010 this week as the rout in equities fuelled a large safe haven inflow. USDJPY trades 105.87 last with price languishing near the recent 105.55 lows.

Oil Bounce Continues

Oil prices have been a little higher today, as crude continues its recovery off the recent 50.80 lows. Price was knocked heavily lower this week as a combination of growing concerns regarding the US/China trade war, as well as the EIA reporting as crude inventories build, weighed on price. The EIA reported that the recent seven-week run of drawdowns has come to an end. This comes at a time when the demand outlook is once again under concerns given the increased tensions between the US and China. Crude trades 52.86 last.

Commodity Currencies Climbing Back

USDCAD has seen a firm pull back from the highs printed earlier in the week above 1.33. USDCAD trades 1.3226 last, with price sitting just above the 1.3207 level for now. The recovery in oil prices, along with subdued USD action, has helped CAD recover somewhat. Later today we have the Canadian unemployment rate which is expected to remain at 5.5% over July.

AUDUSD has continued its recovery on Friday with price trading .6803 last, up from the lows printed around .6676 earlier in the week. The RBA held rates unchanged this week though RBA Governor Lowe said later in the week that further rate cuts could be likely. This is in line with the bank’s quarterly statement on monetary policy in which it cut its growth forecasts and pushed out its inflation horizon.

By Orbex


Canadian July Employment

By Orbex

It has been an eventful week for Canada, and Friday is not going to be an exception!

There is a host of data coming out, but the most important will be the employment figures. With the BOC being the odd one out when it comes to easing among central banks, this data could be extra interesting.

After the rush towards safe havens at the beginning of the week, and considering the less than auspicious world economic environment, Canada is standing out. During the last global recession, they managed to weather the economic storm quite well.

And, right now, all the data points to them being able to pull off a do-over!

What We Are Looking For

Most of the Canadian data comes out at the same time. So we could expect to see some volatility in CAD pairs as the market digests all the data. Only the CMHC Housing Starts comes out a little early but that generally doesn’t move the forex market. The focus is likely to be on the employment change numbers, followed by the unemployment rate.

The consensus among analysts is that Canada will have added 40K jobs last month, a jump up from the -2.2K prior. This would follow the pattern lately where a smaller number is immediately offset by a larger number the next month. The average since the middle of last year has been around the 50K figure, so this is actually on the lower end of the expected range.

The Trends

Canada is well within the range of what most economists consider structural unemployment. The downward trend has had difficulty getting below the 5.5 range, which would be expected in that scenario.

In fact, the consensus among analysts is that the July unemployment rate was 5.4%. This is a return to May’s extraordinary low rate (you’d have to go back to the mid-’70s to find a lower unemployment rate).

That has kept healthy pressure on the inflation rate, keeping it well within the BOC’s target. Since the end of last year, average hourly earnings have been consistently rising, a testament to the tightness in the labor market. In fact, many analysts pointed out that last month’s disappointing job adds figure was due more to a lack of finding employees than to a lack of job creation.

Going Forward

Something that could disrupt the employment market, however, is the implementation of new rules and hiring practices set to go into effect on September 1st. There is always a certain level of uncertainty in any regulatory change, and there is a possibility that employers might hold off on new hires until the practical effects of the changes to the Labour Code are seen.

Canada has been benefitting from higher prices in crude. It has even managed two consecutive months of trade surplus despite the ongoing world tensions on that front. This makes it attractive as a commodity currency in a flight to yield scenario, as most major central banks look to cut rates. In fact, if the general trend in CPI that we’ve seen since the beginning of the year holds, the BOC might find themselves in a position to need to hike rates.

By Orbex


Forex Technical Analysis & Forecast 09.08.2019 (EURUSD, GBPUSD, USDCHF, USDJPY, AUDUSD, USDRUB, GOLD, BRENT)

Article By RoboForex.com

EURUSD, “Euro vs US Dollar”

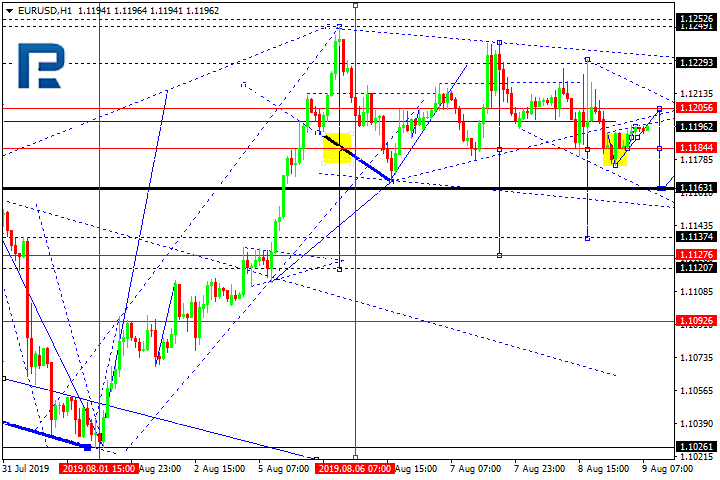
EURUSD is moving upwards. Possibly, today the pair may be corrected to reach 1.1200 and then start another decline to break 1.1160. Later, the market may continue trading downwards with the short-term target at 1.1127.

EURUSD
Risk Warning: the result of previous trading operations do not guarantee the same results in the future

GBPUSD, “Great Britain Pound vs US Dollar”

GBPUSD has completed another descending structure at 1.2100 along with the correction at 1.2155; right now, it is consolidating below the latter level. Possibly, the pair may form one more descending structure towards 1.2080 and then resume trading upwards with the target at 1.2200.

GBPUSD
Risk Warning: the result of previous trading operations do not guarantee the same results in the future

USDCHF, “US Dollar vs Swiss Franc”

USDCHF has finished the ascending impulse at 0.9785; right now, it is being corrected. Later, the market may resume moving upwards to reach 0.9770. In fact, the pair is forming Triangle pattern. According to the main scenario, the price is expected to break the pattern to the upside and grow with the target at 0.9890.

USDCHF
Risk Warning: the result of previous trading operations do not guarantee the same results in the future

USDJPY, “US Dollar vs Japanese Yen”

USDJPY is consolidating around 106.27. Today, the pair may grow to break 106.30 and then continue moving upwards with the target at 107.12.

USDJPY
Risk Warning: the result of previous trading operations do not guarantee the same results in the future

AUDUSD, “Australian Dollar vs US Dollar”

AUDUSD is moving upwards. Possibly, the pair may reach 0.6830 and then form a new descending structure towards 0.6767. After that, the instrument may start another growth with the target at 0.6898.

AUDUSD
Risk Warning: the result of previous trading operations do not guarantee the same results in the future

USDRUB, “US Dollar vs Russian Ruble”

USDRUB is still consolidating below 65.32. Possibly, today the pair may fall to break 64.94 and then continue trading downwards to reach 63.93. However, if the price breaks 65.35 to the upside, the instrument may resume growing with the target at 65.80.

USDRUB
Risk Warning: the result of previous trading operations do not guarantee the same results in the future

XAUUSD, “Gold vs US Dollar”

Gold is moving upwards. Possibly, the pair may grow to reach 1516.30 (an alternative scenario). The main scenario implies that the price may start a new decline with the target at 1486.60.

GOLD
Risk Warning: the result of previous trading operations do not guarantee the same results in the future

BRENT

Brent has completed the ascending impulse along with the correction towards 56.80. Possibly, the pair may fall to reach 56.65 and then grow to break 58.44. After that, the instrument may continue trading upwards with the first target at 61.00.

BRENT

Article By RoboForex.com

Attention!
Forecasts presented in this section only reflect the author’s private opinion and should not be considered as guidance for trading. RoboForex LP bears no responsibility for trading results based on trading recommendations described in these analytical reviews.

Investors to move assets out of UK as economy ‘stumbles towards abyss’

By George Prior

A growing number of UK and global investors will move their assets overseas as Britain stumbles towards an economic abyss, affirms the boss of one of the world’s largest independent financial advisory organizations.

The observation from Nigel Green, founder and chief executive of deVere Group, which has $12bn under advisement, comes as it is revealed that the UK economy shrank in the second quarter – the first time in seven years.

Mr Green notes: “Sterling has taken another pounding after the UK’s economy was shown to have contracted in the second quarter, adding to the economic woes on top of no-deal Brexit concerns.

“The pound has fallen more than 4.5 per cent against the dollar in July and August over fears Boris Johnson’s government is pushing the country towards a no-deal Brexit –which most economists think would be economically damaging.

“Should the UK leave with no-deal, the pound is likely to remain weak for several years until the country and the EU readjusts.”

He continues: “There is growing speculation too that there will be a general election in the autumn and this will add to the uncertainty for the pound and Britain’s economy.

“The situation will get even more serious should a Jeremy Corbyn-led Labour government win that election.  His high tax and low-profit policies and anti-business rhetoric would deliver a hammer blow to the already floundering economy.”

Mr Green goes on to say: “Depressingly, Britain appears to be stumbling towards an economic abyss.

“UK and global investors will be becoming increasing nervous of this deteriorating situation.  They will, inevitably and quite sensibly be looking to grow and safeguard their wealth by moving assets overseas through various established international financial solutions.

“The pace of this trend is likely to increase over the next few months as the geopolitical issues intensify.”

About:

deVere Group is one of the world’s largest independent advisors of specialist global financial solutions to international, local mass affluent, and high-net-worth clients.  It has a network of more than 70 offices across the world, over 80,000 clients and $12bn under advisement.


Fibonacci Retracements Analysis 09.08.2019 (BITCOIN, ETHEREUM)

Article By RoboForex.com

BTCUSD, “Bitcoin vs US Dollar”

As we can see in the daily chart, after reaching 38.2% fibo, BTCUSD is forming a new rising impulse. If the price returns to 23.6% fibo, it may continue growing to reach the high at 13857.20. The next descending wave will move towards 50.0% and 61.8% fibo at 8600.00 and 7350.00 respectively.

BTCUSD
Risk Warning: the result of previous trading operations do not guarantee the same results in the future

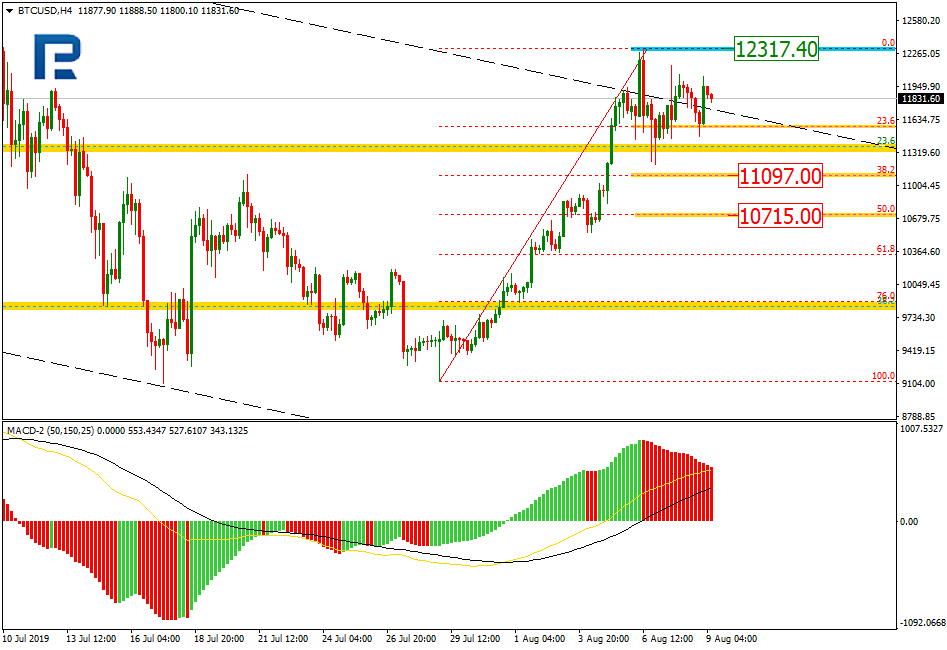
In the H4 chart, the pair is being corrected to the downside and has already reached 23.6% fibo. The next targets may be 38.2% and 50.0% fibo at 11097.00 and 10715.00 respectively. The resistance is the high at 12317.40.

BITCOIN
Risk Warning: the result of previous trading operations do not guarantee the same results in the future

ETHUSD, “Ethereum vs. US Dollar”

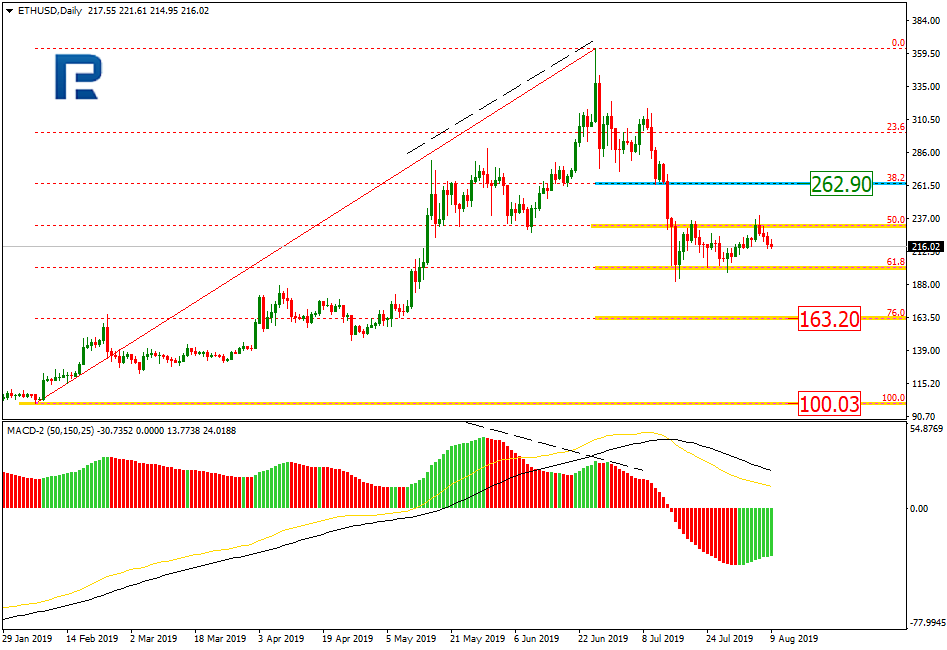
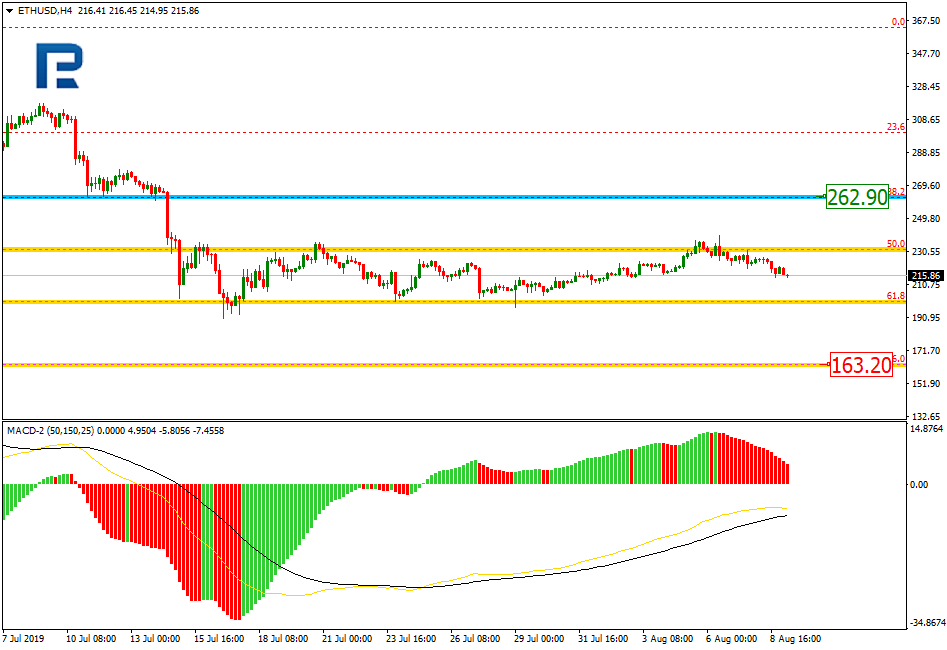
As we can see in the daily chart, ETHUSD is still being corrected between 50.0% and 61.8% fibo. After completing the correction, the pair may fall towards 76.0% fibo at 163.20. The resistance is 38.2% fibo at 262.90.

ETHEREUM
Risk Warning: the result of previous trading operations do not guarantee the same results in the future

The H4 chart shows more detailed structure of the current correction.

ETHUSD

Article By RoboForex.com

Attention!
Forecasts presented in this section only reflect the author’s private opinion and should not be considered as guidance for trading. RoboForex LP bears no responsibility for trading results based on trading recommendations described in these analytical reviews.

The Analytical Overview of the Main Currency Pairs on 2019.08.09

by JustForex

The EUR/USD currency pair

Technical indicators of the currency pair:
  • Prev Open: 1.11984
  • Open: 1.11795
  • % chg. over the last day: -0.12
  • Day’s range: 1.11782 – 1.11981
  • 52 wk range: 1.1034 – 1.1817

The EUR/USD currency pair continues to consolidate. There is no defined trend. Investors are still expecting additional drivers. At the moment, the local support and resistance levels are 1.11800 and 1.12150. The single currency has the potential for further recovery. Today we expect important economic reports from the USA. We recommend opening from key levels.

At 15:30 (GMT+3:00), the manufacturer’s price index in the United States will be published.

EUR/USD

The indicators do not give accurate signals, the price crossed 50 MA and 100 MA.

The MACD histogram is close to 0.

The Stochastic Oscillator has started to leave the overbought zone, the %K line is below the %D line, which indicates a bearish sentiment.

Trading recommendations
  • Support levels: 1.11800, 1.11600, 1.11150
  • Resistance levels: 1.12150, 1.12450, 1.12800

If the price consolidates above 1.12150, expect further growth toward 1.12450-1.12600.

Alternatively, the quotes could decrease toward 1.11500-1.11400.

The GBP/USD currency pair

Technical indicators of the currency pair:
  • Prev Open: 1.21678
  • Open: 1.21400
  • % chg. over the last day: -0.23
  • Day’s range: 1.21369 – 1.21749
  • 52 wk range: 1.2080 – 1.3385

The GBP/USD currency pair continues to trade in a protracted flat. There is no defined trend. GBP tests the local support and resistance levels: 1.21300 and 1.21850. Market participants are waiting for new information on the Brexit issue. In the near future, technical correction of the trading instrument is highly possible. You should open positions from the key levels.

The Economic News Feed for 09.08.2019 is not planned.

  • – Economic Event (GB) – 00:00 (GMT+3:00);
  • – Economic Event (GB) – 00:00 (GMT+3:00);
  • – Economic Event (GB) – 00:00 (GMT+3:00);
GBP/USD

The indicators do not give accurate signals, the price crossed 50 MA and 100 MA.

The MACD histogram is close to 0.

The Stochastic Oscillator is in the neutral zone, the %K line is below the %D line, which indicates a bearish sentiment.

Trading recommendations
  • Support levels: 1.21300, 1.20850, 1.20500
  • Resistance levels: 1.21850, 1.22500, 1.23000

If the price consolidates above 1.21850, expect further recovery toward 1.22300-1.22500.

Alternatively, the price could reduce toward 1.20900-1.20700.

The USD/CAD currency pair

Technical indicators of the currency pair:
  • Prev Open: 1.32756
  • Open: 1.33038
  • % chg. over the last day: +0.26
  • Day’s range: 1.32720 – 1.33140
  • 52 wk range: 1.2727 – 1.3664

The USD/CAD currency pair stabilized after a rather protracted rally. CAD is currently consolidating. The local support and resistance levels are 1.32650 and 1.33100. Support for the Canadian dollar is enforced by a positive report on business activity from Ivey. We recommend paying attention to the dynamics of oil quotes. Positions must be opened from key levels.

The Economic News Feed for 09.08.2019 is calm.

USD/CAD

Indicators do not give accurate signals: the price is consolidating near 50 MA.

The MACD histogram is located close to 0.

Stochastic Oscillator is near the oversold zone, the %K line crossed the %D line. There are no signals at the moment.

Trading recommendations
  • Support levels: 1.32650, 1.32400, 1.32000
  • Resistance levels: 1.33100, 1.33400

If the price consolidates above 1.33100, expect further growth 1.33400-1.33600.

Alternatively, the price could drop toward 1.32400-1.32100.

The USD/JPY currency pair

Technical indicators of the currency pair:
  • Prev Open: 106.460
  • Open: 106.260
  • % chg. over the last day: -0.35
  • Day’s range: 106.005 – 106.299
  • 52 wk range: 104.97 – 114.56

The USD/JPY currency pair is still in sideways movement. Unidirectional trends are not observed. At the moment, the trading instrument is consolidating near the round level of 106,000. The 106.550 mark is a key resistance. USD/JPY quotes have the potential for correction after a significant collapse since the beginning of the current month. We recommend that you pay attention to the dynamics of yield on the US Treasury bonds. Positions must be opened from key levels.

The Economic News Feed for 09.08.2019 is calm.

USD/JPY

Indicators do not provide accurate signals: the price crossed 50 MA and 100 MA.

The MACD histogram is close to 0.

The Stochastic Oscillator is in the neutral zone, the %K line is below the %D line, which indicates a bearish sentiment.

Trading recommendations
  • Support levels: 106.000, 105.550
  • Resistance levels: 106.550, 107.100, 107.500

If the price consolidates above 106.550, expect a correction toward 107.000.

Alternatively, the price could decrease toward 105.600-105.400.

by JustForex

Trade war escalates, Gold reaches 1,500 USD – Long trigger around 1,440/450 USD?

By Admiral Markets

Source: Economic Events August 9, 2019 – Admiral Markets’ Forex Calendar

The next wave of escalation in the trade dispute between the US and China resulted in a squeeze higher in Gold reaching 1,500 USD.

After the somewhat “hawkish” comments from Fed chairman Powell last week on Wednesday (delivering “only” a 25 basis point rate cut and making further easing steps mainly dependent on global economic developments), the newest attacks from US president Trump via Twitter, labelling China a currency manipulator after China allowed the Yuan Renminbi to weaken past the psychologically important line of 7.00 per USD, were the main driver for the precious metal higher.

Technically, the mode in Gold seems a little extended. That said from a risk-reward perspective, a pullback against 1,440/450 USD seems to be an attractive long-trigger, especially since from Monday August 12 through September 5, a bullish seasonal window opens in Gold.

On a daily time frame the mode in Gold can be considered bullish as long as we trade above 1,380 USD:

Source: Admiral Markets MT5 with MT5-SE Add-on Gold Daily chart (between May 10, 2018, to August 8, 2019). Accessed: August 8, 2019, at 10:00pm GMT – Please note: Past performance is not a reliable indicator of future results, or future performance.

In 2014, the value of Gold fell by 1.7%, in 2015, it fell by 10.4%, in 2016, it increased by 8.1%, in 2017, it increased by 13.1%, in 2018, it fell by 1.6%, meaning that after five years, it was up by 6.4%.

Discover the world’s #1 multi-asset platform

Admiral Markets offers professional traders the ability to trade with a custom, upgraded version of MetaTrader 5, allowing you to experience trading at a significantly higher, more rewarding level. Experience benefits such as the addition of the Market Heat Map, so you can compare various currency pairs to see which ones might be lucrative investments, access real-time trading data, and so much more. Click the banner below to start your FREE download of MT5 Supreme Edition!

Download MetaTrader 5 and begin trading today!

Disclaimer: The given data provides additional information regarding all analysis, estimates, prognosis, forecasts or other similar assessments or information (hereinafter “Analysis”) published on the website of Admiral Markets. Before making any investment decisions please pay close attention to the following:

  1. This is a marketing communication. The analysis is published for informative purposes only and are in no way to be construed as investment advice or recommendation. It has not been prepared in accordance with legal requirements designed to promote the independence of investment research, and that it is not subject to any prohibition on dealing ahead of the dissemination of investment research.
  2. Any investment decision is made by each client alone whereas Admiral Markets shall not be responsible for any loss or damage arising from any such decision, whether or not based on the Analysis.
  3. Each of the Analysis is prepared by an independent analyst (Jens Klatt, Professional Trader and Analyst, hereinafter “Author”) based on the Author’s personal estimations.
  4. To ensure that the interests of the clients would be protected and objectivity of the Analysis would not be damaged Admiral Markets has established relevant internal procedures for prevention and management of conflicts of interest.
  5. Whilst every reasonable effort is taken to ensure that all sources of the Analysis are reliable and that all information is presented, as much as possible, in an understandable, timely, precise and complete manner, Admiral Markets does not guarantee the accuracy or completeness of any information contained within the Analysis. The presented figures refer that refer to any past performance is not a reliable indicator of future results.
  6. The contents of the Analysis should not be construed as an express or implied promise, guarantee or implication by Admiral Markets that the client shall profit from the strategies therein or that losses in connection therewith may or shall be limited.
  7. Any kind of previous or modeled performance of financial instruments indicated within the Publication should not be construed as an express or implied promise, guarantee or implication by Admiral Markets for any future performance. The value of the financial instrument may both increase and decrease and the preservation of the asset value is not guaranteed.
  8. The projections included in the Analysis may be subject to additional fees, taxes or other charges, depending on the subject of the Publication. The price list applicable to the services provided by Admiral Markets is publicly available from the website of Admiral Markets.
  9. Leveraged products (including contracts for difference) are speculative in nature and may result in losses or profit. Before you start trading, you should make sure that you understand all the risks.

By Admiral Markets