On Thursday the 8th of August, trading on the euro closed down. The EURUSD pair remained within Wednesday’s range. Markets have stabilised for the time being following reports that the US and China are set to continue trade talks in September. Investors were also calmed by the PBOC’s statement that it has not manipulated the value of the yuan to mitigate the effects of increased tariffs from the US on Chinese goods.
Day’s news (GMT+3):
11:30 UK: GDP (Q2), industrial production (Jun), manufacturing production (Jun), trade balance (Jun).
15:15 Canada: housing starts (Jul).
15:30 Canada: unemployment rate (Jul), net change in employment (Jul), building permits (Jun).
15:30 US: PPI (Jul).
16:00 UK: NIESR GDP estimate (Jul).
20:00 US: Baker Hughes US oil rig count.
Current situation:
The bears didn’t make it to the 67th degree (1.1162) on Thursday. The drop came to an end at around 1.1180. We can’t rule out an upwards rebound here given Donald Trump’s dissatisfaction with the strong US dollar.
On Friday the 9th of August, the majors are trading slightly up against the dollar. Taking into account the pricing model that we’ve drawn based on the 1.1250 high, I’m leaning more towards a drop to the lower boundary of the B-B channel and the 67th degree. I think this needs to happen before we can get a new rally.
Investors are mostly focused on the movements of the yuan. If they start to move towards safe haven assets ahead of the weekend, we can expect the euro to rise. Judging by the indicators, we should expect a decline ahead of the US session, followed by a rise to 1.1195.
Equity markets led a strong recovery following strong declines just earlier this week. This came after investors managed to digest the developments involving the US-China trade spat.
The euro traded flat on Thursday. The common currency closed almost near the open. A lack of economic data and any major developments in regard to the US trade dispute kept the currency pair in check. However, this could change with the release of the German trade balance report.
EURUSD Could be Waiting for a Breakout
The currency pair is firmly stuck within the range of 1.1250 and 1.1188. This consolidation comes right after the euro posted strong gains since the middle of last week. As a result, we could expect to see the EURUSD aiming higher. A breakout above 1.1250 will potentially give way for 1.1340 level at the very least.
Sterling Consolidations Ahead of GDP Report
The pound sterling has been trading flat over the past few days. The Brexit narrative has taken a backseat, especially in light of the US-China trade war. UK’s PM Boris Johnson expressed confidence that European officials will be flexible in negotiating a Brexit deal. On the economic front, the quarterly GDP report, manufacturing, and industrial production numbers are on tap today.
Upside Bias is Building Up in GBPUSD
GBPUSD could be seen building an upside bias. This comes as the recent consolidation near the lows has formed a wedge pattern. A breakout to the upside from this consolidation pattern could signal further gains. The pair could be looking to correcting towards 1.2400 level at the very least. A close below 1.2126 will, of course, invalidate the upside bias.
Gold Eases from the $1500 Handle
The precious metal, tracking the market sentiment was seen easing back on Thursday. Right after testing highs of 1500, gold is currently consolidating near the highs. This could possibly see either a renewed momentum building up or perhaps an impending correction. The US producer prices index report will be the only report coming out during the NY trading session today.
Can XAUUSD Post Further Gains?
The current consolidation could see further gains in store. However, a lot will depend on whether gold can break out convincingly above the 1500 handle. Given the fact that this is a psychologically strong resistance level, we could expect to see some downside. The recently breached support area of 1431 – 1428 will be the most appropriate downside target in gold.
We’re borrowing a term from the movie Red October (source) that describes an unusual change of direction for a Russian submarine with the intent to seek out enemies and unknown targets – called a “Crazy Ivan”. We are using this term because we believe the markets are about to pull a very unusual “Crazy Ivan” move of their own – reverting to unknown price levels while the US/Global markets attempt to seek out risk, support, resistance and other unknown “revaluation” targets in the process.
Our belief is that a key cycle date, August 19, 2019, will be the start of a breakdown in the US markets that aligns with some outside type of catalyst event. It could be that foreign central banks issue some news or warning at that time or it could be that Asia/China issue some type of catalyst to the event. We don’t know what the catalyst will be but we can guess that it will be related to geopolitics or the global economy/credit/debt issues. God forbid it to be some type of war or human crisis event – we really don’t need that right now.
Please review these earlier research posts for more information :
Our job as research analysts is to highlight what we believe is likely to happen and why we believe it is likely to happen. Therefore, without guessing as to the cause of the event, let’s focus on the “Crazy Ivan” event and how we can attempt to profit from it.
First, let’s take a look at the VIX chart. The VIX basing level (the lowest level the VIX has attained between price spikes) has been increasing as US stock market volatility continues to increase. The nature of the calculations that make up the VIX would suggest this increase in basing levels would happen as extended volatility continues to be present in the markets – so this is expected. What is not expected is the August 19th price inflection point that we believe will drive an unexpected price reversion in the US and global stock markets. We believe this cycle inflection date is key to understanding how the markets will react going into the end of 2019 and beyond.
If our analysis is correct, then we believe a breakdown in the US and global markets will occur on or shortly after August 19, 2019, where the US stock markets are poised for a -15% to -25% price reversion. This downside move in the US stock market would set up an incredible “price anomaly” for skilled technical traders that should provide an incredible opportunity for future profits.
We believe the ultimate downside potential for this move may last all the way through the end of 2019 and into early 2020 – although we can’t be certain yet as to the depth and severity of this move using our predictive modeling tools and utilities. All we know is that it is about to happen based on what our predictive modeling tools are telling us and we have continued to try to warn you of this move for the past few months. So here it is – the Crazy Ivan (as we’re calling it).
Any VIX rally that pushes the price above 30 or 40 would have to be rather severe compared to previous rotations. The spikes on this chart related as follows on the NQ chart :
Early May VIX Spike to 23.31 resulted in a -938.25 point move (-11.91%) in the NQ
The current August VIX spike to 24.80 resulted in a -848.75 point move (-10.54%) in the NQ.
What would a move to above 32 in the VIX look like on the NQ chart? How about a move to above 42 on the VIX? Hello Crazy Ivan.
This next chart of the NQ on a monthly basis highlights our Adaptive Dynamic Learning (ADL) predictive modeling system at work. This utility helps us to understand where the price will want to target in the future and also helps us to understand trend and outlying price trends (or price anomalies). Price anomalies happen when price moves substantially away from where the ADL predictive modeling system is suggesting price wants to be at. Thus, if the price of the NQ were to fall below $5500 very quickly (think Crazy Ivan) and our ADL modeling tool suggests that price really wants to be at $6800 at that time, then we have a $3300 price anomaly setting up. This is a type of reactive price anomaly that suggests price is way off target and will attempt to revert to levels closer to the ADL predictive price levels.
We believe the Crazy Ivan event could push the price of the NQ much lower than our ADL predictive modeling system is suggesting and create a price anomaly that may become one of the most profitable trades near the end of 2019.
You can see from this ADL predictive modeling chart that price is expected to be lower near the end of 2019, but steadily climb higher into early 2020. If price were to end up below 6400 by the end of 2019, that would set up a 1000+ point price anomaly setup that could become an incredible upside price move in early 2020. Time will tell as this Crazy Ivan event plays out.
CONCLUDING THOUGHTS:
In the second part of this article, we’ll study the Crazy Ivan event in the metals and show you what we believe will happen to both Gold and Silver as this event plays out. You won’t want to miss this one.
WARNING SIGNS ABOUT GOLD, SILVER, MINERS, AND S&P 500
In early June I posted a detailed video explaining in showing the bottoming formation and gold and where to spot the breakout level, I also talked about crude oil reaching it upside target after a double bottom, and I called short term top in the SP 500 index. This was one of my premarket videos for members it gives you a good taste of what you can expect each and every morning before the Opening Bell. Watch Video Here.
I then posted a detailed report talking about where the next bull and bear markets are and how to identify them. This report focused mainly on the SP 500 index and the gold miners index. My charts compared the 2008 market top and bear market along with the 2019 market prices today. See Comparison Charts Here.
On June 26th I posted that silver was likely to pause for a week or two before it took another run up on June 26. This played out perfectly as well and silver is now head up to our first key price target of $17. See Silver Price Cycle and Analysis.
More recently on July 16th, I warned that the next financial crisis (bear market) was scary close, possibly just a couple weeks away. The charts I posted will make you really start to worry. See Scary Bear Market Setup Charts.
Confidence over the health of the UK economy was dealt a gut-wrenching blow this morning after GDP growth contracted for the first time since 2012 in the second quarter.
Economic growth fell at a quarterly rate of 0.2% in the three months to June, below the 0% market expectations amid Brexit-related uncertainty. With mounting fears over a no-deal Brexit weighing heavily on sentiment and crippling the Pound, the UK is at threat of shrinking again in the third quarter of 2019. Should Britain officially enter a recession, the Pound/Dollar parity dream may become reality.
All in all, today’s disappointing GDP figure is set to raise alarms bells over Brexit dragging the UK economy deeper into the abyss. This unfavourable scenario may prompt the Bank of England to cut interest rates sooner than anticipated, in an effort to revive the UK economy.
In the currency markets, the GBPUSD dipped just over 40 pips before clawing back some losses with prices trading around 1.2100 as of writing. While the GDP report is significant, the Pound remains more concerned with developments in Westminster and Brexit newslows.
Technical traders will continue to closely monitor how prices behave around the 1.2100. A solid weekly close under this point has the potential to trigger a decline towards 1.2000.
Disclaimer: The content in this article comprises personal opinions and should not be construed as containing personal and/or other investment advice and/or an offer of and/or solicitation for any transactions in financial instruments and/or a guarantee and/or prediction of future performance. ForexTime (FXTM), its affiliates, agents, directors, officers or employees do not guarantee the accuracy, validity, timeliness or completeness, of any information or data made available and assume no liability as to any loss arising from any investment based on the same.
In barely a week, President Trump made two great miscalculations. First, he undermined the trade talks in Shanghai. Then US Treasury declared China a currency manipulator.
The two miscalculations will prove costly not just in the US-Sino trade war but for global economic prospects.
Divisions at the White House and the Fed
At the eve of the recent trade talks in Shanghai, President Trump’s tweets undermined the meeting before it even began.
Afterwards in the Oval Office, President Trump overruled his advisers to ramp up tariffs on China. Reportedly, the decision ensued after a heated debate in which he insisted levies would force China to comply with US demands.
Except for Peter Navarro, Trump’s China-bashing trade adviser, Trump’s highest-level team adamantly objected to the tariffs. That spurred an intense debate lasting nearly two hours. Trump desperately needed secured commitments China would boost the purchases of US agricultural exports; and he saw tariffs as the best bullying tactic. Eventually, Trump’s advisers gave in and helped him to draft the tweet announcing an extension of tariffs to essentially all Chinese imports.
Soon thereafter, US Treasury Department declared China a currency manipulator and threatened to “engage with the International Monetary Fund” to stop the Chinese yuan from gaining “unfair advantage” in trade. That designation does not reflect economic realities, but political desperation, however. Neither the IMF (nor US Treasury) has expressed concerns about Chinese currency manipulation for a long while. The Chinese yuan joined the IMF’s international reserve currencies a few years ago; and more recently, China has joined vital global benchmark indices.
Conversely, in the US, the political background forces behind the recent Fed rate cut, which did weaken the US dollar, have given rise to high-level concerns about the Fed’s independence, as evidenced by the recent Wall Street Journal op-ed by former Fed chairs Paul Volcker, Ben Bernanke and Janet Yellen.
Trump’s tariffs undermine cheaper dollar and rising equities
True, the US administration desperately needs a cheaper dollar. Yet, Trump’s tariff wars and geopolitical ploys (e.g., Iran, Venezuela, new cold war against Russia) work against such goals.
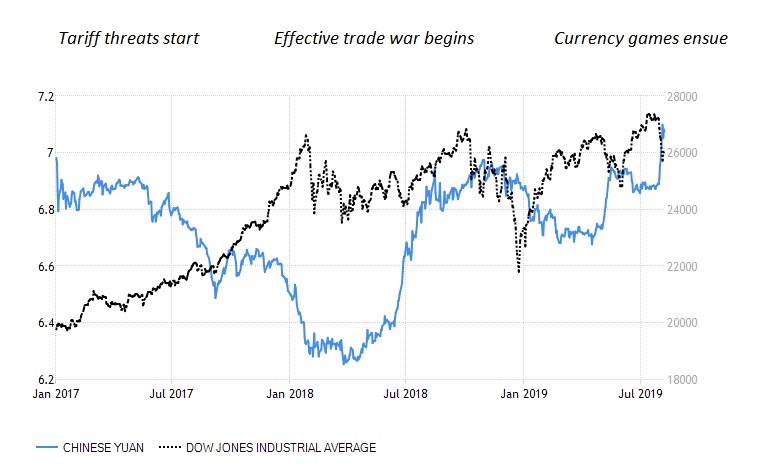
Before summer, the White House lifted tariffs to 25% from 10% on $200 billion of Chinese goods, while targeting another $300 billion worth of Chinese imports for potential punitive tariffs. Unsurprisingly, the renminbi depreciated from 6.7 to more than 6.9 against the US dollar, mainly on renewed trade tensions.
China retaliated by imposing duties on $60 billion of US goods, starting June 1. China could have retaliated harder, but opted for a mild response to keep the door open for trade talks.
Until Trump’s tariff escalation, Chinese renminbi was around 6.80 against the US dollar. But that was predicated on the idea that cooler heads would prevail in the White House and a broad-scale trade war was avoidable. When Trump opted for tariff escalation, markets reacted expectedly. By the summer, the appreciation of Chinese yuan was reversed. Things were about to get tougher.
As the collateral damage of the US tariffs began to spread in the US economy in the summer, Trump largely ignored the economic impact of the trade friction. Naively, he thought that the Fed’s rate cut (which he expected to result in new cuts over the fall) would accommodate his trade policy. Emboldened, he opted for the “more tariffs and still more tariffs” stance.
In the past few days, the market response has been dramatic, however. Following Shanghai talks and the new tariff escalation, US stocks plunged on prospects of a prolonged trade fight, and business groups warned about the impact on consumer spending.
Indeed, Trump’s tariffs have paced the renminbi fluctuations ever since the start of his trade wars (see Figure).
FigureThe interplay of Trump’s tariffs, US equities and Chinese yuan
In light of the economic realities, the US Treasury’s claim that China is depreciating the Chinese yuan is simply flawed. In fact, depreciation is what China seeks to avoid. When exports shrink, a light depreciation of the currency is of no help. And if the yuan would depreciate significantly in a short period of time, it would foster worries about capital flight.
Paradoxically, the more the Trump administration will escalate the trade wars, the more likely it is that US dollar will push the yuan closer to 7 per US dollar or beyond it, as I projected in China Daily last May. While that may impair market sentiment in China in a short-term, it is likely to cause collateral damage in the US stock market, as evidenced by recent market volatility.
The Trump administration’s yuan allegations are motivated by political objectives, not by economic realities. What President Trump needs for his domestic initiatives is a cheaper dollar and soaring equities. What his miscalculations have caused is precisely the reverse.
About the Author:
Dr. Dan Steinbock is the founder of Difference Group. He has served at India, China and America Institute (US), Shanghai Institutes for International Studies (China) and the EU Center (Singapore). For more, see https://www.differencegroup.net/
Peru’s central bank lowered its monetary policy rate for the first time in 17 months but said this did “not necessarily imply additional reductions in the policy rate” as the annual inflation rate is still expected to remain within the target range and close to 2 percent albeit with a downside bias due to a possible lower-than-expected increase in domestic demand.
The Central Reserve Bank of Peru (BCRP) cut its policy rate by 25 basis points to 2.50 percent, its first rate cut since March 2018. Between March 2017 and March last year BCRP lowered its rate by 150 basis points and the last time the rate was raised was in February 2016.
In its statement, the central bank’s board said the rate was lowered in light of inflation in July that was within its target range, one-year ahead expected inflation was 2.32 percent, primary industries showed a weak performance and non-primary industries showed slowing growth momentum while “global growth risks persist and the recent escalation in trade tensions exacerbated international financial volatility.”
Peru’s inflation rate eased to 2.11 percent in July from 2.29 percent in June but still within BCRP’s target range of 2.0 percent, plus/ minus 1 percentage point.
The Central Reserve Bank of Peru issued the following statement:
1. The Board of Directors of the Central Reserve Bank of Peru (BCRP) decided to cut the reference rate from 2.75 to 2.50 percent, thereby loosening the monetary policy stance, in light of the following developments: i. Year-on-year inflation and inflation trend indicators as of July were within the BCRP’s target range; ii. One-year ahead expected inflation as of July was 2.32 percent; iii. Primary industries show a weak performance as a result of temporary supply shocks, while non-primary industries show slowing growth momentum. The slowdown in public investment in January-July is expected to revert in the remainder of the year; and iv. Global growth risks persist and the recent escalation in trade tensions exacerbated international financial volatility.
2. This decision does not necessarily imply additional reductions in the policy rate. The BCRP Board pays close attention to new information on inflation and its determinants in assessing future changes in the monetary policy stance. Year-on-year inflation is expected to remain within the target range close to 2.0 percent over the forecast horizon, with a downside bias due to the possibility of a lower-than-expected increase in domestic demand. 3. According to recent inflation and economic activity indicators: i. Monthly inflation was 0.20 percent in July, bringing down year-on-year inflation to 2.11 percent, from 2.29 percent in June. With monthly inflation excluding food and energy at 0.12 percent in July, the year-on-year figure decreased to 2.15 percent, from 2.30 percent in June. ii. Business conditions expectations continued its moderation in July. Non-primary activity indicators continue to point to a more gradual closure of the output gap.
4. The Board also decided to reduce the interest rates on BCRP off-auction credit and deposit operations in domestic currency with financial entities. i. Overnight deposits: 1.25 percent per year. ii. Direct security/currency repo and rediscount operations: i) 3.05 percent per year for financial entities’ first 10 operations over the last 12 months; and ii) the rate fixed by the BCRP Monetary and Foreign Exchange Operations Committee for operations other than financial entities’ first 10 operations over the last 12 months. iii. Dollar swaps: a fee equal to a minimum annual effective cost of 3.05 percent.
5. The BCRP Board’s next monetary policy session will take place on September 12, 2019″
The US dollar strengthened slightly against a basket of major currencies. Yesterday, the US dollar index (#DX) closed the trading session in the positive zone (+0.09%). So far, there has been no news regarding the trade war between the United States and China. Financial market participants expect additional drivers.
The Chinese yuan has strengthened after the publication of optimistic economic data. So, yesterday, reports on the volume of exports and imports were published in China. Thus, the volume of exports grew by 3.3% in July, while experts forecasted a decrease by 2.0%. The volume of imports fell by only 5.6% in June instead of 8.3%. Today, China’s consumer price index (y/y) has been published during the Asian trading session, which has risen by 2.8% instead of 2.7%. All these data improved investors’ sentiment and made it clear that the market situation was not as bad as it seemed.
Also, during the Asian trading session, positive data on Japan’s GDP have been published. Thus, GDP (y/y) grew by 1.8% in the second quarter instead of 0.4%. GDP (q/q) increased by 0.4% in the second quarter, while experts forecasted growth by 0.2%.
The “black gold” prices have moved away from the lows for seven months after Saudi Arabia said it did not intend to put up with such a reduction in prices. Currently, futures for the WTI crude oil are testing the $52.80 mark per barrel.
Market Indicators
Yesterday, aggressive purchases were observed in the US stock markets: #SPY (+1.96%), #DIA (+1.49%), #QQQ (+2.18%).
The 10-year US government bonds yield won back part of the losses. At the moment, the indicator is at the level of 1.71-1.72%.
The news feed for 2019.08.09:
– UK GDP data at 11:30 (GMT+3:00); – UK manufacturing production at 11:30 (GMT+3:00); – US producer price index at 15:30 (GMT+3:00); – Report on the labor market in Canada at 15:30 (GMT+3:00).
Asian stocks are mixed despite the stronger close for US equities, as markets limp towards the weekend. The recent flare-up in US-China tensions continues to weigh on the collective mind, as investors hunker down for what is feared to be a long, drawn-out dispute between the world’s two economic powerhouses.
At this point in time, it’s hard to see either the US or China having enough will to resolve their differences, much less before the new US tariffs on Chinese goods kick in on September 1. Should the barriers to global trade be raised next month, that would be another kick in the gut for risk appetite and may prompt another selloff in risk assets.
Gold garners more suitors, given scarcity of viable alternatives
Gold is a clear winner from the elevated concerns surrounding the global economy, with Bullion remaining above the psychologically important $1500 level, near its highest levels since 2013. Gold is garnering more and more suitors as investors have scarce viable alternatives in a global landscape that’s plagued by risk aversion. Although some segments of the market will test every opportunity to wade further out into risk-on territory, the long shadow cast by the ongoing US-China conflict should ensure that Gold can hang on to most of its 2019 gains, with the $1450 level serving as the stronger support level below $1500.
Euro’s August gains may prove fleeting
The Euro has managed to drag itself back up by 1.1 percent against the US dollar so far this month, with EURUSD hovering mostly around 1.12 in recent days. However, such gains may prove fleeting, as rising political tensions in Italy threaten to exacerbate the Euro’s outlook.
Political turmoil in Italy would add another layer of risk to the Euro, with investors already contending with the ill-effects from Brexit uncertainties as well as the protracted US-China trade conflict. Should the Federal Reserve pour cold water on markets that are clamoring for more US interest rate cuts over the course of the year, any Dollar resurgence is set to cost the Euro, with scant upside catalysts evident for the bloc’s currency in the immediate future.
Brent wallows in bear market, bogged down by demand-side uncertainties
Having fallen into a bear market, Brent futures are struggling to create a sustained lift-off from its 7-month lows, currently trading around $57/bbl. With the US-China standoff still a drag on global demand for Oil, investors are questioning what else OPEC+ producers can do to stem the price declines.
Despite the pledged supply cuts by OPEC+ through March 2020, major Oil producers may be called into action again soon with more supply cuts. Even then, with US shale output still resilient, coupled with the demand-side erosion due to the heightened barriers to global trade, it’s getting tougher for Oil to swim against the bearish tide. Present market forces only serve to reinforce the notion that Oil prices will remain at the mercy of the protracted US-China conflict.
Disclaimer: The content in this article comprises personal opinions and should not be construed as containing personal and/or other investment advice and/or an offer of and/or solicitation for any transactions in financial instruments and/or a guarantee and/or prediction of future performance. ForexTime (FXTM), its affiliates, agents, directors, officers or employees do not guarantee the accuracy, validity, timeliness or completeness, of any information or data made available and assume no liability as to any loss arising from any investment based on the same.
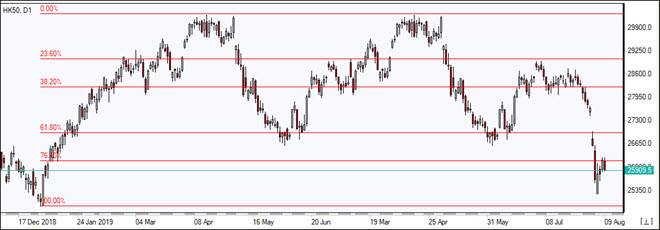
US stock indexes rebounded on Thursday as the People’s Bank of China set the yuan’s reference rate at 7.0039 against one US dollar. The S&P 500 rose 1.9% to 2938.72. The Dow Jones industrial average recovered 1.4% to 26378.19. Nasdaq composite index rallied 2.2% to 8039.16. The dollar weakening resumed despite an 8000 drop in initial jobless claims in the previous week: the live dollar index data show the ICE US Dollar index, a measure of the dollar’s strength against a basket of six rival currencies, slipped 0.1% to 97.54 but is higher currently. Stock index futures point to lower market openings today
CAC 40 leads European indexes advance
European stocks broadened recovery on Thursday as bond yields stabilized. Both EUR/USD and GBP/USD continued declining and move in previous session’s directions currently. The Stoxx Europe 600 index ended 1.4% higher led by resources shares. Germany’s DAX 30 gained 1.7% to 11845.41. France’s CAC 40 rallied 2.3% and UK’s FTSE 100 advanced 1.2% to 7285.9.
Nikkei leads Asian indexes gains while Chinese stocks slide
Asian stock indices are mixed today amid reports Trump administration was holding off on approving licenses for US companies to resume doing business with China’s blacklisted Huawei. Nikkei rose 0.4% to 20684.82 as yen resumed its slide against the dollar despite faster than expected Q2 GDP growth. Chinese shares are falling as data showed inflation hit 17-month high of 2.8% in July: the Shanghai Composite Index is down 0.7% and Hong Kong’s Hang Seng Index is 0.5% lower. Australia’s All Ordinaries Index added 0.3% to previous session gains as Australian dollar slowed its climb against the greenback.
Brent futures prices are little changed today underpinned by expectations of more OPEC production cuts. Prices rose yesterday: October Brent crude rose 2% to $57.38 a barrel on Thursday.
Note: This overview has an informative and tutorial character and is published for free. All the data, included in the overview, are received from public sources, recognized as more or less reliable. Moreover, there is no guarantee that the indicated information is full and precise. Overviews are not updated. The whole information in each overview, including opinion, indicators, charts and anything else, is provided only for familiarization purposes and is not financial advice or а recommendation. The whole text and its any part, as well as the charts cannot be considered as an offer to make a deal with any asset. IFC Markets and its employees under any circumstances are not liable for any action taken by someone else during or after reading the overview.
When the deal is completed, probably later this month, Terraco shareholders will receive an appropriate quantity of Sailfish shares in place of their current holdings, and the company will trade under the Sailfish name. In addition, Terraco shareholders will have the advantage that they will have a stake in a company with a more diverse range of assets and less risk.
The reason for this update, in addition to commenting on the merger, is to point out that, even though the merger is imminent, there appears to be more immediate mileage in Terraco shares, which from their current position could quickly tack on another $0.04 or so, perhaps more, before the merger is completed. This makes them of immediate interest to speculators.
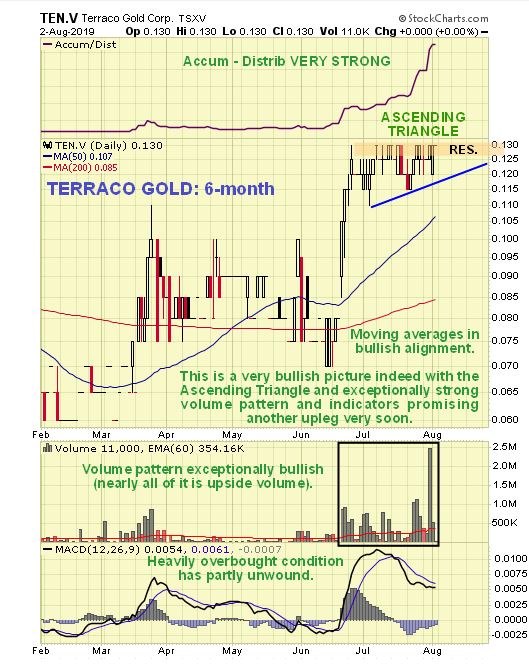
On the latest 6-month chart for Terraco we can see how it spiked to $0.13 in June on news of the merger, and has since run off sideways in an increasingly tight consolidation patterna bullish ascending triangle that has allowed its earlier overbought condition to unwind. This triangular pattern has been accompanied by an exceptionally bullish volume patternalmost all volume was upside volumeand very strong volume indicators (on-balance volume is not shown). The volume buildup of recent days a sign that it is about to break higher again, and even without any knowledge of the fundamentals, this chart suggests an imminent $0.04 to $0.05 hike in the share price, which would result in a good percentage gain from here.
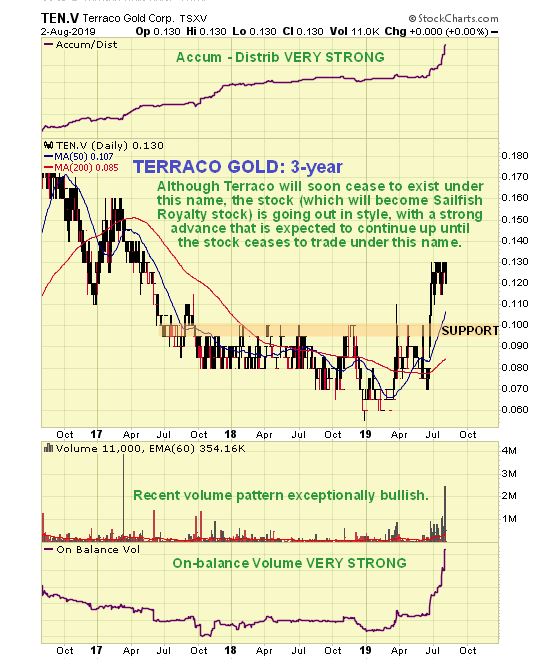
The 3-year chart shows recent action in the context of what came before, and this chart makes clear that there is potential for significant further upside before the transaction is completed. This chart also shows the very strong on-balance volume indicator.
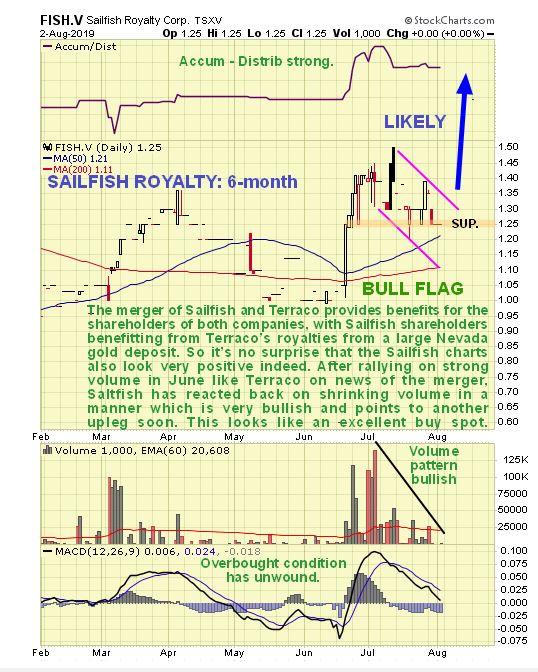
If the merger is beneficial to both companies, then it follows that the charts for Sailfish should look positive too, and as we will now see, they do. The 6-month chart for Sailfish shows that both its moving averages swung into bullish alignment as a result of the initial surge on the June announcement of the merger. After this sharp rally it reacted back in a leisurely manner during July, with volume dying right back, which is bullish. The pattern that has formed looks like a smallish bull flag, and the current very light volume, both in this and Terraco, suggests that another up-leg is imminentalthough it might be a week or two before it occurs on more definite news regarding the finalization of the merger.
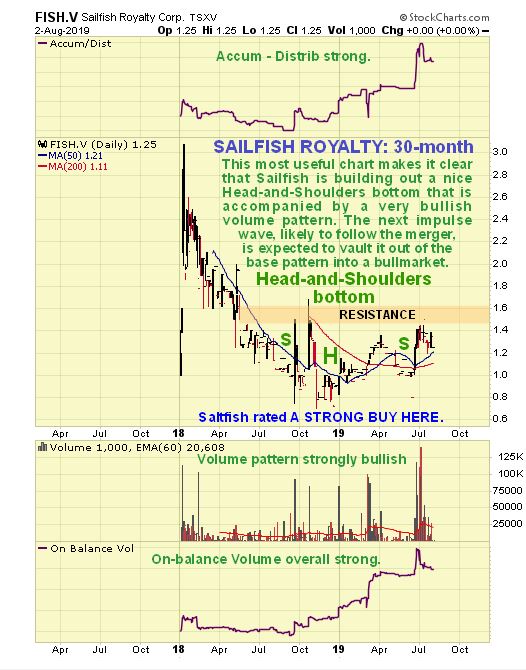
The 30-month chart is most useful as it shows us what is really going on. On this chart, we see that after spiking to just above CA$3.00 right after coming to market at the start of last year, it collapsed back in a long and stubborn downtrend that took it all the way back down to hit a low at CA$0.70 last November. But it is only in retrospect that we see that it actually started the base-building process as long ago as May of last year, because that’s when it started to mark out the left shoulder of what we can now see is a head-and-shoulders bottom pattern. The volume pattern and exceptionally positive volume indicators powerfully support the contention that it is marking out a genuine base pattern. If it is, then it is clear that we are at a excellent entry point here, with the price getting ready to break out after its minor reaction of the past month or so.
Once it succeeds in breaking out of the resistance shown at the upper boundary of the pattern, it is likely to accelerate, possibly dramatically, especially given the rapid improvement in gold’s fortunes. We therefore have no choice but to rate Sailfish an immediate strong buy here, in addition to the same rating for Terraco.
Terraco Gold website Terraco Gold Corp. closed at CA$0.13, $0.098, on 2 August.
Sailfish Royalty Corp. website Sailfish Royalty Corp. closed at CA$1.25 on 2 August, trading at $0.96 at 11:13 a.m. on 5 August (Canadian market closed). There are 38.4 million shares in issue and according to Yahoo Finance, of these, only 8.5 million are freely trading. If this is true then it will increase price sensitivity to increased demand. The stock trades in generally light volumes on the U.S. OTC market, but this is expected to improve.
Originally posted on CliveMaund.com at 6.40 a.m. EDT on 5 August 2019; Sailfish added at 12.15 p.m. EDT.
Clive Maund has been president of www.clivemaund.com, a successful resource sector website, since its inception in 2003. He has 30 years’ experience in technical analysis and has worked for banks, commodity brokers and stockbrokers in the City of London. He holds a Diploma in Technical Analysis from the UK Society of Technical Analysts.
Disclosure: 1) Clive Maund: I, or members of my immediate household or family, own shares of the following companies mentioned in this article: None. I personally am, or members of my immediate household or family are, paid by the following companies mentioned in this article: None. My company has a financial relationship with the following companies mentioned in this article: None. CliveMaund.com disclosures below. I determined which companies would be included in this article based on my research and understanding of the sector. 2) The following companies mentioned in this article are billboard sponsors of Streetwise Reports: Terraco Gold. Click here for important disclosures about sponsor fees. 3) Statements and opinions expressed are the opinions of the author and not of Streetwise Reports or its officers. The author is wholly responsible for the validity of the statements. The author was not paid by Streetwise Reports for this article. Streetwise Reports was not paid by the author to publish or syndicate this article. The information provided above is for informational purposes only and is not a recommendation to buy or sell any security. Streetwise Reports requires contributing authors to disclose any shareholdings in, or economic relationships with, companies that they write about. Streetwise Reports relies upon the authors to accurately provide this information and Streetwise Reports has no means of verifying its accuracy. 4) This article does not constitute investment advice. Each reader is encouraged to consult with his or her individual financial professional and any action a reader takes as a result of information presented here is his or her own responsibility. By opening this page, each reader accepts and agrees to Streetwise Reports’ terms of use and full legal disclaimer. This article is not a solicitation for investment. Streetwise Reports does not render general or specific investment advice and the information on Streetwise Reports should not be considered a recommendation to buy or sell any security. Streetwise Reports does not endorse or recommend the business, products, services or securities of any company mentioned on Streetwise Reports. 5) From time to time, Streetwise Reports LLC and its directors, officers, employees or members of their families, as well as persons interviewed for articles and interviews on the site, may have a long or short position in securities mentioned. Directors, officers, employees or members of their immediate families are prohibited from making purchases and/or sales of those securities in the open market or otherwise from the time of the interview or the decision to write an article until three business days after the publication of the interview or article. The foregoing prohibition does not apply to articles that in substance only restate previously published company releases. As of the date of this article, officers and/or employees of Streetwise Reports (including members of their household) own securities of Terraco Gold, a company mentioned in this article.
Charts provided by the author.
CliveMaund.com Disclosure: The above represents the opinion and analysis of Mr Maund, based on data available to him, at the time of writing. Mr. Maund’s opinions are his own, and are not a recommendation or an offer to buy or sell securities. Mr. Maund is an independent analyst who receives no compensation of any kind from any groups, individuals or corporations mentioned in his reports. As trading and investing in any financial markets may involve serious risk of loss, Mr. Maund recommends that you consult with a qualified investment advisor, one licensed by appropriate regulatory agencies in your legal jurisdiction and do your own due diligence and research when making any kind of a transaction with financial ramifications. Although a qualified and experienced stock market analyst, Clive Maund is not a Registered Securities Advisor. Therefore Mr. Maund’s opinions on the market and stocks can only be construed as a solicitation to buy and sell securities when they are subject to the prior approval and endorsement of a Registered Securities Advisor operating in accordance with the appropriate regulations in your area of jurisdiction.
 Current situation: