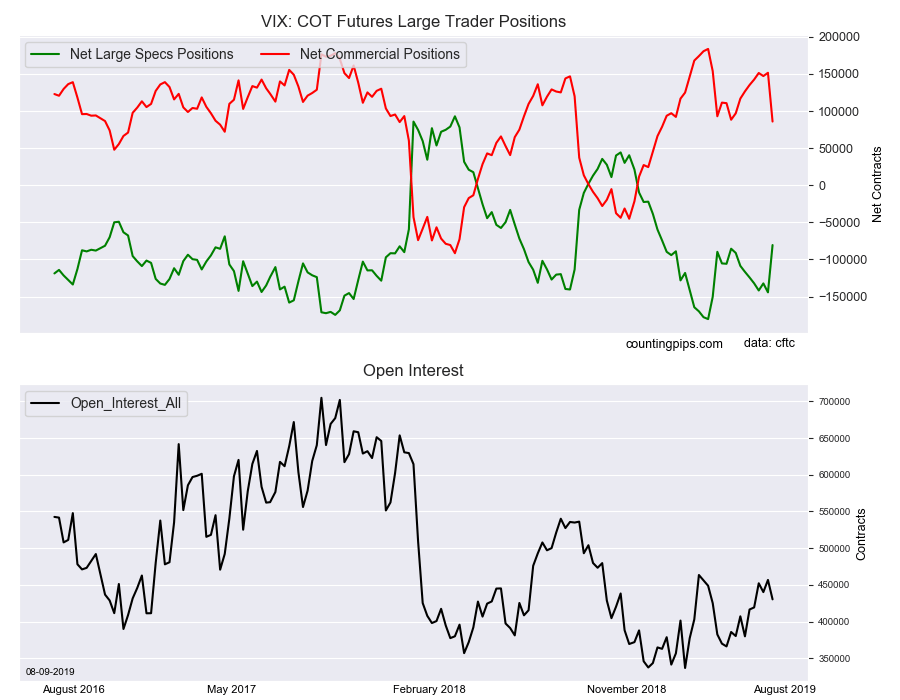
Large volatility speculators sharply pared their bearish net positions in the VIX futures markets this week, according to the latest Commitment of Traders (COT) data released by the Commodity Futures Trading Commission (CFTC) on Friday.
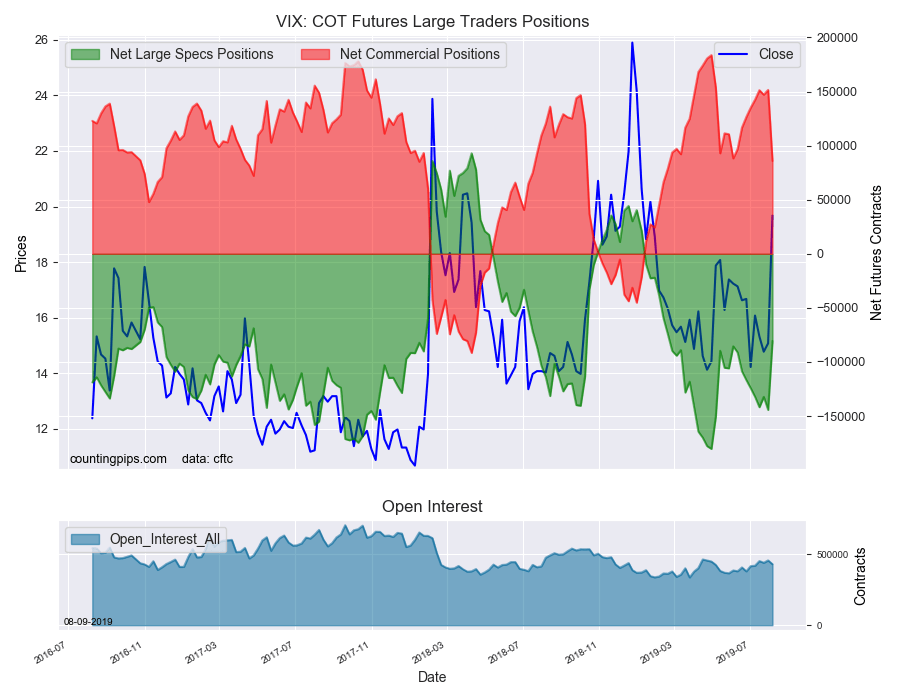
The non-commercial futures contracts of VIX futures, traded by large speculators and hedge funds, totaled a net position of -80,581 contracts in the data reported through Tuesday August 6th. This was a weekly change of 63,733 net contracts from the previous week which had a total of -144,314 net contracts.
The week’s net position was the result of the gross bullish position (longs) growing by 30,113 contracts (to a weekly total of 146,824 contracts) which combined with the gross bearish position (shorts) that decreased by -33,620 contracts for the week (to a total of 227,405 contracts).
The VIX speculators position is of the Tuesday close and coincides with the volatility and risk-off sentiment of the beginning of the week (stocks down, safe havens up). The speculative bearish position had been grinding consistently higher and gaining for the previous nine of out eleven weeks before this week’s sharp turnaround. The current standing is now back down to it’s least bearish level since February.
VIX Commercial Positions:
The commercial traders position, hedgers or traders engaged in buying and selling for business purposes, totaled a net position of 85,853 contracts on the week. This was a weekly drop of -65,717 contracts from the total net of 151,570 contracts reported the previous week.
VIX Futures:
Over the same weekly reporting time-frame, from Tuesday to Tuesday, the VIX Futures (Front Month) closed at approximately 19.67 which was a gain of 4.60 from the previous close of 15.07, according to unofficial market data.
*COT Report: The COT data, released weekly to the public each Friday, is updated through the most recent Tuesday (data is 3 days old) and shows a quick view of how large speculators or non-commercials (for-profit traders) as well as the commercial traders (hedgers & traders for business purposes) were positioned in the futures markets.
The CFTC categorizes trader positions according to commercial hedgers (traders who use futures contracts for hedging as part of the business), non-commercials (large traders who speculate to realize trading profits) and nonreportable traders (usually small traders/speculators).
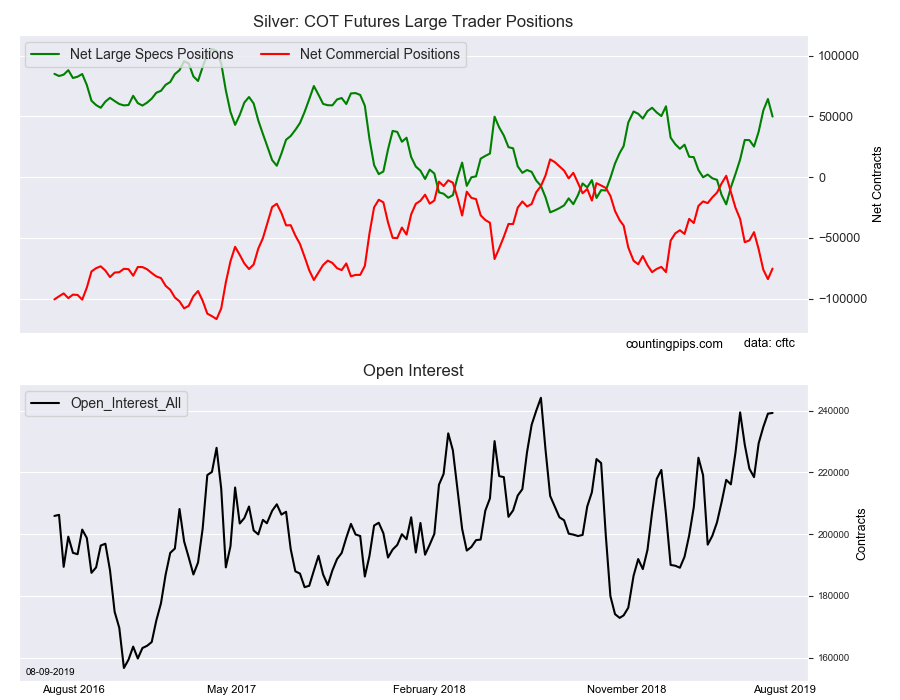
Large precious metals speculators reduced their bullish net positions in the Silver futures markets this week following three weeks of surging bullish sentiment, according to the latest Commitment of Traders (COT) data released by the Commodity Futures Trading Commission (CFTC) on Friday.
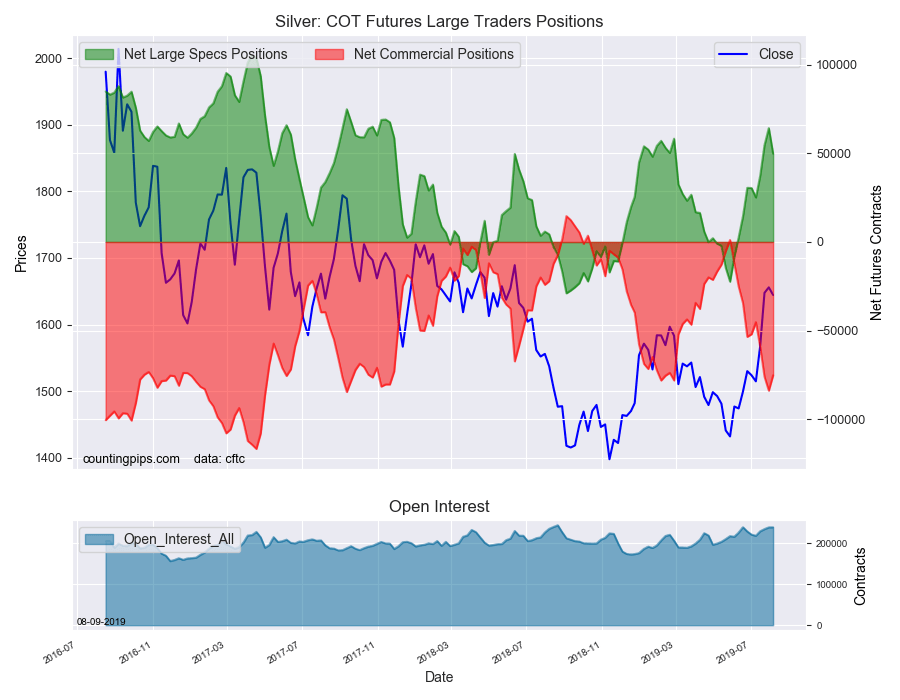
The non-commercial futures contracts of Silver futures, traded by large speculators and hedge funds, totaled a net position of 49,832 contracts in the data reported through Tuesday August 6th. This was a weekly lowering of -14,465 net contracts from the previous week which had a total of 64,297 net contracts.
The week’s net position was the result of the gross bullish position (longs) falling by -5,248 contracts (to a weekly total of 106,034 contracts) while the gross bearish position (shorts) rose by 9,217 contracts for the week (to a total of 56,202 contracts).
The large speculator position cooled off after a strong run in the past three weeks that saw bullish positions add +39,146 contracts to the bullish position. Silver positions have risen in seven out of the past ten weeks and previously reached the highest bullish level since November 21st of 2017 before this week’s retreat.
Silver Commercial Positions:
The commercial traders position, hedgers or traders engaged in buying and selling for business purposes, totaled a net position of -75,266 contracts on the week. This was a weekly rise of 8,650 contracts from the total net of -83,916 contracts reported the previous week.
Silver Futures:
Over the same weekly reporting time-frame, from Tuesday to Tuesday, the Silver Futures (Front Month) closed at approximately $1,644.50 which was a fall of $-11.30 from the previous close of $1655.80, according to unofficial market data.
*COT Report: The COT data, released weekly to the public each Friday, is updated through the most recent Tuesday (data is 3 days old) and shows a quick view of how large speculators or non-commercials (for-profit traders) as well as the commercial traders (hedgers & traders for business purposes) were positioned in the futures markets.
The CFTC categorizes trader positions according to commercial hedgers (traders who use futures contracts for hedging as part of the business), non-commercials (large traders who speculate to realize trading profits) and nonreportable traders (usually small traders/speculators).
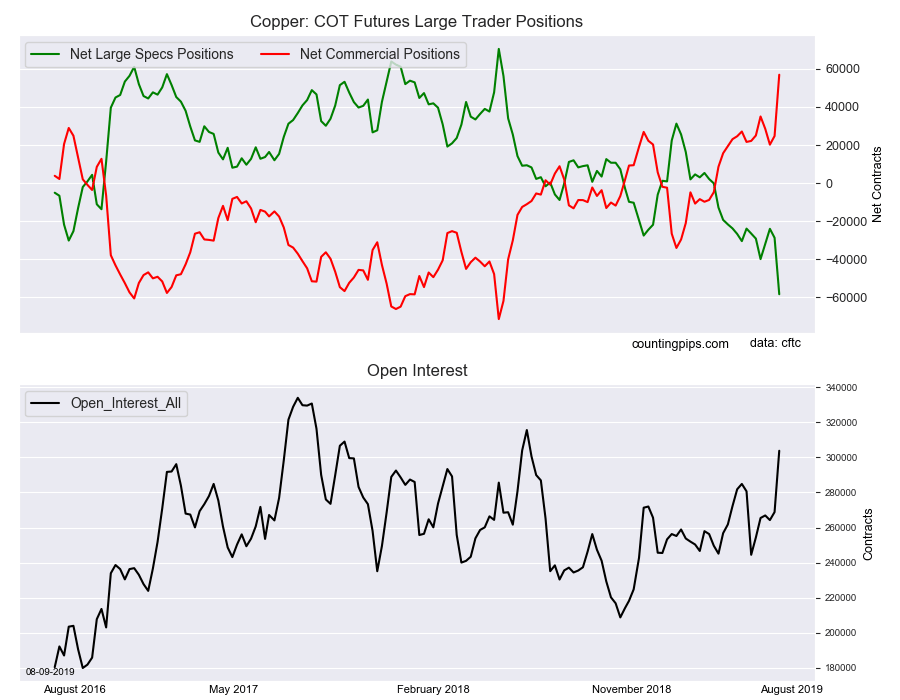
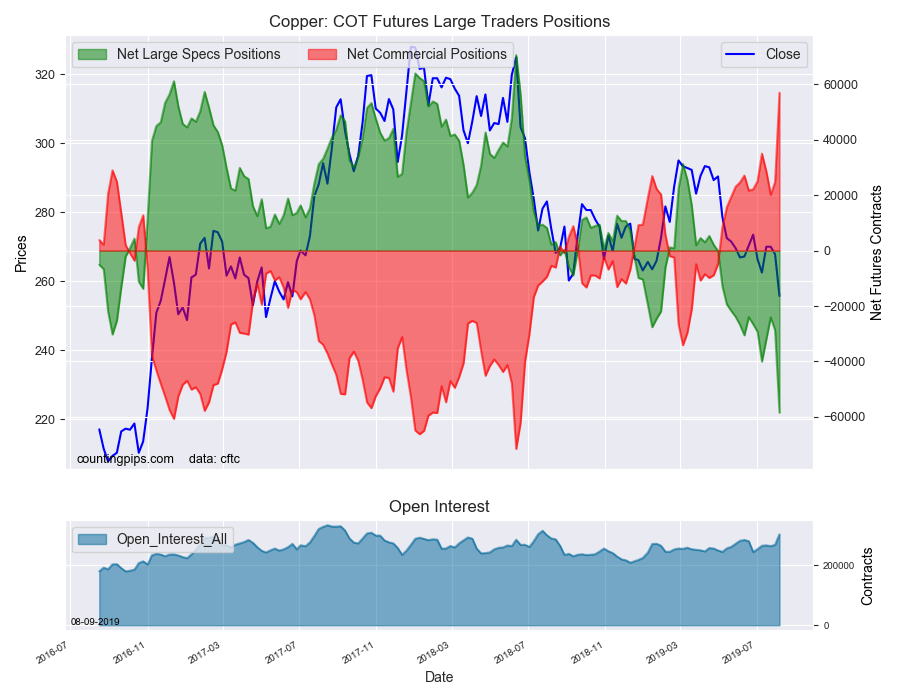
Large precious metals speculators raised their bearish bets very sharply this week in the Copper futures markets, according to the latest Commitment of Traders (COT) data released by the Commodity Futures Trading Commission (CFTC) on Friday.
The non-commercial futures contracts of Copper futures, traded by large speculators and hedge funds, totaled a net position of -58,449 contracts in the data reported through Tuesday August 6th. This was a weekly change of -29,694 net contracts from the previous week which had a total of -28,755 net contracts.
The week’s net position was the result of the gross bullish position (longs) advancing by just 1,799 contracts (to a weekly total of 79,133 contracts) while the gross bearish position (shorts) jumped by a total of 31,493 contracts on the week (to a total of 137,582 contracts).
The copper speculator’s bearish sentiment rose for a second straight week and landed at the most bearish level on record at a position over -58,000 contracts, according to the CFTC data going back to 1989. The previous bearish record was a total of -44,811 contracts on June 14th of 2016.
The weekly rise in bearish bets by -29,694 contracts also marked the largest one-week bearish change on record. The previous record was a change of -22,266 contracts on June 26th of 2018.
Copper, traditionally known as a gauge on the health of the global economy, has now been in an overall bearish standing for fifteen straight weeks and has been in stark contrast to the rising sentiment for both silver and gold.
Copper Commercial Positions:
The commercial traders position, hedgers or traders engaged in buying and selling for business purposes, totaled a net position of 56,967 contracts on the week. This was a weekly boost of 32,230 contracts from the total net of 24,737 contracts reported the previous week.
The commercial position this week also hit an all-time record high position on the bullish side and the weekly gain marked the largest one-week jump in commercial bullish positions.
Copper Futures:
Over the same weekly reporting time-frame, from Tuesday to Tuesday, the Copper Futures (Front Month) closed at approximately $255.75 which was a fall of $-12.10 from the previous close of $267.85, according to unofficial market data.
*COT Report: The COT data, released weekly to the public each Friday, is updated through the most recent Tuesday (data is 3 days old) and shows a quick view of how large speculators or non-commercials (for-profit traders) as well as the commercial traders (hedgers & traders for business purposes) were positioned in the futures markets.
The CFTC categorizes trader positions according to commercial hedgers (traders who use futures contracts for hedging as part of the business), non-commercials (large traders who speculate to realize trading profits) and nonreportable traders (usually small traders/speculators).
Avedro Inc. and Glaukos Corp. announced that the firms’ boards of directors have executed a definitive merger agreement. The all-stock deal is expected to close in Q4/19.
After the markets closed yesterday afternoon, corneal modeling platform firm Avedro Inc. (AVDR:NASDAQ) and ophthalmic medical technology and pharmaceutical company Glaukos Corp. (GKOS:NASDAQ)announced that the firms had entered into a definitive merger agreement under which Glaukos will acquire Avedro in an all-stock transaction. The boards of directors of both companies have already approved the merger. The deal is expected to close in the fourth quarter of this year subject to approval by Avedro’s shareholders and regulatory approval.
Under the terms of the merger agreement, for each share of Avedro common stock, Avedro shareholders will receive an exchange ratio equivalent of 0.365 shares of Glaukos stock. According to the agreed upon valuation calculation, “based on the parties’ volume weighted average prices (VWAPs) for the last 60 trading days prior to August 6, 2019, the transaction represents a 42% premium for Avedro shareholders. Upon closing, Glaukos shareholders are expected to own approximately 85% of the combined company, with Avedro shareholders expected to own the remaining 15%.”
The benefits of the transaction as highlighted in the report state that the deal “adds novel bio-activated pharmaceuticals to Glaukos’ new Corneal Health franchise; provides potential revenue synergies from complementary product portfolios that leverage Glaukos’ commercial scale, market-building experience and shared reimbursement expertise and customer relationships; allows for expanded pharmaceutical and device research, development and clinical capabilities that enhance ability to provide innovative hybrid ophthalmic therapies to patients; and that the acquisition is expected to accelerate Glaukos’ revenue growth rate in 2020 and be accretive to operating results and cash flows by 2021.”
Reza Zadno, Avedro’s president and CEO commented, “Avedro is extremely pleased with the potential to become part of Glaukos, a highly respected ophthalmic organization with a successful track record forging new markets with disruptive technologies like our keratoconus pharmaceutical therapies…Glaukos already has deep customer relationships with the majority of our target accounts, and a large, seasoned field organization that can unite with our team to accelerate awareness, adoption and utilization of our novel platform.”
Thomas Burns, Glaukos president and CEO stated in the release, “Avedro is an ideal fit for Glaukos’ core strengths in creating and disrupting ophthalmic markets with novel therapies that address important unmet clinical needs of practitioners and patients…Avedro has in place many of the same strategic attributes Glaukos used to pioneer MIGS, including proprietary paradigm-changing solutions, extensive clinical validation, broad reimbursement and first-to-market status…Our combined organizations can possess the essential expertise, scale and reach to maximize these opportunities, drive further commercialization of Avedro’s bio-activated pharmaceuticals and establish another synergistic and durable Glaukos franchise to fuel potential near- and long-term growth and shareholder value.”
It was a busy news day for both Avedro and Glaukos since in addition to the merger news both companies also announced second quarter earnings and operational results.
Avedro, Inc. announced financial results for the second quarter ended June 30, 2019. In Q2/19 the company reported revenue of $10.3 million, a 63% increase over Q2/18. Gross margin increased to 73.0% for Q2/19 compared to 56.4% in Q2/18. Operating loss was $6.9 million in Q2/19 versus $5.7 million in Q2/18, and the company posted a net loss of $7.4 million in Q2/19 compared to $6.5 million in Q2/18.
Glaukos also announced financial results for the second quarter ended June 30, 2019. The company reported that in Q2/19 net sales rose 36% to $58.6 million, compared to $43.2 million in Q2/18, adding that the growth primarily reflected unit volume increases worldwide.
The firm reported a loss from operations in Q2/19 of $6.2 million, which includes the $2.2 million in-process R&D charge, compared to a loss of $4.2 million in Q2/18, and a net loss in Q2/19 of $6.3 million, or $0.17 per diluted share, compared to a net loss of $5.4 million, or $0.15 per diluted share, in Q2/18, and ended Q2/19 with $159.2 million in cash and cash equivalents, short-term investments and restricted cash.
The company updated its 2019 net sales guidance to $226231 million, compared to $225231 million previously. The companies advised that the updated guidance does not include the impact of the pending acquisition of Avedro.
Avedro states that it is a leading hybrid ophthalmic pharmaceutical and medical technology company focused on treating corneal disease and disorders and improving vision to reduce dependency on eyeglasses or contact lens. The company’s proprietary bio-activated pharmaceuticals strengthen, stabilize and reshape the cornea to treat corneal ectatic disorders and correct refractive conditions.
Glaukos is an ophthalmic medical technology and pharmaceutical company that focuses on novel therapies for the treatment of glaucoma, corneal disorders and retinal diseases. The company states that it pioneered Micro-Invasive Glaucoma Surgery, or MIGS, and revolutionized the traditional glaucoma treatment and management paradigm. Glaukos states its strategy is to leverage its platform technology to build a comprehensive and proprietary portfolio of micro-scale surgical and pharmaceutical therapies in glaucoma, corneal health and retinal disease.
Avedro shares are trading much higher today on the merger news. The stock opened today at $21.50 (+$4.44, +26.03%) over yesterday’s close of $17.06. So far today, the firm’s shares have traded between $21.50 and $24.74 and at present are trading at $23.25 (+6.19, +36.28%).
Glaukos’ shares opened lower today at $ 62.30 (-$10.80, -17.34%) from the prior day’s close of $73.10. This morning the firm’s shares have traded between $61.09-68.735 and are currently trading at $64.96 (-$8.14, -11.14%).
Disclosure: 1) Stephen Hytha compiled this article for Streetwise Reports LLC and provides services to Streetwise Reports as an independent contractor. He or members of his household own securities of the following companies mentioned in the article: None. He or members of his household are paid by the following companies mentioned in this article: None. 2) The following companies mentioned in this article are billboard sponsors of Streetwise Reports: None. Click here for important disclosures about sponsor fees. 3) Comments and opinions expressed are those of the specific experts and not of Streetwise Reports or its officers. The information provided above is for informational purposes only and is not a recommendation to buy or sell any security. 4) The article does not constitute investment advice. Each reader is encouraged to consult with his or her individual financial professional and any action a reader takes as a result of information presented here is his or her own responsibility. By opening this page, each reader accepts and agrees to Streetwise Reports’ terms of use and full legal disclaimer. This article is not a solicitation for investment. Streetwise Reports does not render general or specific investment advice and the information on Streetwise Reports should not be considered a recommendation to buy or sell any security. Streetwise Reports does not endorse or recommend the business, products, services or securities of any company mentioned on Streetwise Reports. 5) From time to time, Streetwise Reports LLC and its directors, officers, employees or members of their families, as well as persons interviewed for articles and interviews on the site, may have a long or short position in securities mentioned. Directors, officers, employees or members of their immediate families are prohibited from making purchases and/or sales of those securities in the open market or otherwise from the time of the interview or the decision to write an article until three business days after the publication of the interview or article. The foregoing prohibition does not apply to articles that in substance only restate previously published company releases.
Bob Moriarty of 321 Gold gives his outlook on the gold market.
All markets go up. All markets go down. No market ever goes straight up unless it’s the end of the world and in that case why would you care?
Gold hit bottom in early 2016. Smart money was buying then. Gradually gold rose and fell with the tide until lately when it went on a roll. All the permabulls are screeching about a new bull market but it’s been a bull market for three years and been rising steadily since a year past.
The Daily Sentiment Index hit 96 in late June; the latest 10% rally bounced it higher to 97%. We are beyond nosebleed territory. It will correct shortly and violently. Silver is a more modest 91. Platinum is snoring along at 62.
I’m told the Chinese are in a panic over the trade war and buying gold with both fists. While the strong hands were buying back in early 2016, new and recent buyers of gold are the weakest of the weak hands. They love giving their money away to strong hands and will panic very soon.
The weak hands only buy because of the Fear Of Missing Out and FOMO is equally as stupid a reason to buy as the insane belief that gold has been suppressed since it hit $252 in August of 1999. Gold may have been manipulated higher but for damn sure it wasn’t suppressed unless of course you failed both basic math and logic at the same time.
The September/October crash I have been looking forward to for months is still on track. Air is hissing out of the Everything Bubble as dollars and sense dry up. We are in for a wild ride shortly.
Bob and Barb Moriarty brought 321gold.com to the Internet almost 16 years ago. They later added 321energy.com to cover oil, natural gas, gasoline, coal, solar, wind and nuclear energy. Both sites feature articles, editorial opinions, pricing figures and updates on current events affecting both sectors. Previously, Moriarty was a Marine F-4B and O-1 pilot with more than 832 missions in Vietnam. He holds 14 international aviation records.
Disclosure: 1) Statements and opinions expressed are the opinions of Bob Moriarty and not of Streetwise Reports or its officers. The auther is wholly responsible for the validity of the statements. Streetwise Reports was not involved in any aspect of the article preparation. The author was not paid by Streetwise Reports LLC for this article. Streetwise Reports was not paid by the author to publish or syndicate this article. 2) This article does not constitute investment advice. Each reader is encouraged to consult with his or her individual financial professional and any action a reader takes as a result of information presented here is his or her own responsibility. By opening this page, each reader accepts and agrees to Streetwise Reports’ terms of use and full legal disclaimer. This article is not a solicitation for investment. Streetwise Reports does not render general or specific investment advice and the information on Streetwise Reports should not be considered a recommendation to buy or sell any security. Streetwise Reports does not endorse or recommend the business, products, services or securities of any company mentioned on Streetwise Reports. 3) From time to time, Streetwise Reports LLC and its directors, officers, employees or members of their families, as well as persons interviewed for articles and interviews on the site, may have a long or short position in securities mentioned. Directors, officers, employees or members of their immediate families are prohibited from making purchases and/or sales of those securities in the open market or otherwise from the time of the interview or the decision to write an article until three business days after the publication of the interview or article. The foregoing prohibition does not apply to articles that in substance only restate previously published company releases.
Mickey Fulp, the Mercenary Geologist, and Maurice Jackson of Proven and Probable discuss the resurgent precious metals markets, as well as base metals, critical metals and energy metals.
Maurice Jackson: Joining me for a conversation today is Mickey Fulp, the Mercenary Geologist. Glad to have you here today to share your market insights, which are quite remarkable. And, I want to get your thoughts right now on the gold price. The market seems to be quite exuberant at the current price of $1,400 per ounce. Is $1,400 the new floor or is it a head fake?
Mickey Fulp: I’m being increasingly convinced it’s a floor because no matter what the U.S. dollar seems to doI mean the U.S. dollar’s up 150 points or more over the last month or so. And, despite its perturbations on a daily basis, gold’s hanging in there. Hasn’t even gotten close to breaching $1,400 for quite some time. So, it was a bit iffy. So, there’s certainly resistance on the downside in the $1,385 range. What’s the resistance on the upside? Well, probably $1,450. We’re pushing that this morning.
Maurice Jackson: We certainly are.
Mickey Fulp: We keep establishing new six-year highs, and it was six years ago since gold even approached these sorts of values. You know, as a geologist, exploration geologists do have to have an eternally optimistic side. Maybe that’s coming out. But [it’s] looking betterif we can get through to Labor Day and then through the return of everybody to the market, let’s say by the Precious Metals Summit in Beaver Creek, Colorado, in late September.
If we can get through that, then I think it could be onward and upward for gold because then you have seasonal factors coming into the equationIndian wedding and festivals specifically. And then the love trade comes into the Western worldthose two or three weeks before Christmas where we all tend to buy our loved ones gold-bearing bling.
Maurice Jackson: I don’t know if my wife would agree with that but, honey, I will get you something this year. Mickey, how about silver? Any thoughts on silver?
Mickey Fulp: Well, silver’s lagging behind and the gold-silver ratio is starting to go down. But, a month ago it was well above 92, and that is extremely rare territory. I think about 2% of the time since Nixon took us off the gold standard in 1970 has the gold-silver ratio been that high. It’s about 87 right now. You noticed overnight or yesterday, when gold popped a little bit, or even this morning when it’s kind of gone another leg up, [that] silver hasn’t participated in this last little run here.
Maurice Jackson: I know you’re not the biggest fan of silver, if I’m not mistaken, but would you actively be buying silver right now?
Mickey Fulp: Well, if I had a choice of buying gold or silver right now, I’d be buying silver because it’s undervalued with respect to gold. That ratio, the mean, the median and the average are both about 55 to 56, and so you know, that ratio will come into play at some point, again. If you buy silver now and that ratio normalizes, then you trade in your silver for your gold. The other thing that’s going on right now is numismatic gold coins are selling at not much over the markup for a current bullion coin from the government. I actually picked up a couple of numismatics yesterday, so I’ve already got the bling for my girl.
Maurice Jackson: I have as well. Regarding gold numismatic coins. I like divisibility so I don’t usually go for the one-ounce. I like the half-ounce gold numismatic and one-tenth platinum, which the one-tenth actually leads to my next question for you. And, that is platinum. What are your thoughts on platinum?
Mickey Fulp: Well, I bought some platinum back in January, I think when it went below $800/ounce. It’s now made triple bottoms below $800 in the last year. So, triple bottoms, as the chartists will tell you, that’s when you want to buy. When it made its last little foray under $800 was month or five weeks ago, if memory serves, and now it’s at $850 again. That’s another buy. It’s good time to buy platinum.
Palladium dropped $100 bucks overnight or yesterday. I think that must solely be due to a bunch of longs [getting] shaken out of market when Trump put those additional tariffs on, because palladium is an industrial metal. It’s not a precious metal. So it lost, dropped like a rocket yesterday.
Maurice Jackson: Now, I would be remiss if I didn’t ask you, because my e-mail box will be inundated with why didn’t you ask Mickey [if] he’s going to buy silver or platinum? Of the two, which one would you prefer to buy?
Mickey Fulp: Oh, I don’t know. I just buy silver coins kind of willy nilly. I bought bags of junk silver in 20082009, so for me, buying silver, I just buy a few coins here and there. But, if I was going to buy a significant amount of precious metals right now personally, I like those platinum philharmonic coins. Some beautiful coins.
Maurice Jackson: And, just a little insight for those [reading] as well, if you’re looking at silver. I get this question asked as well: What has the lowest premium right now? The answer is junk silver. Junk silver right now has the lowest premium.
Mickey Fulp: I was unaware of that.
Maurice Jackson: Yes.
Mickey Fulp: So, it’s always good to have a bag of junk silver around.
Maurice Jackson: It certainly is. When silver is out of favormost people dont realize thisit is junk silver that has the lowest premium. When silver is in favor, it’s the junk silver that has the highest premium.
Mickey Fulp: Oh, you should know, as a dealer for our buddies at Miles Franklin.
Maurice Jackson: Absolutely. Let’s switch the conversation. Let’s go to base metals. What has your attention in base metals?
Mickey Fulp: Well, copper always does. And copper’s gotten knocked down again on the trade tariffs, and some of the copper companies are on sale right now. The base metal complex overall, from the supply-demand, fundamentals viewpoint, looks very bullish, but nothing’s going to happen in the base metal complex. There’s not much upside that’s going to occur until something happens with China and the U.S.some positive resolution or something. Some news that actually is of substance indicates this is going to get better before it gets worse. And we haven’t had that.
Maurice Jackson: So, what do you say to someone who says they’re ecstatic about battery metals right there. They’re going to say, “Mickey, you’re crazy; we’re going lithium; we’re going electric.” What do you have to say about that?
Mickey Fulp: Well, I’d say you can’t go electric without copper. So, if you want to look at a battery metal, an electric metal, look at copper. The so-called battery metalswhich would include lithium and cobalt and vanadiumjust when those prices go exponential, they go parabolic.
And that’s happened over the last year on all those metals. Lithium’s lost 45% value from 14 months ago. Cobalt’s lesslost 75% of its value in the last yearand vanadium’s lost 70% of its value since December. So, do you want to be involved with those metals? I don’t know. If you’re a speculator in the metals market, [you] can’t really trade them because, with lithium [and] vanadium, those aren’t traded with futures and options market on the world exchanges. Cobalt is, but it’s such a very small market, you know, that would individual speculator want to get into those sorts of things? I don’t think so.
So, then, how can you play them? Well, you can play them through the exploration or development companies, but they tend to go exponential with the prices, and they go screaming down the other side and oftentimes never recover when the metals go down. I mean these are parabolic spikes over the last year or so on all three of these metals.
Personally, I run away from these things. If you’re going to play any of these specialty metalsand that would include the rare earths and the battery metals and tungsten and antimony and it just goes on and on and onrealize that those markets are mainly controlled by the Chinese. If you’re going to play any of those stocks, do your due diligence early, get in early and take your profits and get out.
Of all the cobalt in the world, 60%+ comes from the Democratic Republic of Congo. Vanadium? There are three standalone vanadium mines in the world, and most of the vanadium supply is by steel smelters, a byproduct of uranium production, a byproduct from fly ash waste from coal-burning power plants, and finally, residues from petroleum cracking. So, what happened last year? All those byproduct producers said, “Oh, vanadium’s at (whatever it was, can’t remember how high) $34 a pound for vanadium pentoxide.” And, what happened? Well, all those by-product guys said, “Oh, we need to make more vanadium.” They made more vanadium and they created a vanadium market. Energy Fuels Inc. (EFR:TSX; UUUU:NYSE.American) starts recovering vanadium from the White Mesa Mill. You know, so, a standalone vanadium project in northern or central Nevada is not going to make it.
Maurice Jackson: Now, you and I have discussed uranium in previous interviews. We love the value proposition of uranium and one of the catalysts for it is section 232. Give us some of your insights on that.
Mickey Fulp: Trump punted and it really surprised the market because we thought that was going to have actions of substance, if you will, [in July]. He kicked the can down the road 90 days and the market was not expecting that. The market expected a resolution that [would] run these uranium stocks, uranium producers, developers in the U.S.run them up. They cratered them. [Trump] has 90 days from mid-July; that would be mid-November to act on this. It’s probably a good time to buy uranium stocks right nowspecific uranium stocks and for a trade.
Maurice Jackson: If you were a betting man, how do you think the outcome’s going to be?
Mickey Fulp: Well, I’ve already gone on record with four scenarios I thought he could do to support the uranium mining industry. And they were all categorically wrong because he punted. He could put on subsidies, he could put on tariffs, he could give tax credits; [there are] a variety of things they can do to help the domestic uranium mining industry. He could require quotas from U.S. producers. We’ll just have to see.
Maurice Jackson: I love having this discussion with you because I learn so much from you. Mickey, if someone else wants to learn more from you, what’s the website?
Mickey Fulp:MercenaryGeologists.com is the website. We put out something on the order of four pieces of content, including this interview, on the website every week. And, you will get a notice if you’re a subscriber. Best thing about becoming a subscriber is it’s free. So, the price is right. And, we’re very active on Twitter @mercenarygeo, with something a little less than 52,000 Twitter followers.
Maurice Jackson: Well, our subscription pricewe match with yours. It’s free, so we welcome you; please to visit us at www.provenandprobable.com. Mickey Fulp, it’s always an honor to have you on our show. Thanks for joining us today.
Mickey Fulp: Thanks a lot, Maurice.
Maurice Jackson is the founder of Proven and Probable, a U.S. based media company that has a dual prong approach. The first prong identifies undervalued junior mining opportunities, conducts site visits around the world, and interviews CEOs of companies that are on major world stock exchanges and some of the most respected names in the natural resource space. The second prong, Proven and Probable is an independent licensed representative of Miles Franklin to sell physical precious metals in a number of options to expand a precious metals portfolio, offering physical delivery to home or business of gold, silver, platinum, palladium and rhodium, a fully insured offshore depository, as well as precious metals IRAs, and ledger private blockchain distributed ledger technology stored at the Royal Canadian Mint.
Disclosure: 1) Maurice Jackson: I, or members of my immediate household or family, own shares of the following companies mentioned in this article: None. I personally am, or members of my immediate household or family are, paid by the following companies mentioned in this article: None. My company has a financial relationship with the following companies mentioned in this article: None. Proven and Probable disclosures are listed below. 2) The following companies mentioned in this article are billboard sponsors of Streetwise Reports: Energy Fuels. Click here for important disclosures about sponsor fees. 3) Statements and opinions expressed are the opinions of the author and not of Streetwise Reports or its officers. The author is wholly responsible for the validity of the statements. The author was not paid by Streetwise Reports for this article. Streetwise Reports was not paid by the author to publish or syndicate this article. The information provided above is for informational purposes only and is not a recommendation to buy or sell any security. Streetwise Reports requires contributing authors to disclose any shareholdings in, or economic relationships with, companies that they write about. Streetwise Reports relies upon the authors to accurately provide this information and Streetwise Reports has no means of verifying its accuracy. 4) This article does not constitute investment advice. Each reader is encouraged to consult with his or her individual financial professional and any action a reader takes as a result of information presented here is his or her own responsibility. By opening this page, each reader accepts and agrees to Streetwise Reports’ terms of use and full legal disclaimer. This article is not a solicitation for investment. Streetwise Reports does not render general or specific investment advice and the information on Streetwise Reports should not be considered a recommendation to buy or sell any security. Streetwise Reports does not endorse or recommend the business, products, services or securities of any company mentioned on Streetwise Reports. 5) From time to time, Streetwise Reports LLC and its directors, officers, employees or members of their families, as well as persons interviewed for articles and interviews on the site, may have a long or short position in securities mentioned. Directors, officers, employees or members of their immediate families are prohibited from making purchases and/or sales of those securities in the open market or otherwise from the time of the interview or the decision to write an article until three business days after the publication of the interview or article. The foregoing prohibition does not apply to articles that in substance only restate previously published company releases.
Proven and Probable LLC receives financial compensation from its sponsors. The compensation is used is to fund both sponsor-specific activities and general report activities, website, and general and administrative costs. Sponsor-specific activities may include aggregating content and publishing that content on the Proven and Probable website, creating and maintaining company landing pages, interviewing key management, posting a banner/billboard, and/or issuing press releases. The fees also cover the costs for Proven and Probable to publish sector-specific information on our site, and also to create content by interviewing experts in the sector. Monthly sponsorship fees range from $1,000 to $4,000 per month. Proven and Probable LLC does accept stock for payment of sponsorship fees. Sponsor pages may be considered advertising for the purposes of 18 U.S.C. 1734.
The Information presented in Proven and Probable is provided for educational and informational purposes only, without any express or implied warranty of any kind, including warranties of accuracy, completeness, or fitness for any particular purpose. The Information contained in or provided from or through this forum is not intended to be and does not constitute financial advice, investment advice, trading advice or any other advice. The Information on this forum and provided from or through this forum is general in nature and is not specific to you the User or anyone else. You should not make any decision, financial, investments, trading or otherwise, based on any of the information presented on this forum without undertaking independent due diligence and consultation with a professional broker or competent financial advisor. You understand that you are using any and all Information available on or through this forum at your own risk.
FX has been rocked by the ramp up in action of the US-China trade war.
The fact the PBoC is now willing to use the RMB as a mechanism to counter tariffs is a new dimension for markets. It also shows that the FX market has now become a ‘battle ground’ and thus risk and commodity currencies will be impacted as the battle ramps up. i.e. AUD, NZD, CAD and EUR.
Thus, we need to quantify how big a move this was from the PBoC, what USDCNY could look like going forward and what this means for floating FX more broadly.
So how big was it?
Evaluating the initial fix (last Monday) above 7 clearly caught the market off guard. It was one the hardest devaluations from the PBoC since the fix was brought in back in 1994. It also signaled that Beijing is now ready to go toe-to-toe with Washington on trade issues.
It’s the preceding fixings that should really catch your attention, here is why:
Tuesday saw a 450pip depreciation in USDCNY – it was taken as a ‘positive’ as it was more ‘conservative’ than expected. However, that 450bps drop was the 8th largest single day move since 1994, which to me signals this is structural. Now, if we couple the initial fix devaluation and then the next 3 day only 4 other times since 1994 has the PBoC gone harder. August 2015 which saw an 8% decline in CNY (6.1 to 6.8). July 2018 which lead to a 10% depreciation of 2 months, June 2016 where CNY was weakened by 8% (6.5 to 6.95) the final time was January 2017 when the fix was controlled by the China Foreign Exchange Trade System without countermeasures.
Conclusion from the moves last week – China is about to undertake a structural devaluation of the RMB.
So how could this proceed?
The action by the PBoC is clearly in response to the new tariffs coming on September 1. Thus if we look back over the past 18 months since the US-China war begun China has done this before which begun in June-July last year. Over a 4-month period the PBoC move the RMB down 10% in a slow and steady, almost stealth like policy shift seeing RM hitting 6.9 from 6.3 in April. Interestingly it didn’t affect market stability but was fast enough not to invite speculation. One should expect this again
So where could USDCNY end up?
Using history again as a uide and the ranges we have seen in the past of 8% to 10% depreciation levels it easy to make a case for the pair to be in a range of between 7.4 to 7.5 come December. Now that is speculative and this idea would change if the trade war for example was to dissipate. But it’s a reasonable assessment judging on previous moves.
Finally positioning for USDCNY movement
First and foremost, have 11.15am (AEST) on alarm, this is when the PBoC fixes the RMB, then position from there in either a risk off or risk on set up depending on the fix.
Second is watch the Washington response – “Currency War”, “manipulation”, “unfair” etc. etc. from the President and his other hard-line China hawks will likely push the USD around a bit but by and large it’s pretty empty. The bigger risk is if there is USD side intervention. Now this is unlikely and hard work considering the size of the USD market. But, this President is unconventional so it not outside the realms of possibilities. This is a risk so get your stops out.
Asian focused FX are the pairs in play, thus to position for moves in RMB use AUD, NZD on the short side. JPY on the long.
Final point – volatility is here thus evaluate your risk as gapping and whip events are very likely.
Welcome to this week’s Market Wrap Podcast, I’m Mike Gleason.
Coming up David Morgan of The Morgan Report joins me to break down the recent move in the metals, explains why he believes the move is a result of something no one is talking about – and he also gives us some key levels for silver, as it looks to gather strength from here. So don’t miss another must-hear conversation with David Morgan, coming up after this week’s market update.
What a wild week it’s been for investors.
The threat of global trade wars and currency wars sparked big swings across all major asset classes. Bond yields dove toward historic lows. Stocks plunged earlier in the week before rebounding sharply by Thursday. And precious metals rode a huge safe-haven wave higher.
Gold prices eclipsed the $1,500 level on Wednesday for the first time in over six years. Meanwhile, silver pushed above $17 an ounce to record a one-year high.
As of this Friday recording, gold trades at $1,504 an ounce, up $62 or 4.3% since last Friday’s close. Silver is posting a weekly gain of 81 cents or 5.0% to bring spot prices to $17.07. Platinum is up 2.2% for the week to come in at $867. And finally, palladium is putting in a 1.2% advance this week to trade at $1,434 an ounce.
The money metals are becoming increasingly attractive as President Donald Trump ramps up his battles against China abroad and the Federal Reserve at home.
On Monday, the Trump administration formally branded China a “currency manipulator.” China’s central bank had moved to push the yuan lower against the U.S. dollar in apparent retaliation for new U.S. tariffs. The yuan traded at its cheapest exchange rate versus the dollar in more than a decade.
Curiously, the U.S. Dollar Index also traded lower this week against the euro and yen. Perhaps the Trump administration is engaging in some currency manipulation of its own through the Treasury Department’s Exchange Stabilization Fund and the International Monetary Fund. Treasury Secretary Steven Mnuchin called on the IMF to help put brakes on countries that cheapen their currencies to gain trade advantages.
A former Treasury Secretary, Larry Summers, said that we may now be at the most dangerous moment since the last global financial crisis ended in 2009. The circumstances are different today, but in some ways the risks are more extreme.
The entire world monetary order is at risk. President Trump is now explicitly ditching the “strong dollar” posturing of previous presidents. He wants a weaker dollar and hopes he can pressure the Federal Reserve into cooperating with bigger and more rapid interest rate cuts.
A shift toward a weak dollar policy could make foreign holders of U.S. assets nervous. Close to $7 trillion in Treasuries are now held by foreigners. If they begin losing confidence, the government will face a difficult funding problem.
For now, though, there are few other places for them to turn. Even though yields on U.S. bonds have been pushed down close to historic lows, they are still higher than those attached to the paper issued by other governments around the world.
These days it’s becoming harder to find sovereign debt that even carries a positive yield. The latest estimates are that $14-$15 trillion in bonds carry negative yields.
It sounds crazy – bonds that obligate holders to pay interest to the issuing borrowers. But some economists think the negative interest rate syndrome could eventually infect the United States.
In the meantime, Treasury holders face the prospect of earning negative real returns. That is to say, the yields they earn are at grave risk of falling behind inflation.
The yield on the 10-year Treasury fell to 1.7% this week. That’s below the Fed’s target inflation rate of 2%. With Jerome Powell and other Fed policymakers endorsing “symmetric” inflation targeting, that means they may let inflation run well above 2% for some time in order to compensate for recent periods of below-2% price level increases.
The entire Treasury yield curve is at risk of falling into negative territory in real terms. It may have already… depending on which inflation gauge you use.
Fortunately for precious metals investors, gold and silver tend to thrive in an environment of negative real interest rates.
When real interest rates on paper turn negative, there no longer is an opportunity cost associated with holding gold. Metals become attractive to hold as alternatives to depreciating paper – and tend to perform well.
Gold and silver bugs certainly have reason to be optimistic. Prices have broken out of large consolidation bases ahead of near certain additional rate cuts from the Fed and a formal shift by the White House toward weak dollar policies.
The one missing piece of the bullish picture is rising inflation pressures. Although price increases are showing up in some areas of the economy, there is no broad inflationary momentum taking hold. It will likely take a sustained rise in energy and food commodity prices before inflation fears drive mainstream investors to exit their negative yielding bonds and seek protection in precious metals.
The upshot is that the current bull market phase in gold and silver is still very young. Before reaching maturity, it will suffer some setbacks. One may be due after this recent run up. But the upside potential ahead is far more positive than the yield on any government bond.
Well now for more on this, including the reasons why my guest thinks we haven’t seen anything yet when it comes to this metals move, let’s get right to this week’s exclusive interview with the man they call the Silver Guru.
Mike Gleason: It is my privilege now to welcome back our good friend David Morgan of The Morgan Report. David, it’s always good to have you on and appreciate you joining us today. How are you, sir?
David Morgan: Mike, I’m doing all right and it’s good to be with you.
Mike Gleason: Well, David, I know we don’t have a whole lot of time today, but I’m really glad we’re able to speak to you this week because we’re finally seeing some real fireworks here in the metals lately. And I wanted to get your comments.
I should mention that we’re talking here on Thursday morning and we’ve got gold hovering around $1,500 and silver right at about $17. They both popped above those respective key levels yesterday, Wednesday. So first off, what do you make of this move, David? What’s driving it? And the bigger question, will it be sustained?
David Morgan: Well, what’s driving it is something that no one’s really, really talking about. This is my opinion. Of course, you’re asking for my opinion. A lot is the financial press, “Well, It’s all about this trade war with China and the trade war is getting worse. And there’s going to be more sanctions coming in,” and on and on and on. And that may have something to do with it.
But first of all, the underlying fundamental is financial uncertainty. That’s number one. But beyond that, it’s really something going on in the physical market that no one’s really writing about and I don’t know enough about the state other than it’s got to be part of it. The reason I say that is that the paper paradigm is very clear on how the markets move in the futures markets with trading this paper back and forth for contracts to buy and sell silver. And all they really do is set the paper price.
And of course the metals price goes along with that. I’m not trying to discount that very much. What I’m trying to state is that the paper markets dominate the price over and over again. And every now and again you’ll get in a situation like this where something’s going on, where something needs to be fulfilled and accomplished, and it hasn’t been settled out yet.
So for an example, let’s say there’s some bank that’s demanding a physical settlement in gold and they haven’t received it yet. Once that’s accomplished, you may, and most likely, see the market cool off and go more into some type of trading range where you’re more apt to be able to look at the paper trades, more of what we call levels that we’re used to seeing.
So, I think there’s something out there. Whether that’s occurring with silver or not, I doubt it, right now based on the fact that silver has been lagging gold so much. And there’s a couple of gaps in the charts that will probably be filled, one, you haven’t missed this move at all. If you bought yesterday at maybe the high, I don’t know yet, and it goes down and let’s say silver makes it all the way back down into the, I don’t know, $15.50 range or something, you haven’t missed much. Yeah, you wouldn’t want to buy and see a loss right away. But what I’m trying to state is this, I’m convinced, is the real move. It’s going to be multi-year. And silver and gold, at the end of three, four years from now are going to be substantially higher than they are today.
Mike Gleason: Certainly strong comments. You’re always take a very level-headed approach and have not been just pumping sunshine over these last several years every time we get a rally. So, that’s definitely something that we should all take note of.
Now, silver, you mentioned this, silver does seem to be underperforming a little bit vis-a-vis gold. And now we’ve seen the gold-silver ratio come down from, I think I saw it 93 to one, maybe about there, within the last few months. It’s about 88 to one right now. So, silver has gained somewhat but maybe not quite like you would expect given a big bull move and given that silver should vastly outperform gold in a bull market. So is this seeming lack of out performance from silver a cause for concern?
David Morgan: Somewhat still it is. First of all, I like to see, I mean 80 to 1 at a minimum. And even there that’s an extreme.
When I started the previous website – my website, I think everyone knows is TheMorganReport.com – I rebranded that for years now because I want everyone to be aware that I cover all the resource sector, lithium, rare-earths, et cetera, and not just silver.
But back in the older days with Silver-Investor.com, when I started that website, the ratio was 80 to one, and that was an extreme. And if you would have asked me, even, I don’t know, three years ago, a couple years ago, “Will you see the gold-silver ratio above 80 to one?” I would’ve said, “No. I really, really doubt it” and I’m wrong. It’s got to about 93, 4, 5, somewhere in that range.
So, to really be convinced that, and first of all, I’m convinced that we’re in a new bull market, to be convinced that things are, let’s say, going to show both metals really outperform many other sectors, the equity markets, the bond market, the real estate market, everything else, and take the dominating lead as this currency crisis continues, I want to see silver below a 70-to-one ratio. That would be ultimate confirmation for me, Mike that okay, we’re well on our way, and we’re not. We’re at 88.
Silver has some work to do. Silver is, in my view, much more difficult to analyze than gold, but it can make these moves rather drastically and quickly as gold is doing. Of course, silver’s done pretty good job here of late picking up some momentum and moving from the doldrums into the 17, which is still dirt cheap.
I mean, if you take an AISC, all-in sustaining cost, for some of the major silver producers, they’ll tell you they’re at $15 but they don’t tell you is what their taxes are. So if you add those in, a lot of them are right at basically where we’re at, in other words $17. They’re just break even.
And for any company, what they’re making dresses or corn chips or cola, you want as wide a margin as you can get commensurate with what the market’s willing to pay for your product. And in the case of silver, these companies are still struggling at these levels. So, silver’s got a long ways to go, as does gold, for the margins to be large enough for these companies to breathe easy and have a viable business and be able to have a cashflow that allows them to go out and explore further or retain assets or whatever. So, I see a lot of upside but I’m also anxious for silver to kind of show its wings and fly, and that type of thing.
Mike Gleason: Gold has risen to levels last seen in 2013 when it broke down. But silver obviously is nowhere near those levels, which was say the mid-20s at about that point. What is it going to take for silver to get back above that say into the $20 plus range and what are some of the key resistance points you’re watching for silver between here and there and then beyond?
David Morgan: Okay. Well for, yeah, it does take more interest in the metals all together. Obviously there’s a lot of interests coming in, but it’s mostly institutional. It’s not your retail (investors) at this time. I talk to many dealers such as yourself, Mike. And what I found out was a little bit surprising. A lot of this trading is going through, as I said, institutions which means futures trading and ETFs and a lot of the retail investors are saying, you know what gold’s back to where I bought it, I bought it at this $1,450. It’s there, I’m selling it back. So a lot of the retail investors aren’t believing this rally is for real. And what they’re doing is basically getting their money back. Not all of them of course, but so there’s a lot of work to be done on the silver side. There is lots of areas of resistance on this.
Pulling up a chart as we’re speaking, Mike, because I anticipated this. So there’s huge resistance at $17, which is where we’re at right now as we speak. Will it get through that? Yes. Eventually it will. Will it instantly? I doubt it. I think it’ll come back and fill the gap. And I’m going to do an update for my paid members here, show them where a good entry point is. If they have stopped, if they want to get into this market or add to their positions, whatever. Normally I do that all through equities. I use the futures as a proxy for the overall market. Doesn’t mean you should do futures. In fact, a dissuade anybody from using the futures market. It’s just, that’s where the price is set. So it’s easier to analyze, and I can show them on the chart when silver gets to this level, that’s a good time to start buying your top tier or your favorite junior or whatever you’re going to do.
So, $17… $17 to $17.25 is a pretty big area of resistance. After that, it floats up to a really $19-20 pretty easily. So once we work through that level, Mike, you’ll probably see an acceleration of silver from, I’m going to say $17.50 up to $19.50 I expect it to go to that level fairly quickly. It won’t be like two trading days, but it may probably won’t take very long. Silver could surprise anybody, even me as far as how it reacts. It doesn’t seem to ever do what you expect it to do. But regardless it will outperform and we do need to see a higher level. Once again, over the $20 level, I think the psychology will change and people will say, “It’s silver, not so bad.” Now, they won’t touch at $15. I know you guys sell silver at all levels and every day and there’s always purchases.
But, mark my words, you check the volume and activity at your business. How many people are calling in and buying silver or when it gets silver when it gets over $20, what it’s doing now, and I’m sure you’ll be selling more at that level. People just love to buy the metals at a higher price. When I’m pounding the table saying “This is it.”
Because most people don’t want to put up with, the time, the patience that’s required, if you bought silver at $14 at the end of 2015. Watched it rally all the way up to $21. I was convinced at that time where the bull mark was back in tact. And in a way it is, I mean if you look at gold from that perspective, that’s where it bottomed and has had high or lows all the way up. Silver’s chart doesn’t look like that. Silver bottoms at the same time as gold, which is December, 2015. and it has not made high or lows all the way up. And we’ve basically stayed flat to about $15.75 and then it broke down from there and it got down as low as the 14s. So still higher than it was in December, 2015 but a messy chart, let’s say.
Mike Gleason: Yeah, there’s certainly some big, big levels above us and yeah, I agree. I think when we see silver, get that two handle again. I think that’s when a lot of people are going recognize that okay, it’s time to start moving and the smart people will do it before then.
Again, thanks David for fitting us in. I know we had a tight window here and it’s been great to have you on. But as we wrap up though, I want to give you a chance to fill our audience in on any of the other markets that you’re looking at here.
David Morgan: Sure. Always looking at the equity market and of course the bonds are the key and the currency markets – we looking at everything really. I think the stock market is showing some wear. It’s been a bull market for quite some time. It’s overvalued by any metric you want to use. I’m looking at that and see it get rolled over further. And then bond market of course is the key because this is the debt markets that everything depends on and how much faith there is in that is going to determine the future of the financial system. So, those are key currencies. As I’ve said many times you can see gold and the dollar go up. Dollar’s making new highs. Gold’s making a six year high. And I said “Watch.” And of course here we are. There’s a reason for that. So, I think that’s about it.
I just close out, I got this email. “I’m a young guy, I have a high conviction, precious metal is the best place to be in the next three to five years. I’m in need of guidance of how to build a long-term precious metals portfolio. I want to fund this as soon as possible. I know you’re not a financial adviser, but you offer services that will help me start a precious metal portfolio. I continue to monitor the market on an ongoing basis with your analysis, can you help me?” And that’s almost precisely what I do. So, I will get with this gentleman and kind of reaffirm what he’s already asking. Can you help me? Yeah, that’s what our business is. So anyway, if you want to learn more, just go TheMorganReport.com put in a first name and an email address, be happy to put you on our free list. And you can determine from there, if you want to go further.
Mike Gleason: There’s probably no better time to get in and get on board with services like The Morgan Report, and the great commentary that David and his team put out there. And, and just see what’s going happen and what they have to say about these markets as we could be entering this new bull phase. I mean, you heard David say it, he’s convinced we’re in a new bull market and this is going to be an exciting time and the time that precious metals investors have been waiting for, for a number of years. So definitely urge people to take advantage of that and go to TheMorganReport.com it’s truly great stuff. You have just heard what David was talking about. A great approach to all these markets and lots and lots of experience over the years. He’s seen everything.
Well good stuff David. Always appreciate it. Thanks so much. I hope you enjoy the rest of your summer and I can’t wait for our next conversation, take care.
David Morgan: Thanks so much Mike. It’s great to be back with you.
Mike Gleason: Well that will do it for this week. Thanks again to David Morgan, publisher of The Morgan Report. To follow David, just visit TheMorganReport.com you can follow him on Twitter, it’s @silverguru22. And if you haven’t already, grab a copy of the book titled Second Chance: How to Make and Keep Big Money During the Coming Gold and Silver Shock Wave, which is available at MoneyMetals.com and other places where books are sold. Be sure to check that out. And check out the TheMorganReport.com and start getting wonderful commentaries from David and his team on a regular basis.
Mike Gleason: And don’t forget to check back here next Friday for our next Weekly Market Wrap Podcast. Until then, this have been Mike Gleason with Money Metals Exchange, thanks for listening and have a great weekend everybody.
The Money Metals News Service provides market news and crisp commentary for investors following the precious metals markets.
The central bank of the island of Mauritius lowered its key repo rate by 15 basis points to 3.35 percent, saying easing price pressures “provides room for a reduction in the policy rate as a pre-emptive move against the risks associated with weakening global growth.”
It is the first rate cut by the Bank of Mauritius (BOM) since September 2017 and a majority of its monetary policy committee voted for the cut.
Although BOM said the underlying growth momentum in the Indian Ocean island remains positive, as a small, open economy Mauritius has to “further enhance its resilience to be able to withstand the worsening external environment.”
The gross domestic product of Mauritius slowed to year-year 3.3 percent growth in the first quarter of this year from 4.1 percent in the previous quarter, but BOM still maintained its forecast for full year growth of 3.9 percent and 4.0 percent for 2020.
But inflation remains low and BOM said headline inflation fell further to 0.9 percent in July from 1.2 percent in April and again lowered its forecast for 2019 average inflation of 0.5 percent from May’s forecast of 1.5 percent and the February forecast of 2.1 percent.
In April the International Monetary Fund forecast 2019 inflation of 2.1 percent, down from 3.2 percent in 2018 and 2020 inflation of 3.9 percent.
Today, BOM forecast average 2020 inflation of 1.5 percent.
The exchange rate of the Mauritian rupee has risen this month after depreciating steadily since February and was trading at 35.67 to the U.S. dollar today, down 3.4 percent this year.
The Bank of Mauritius issued the following statement:
“The Monetary Policy Committee (MPC) of the Bank of Mauritius has, by majority vote, cut the Key Repo Rate (KRR) by 15 basis points to 3.35 per cent per annum at its meeting today.
The MPC noted that the prospects for global economic outlook have further weakened due to increasing trade tensions between the two largest economies, the rising uncertainties associated with Brexit and geopolitical tensions. Multilateral institutions, like the IMF, World Bank, OECD and the United Nations, have accordingly downgraded their global economic growth forecasts for 2019 and 2020.
The domestic economy has shown good resilience so far. The underlying growth momentum remains broadly positive, supporting the current growth forecast of 3.9 per cent for 2019 and 4 per cent for 2020. However, as a small open economy. Mauritius has to further enhance its resilience to be able to withstand the worsening external environment.
The MPC assessed that price pressures have continued to ease since its last meeting. Headline inflation in Mauritius has declined further from 1.2 per cent in April 2019 to 0.9 per cent in July 2019. Based on current trends and barring major shocks, headline inflation is now forecast at 0.5 per cent in 2019 and about 1.5 per cent in 2020.
A majority of members viewed that the inflation outlook provides room for a reduction in the policy rate as a pre-emptive move against the risks associated with weakening global growth. They noted that central banks have been easing monetary policy to support their economies. Going forward, the MPC will continue to monitor price and growth conditions to ensure that monetary policy remains appropriately supportive of sustained non-inflationary economic growth over the medium term.
The Minutes of the meeting will be issued on Friday 23 August 2019.”
Once you’ve got a large number of trades under your belt, and have kept accurate track of them over time, you can start using many of the indicators you apply to the markets to your account data. This will help you analyze and improve your trading.
But, in order to do that, you have to get a good appreciation of your equity curve.
If you make a spreadsheet of your trades, you can turn it into a graph, tracking the growth (and hopefully not too much lack of growth) of your account balance. After a few hundred trades, it will look a lot like a graph of the market performance, which is really useful when it comes to studying it.
The Rollercoaster of Trading
Now the markets go up and down, and so can your trading account. If you plot your equity curve, and it’s pointing downwards, it’ll likely give you a sinking feeling. Occasional downs, especially after ups, are normal for any kind of trading. But we want the trend to be going UPWARDS.
An equity curve that is trending upwards has a profit factor over 1. This means you are making money in the long term. An equity curve that trends downwards, has a profit factor of less than one and is a warning sign that you need to seriously reevaluate your strategy.
What to Do
Standard practice is to use a moving average along with your equity curve to give you a heads up that your trading strategy needs tweaking. This can help you adapt to market changes and save money.
The thing is, in normal trading situations, when you implement a strategy and start trading, your first few trades are likely going to fluctuate as you get used to the situation and tweak your strategy a bit.
But, if things are how they are supposed to be, your account balance should start trending upwards. It will bounce up and down depending on market conditions, of course, but you should have an idea of a long-term positive trend.
Where to Set the Limits
The problem is that you might not know when your account is just going up and down, and when it’s actually trending. That’s why it’s useful to apply a simple moving average to your equity curve.
Not only does it help visualize the trend, but it also allows you to set up “stops”. If the curve retreats back to the moving average, you can immediately see that this drawdown is bigger than normal, and you might want to revisit your strategy.
How much of an interval you should set for your moving average will depend on how much of a drawdown you can accept. While there are statistics to show what’s the ideal potential loss for individual trades, the level of drawdown that you should expect often depends on your personal trading experience, psychology, and strategy.
Traders with high variance in their results would likely set a larger interval in their simple moving average to get a more accurate reading on where their profitability is trending (such as a 100 or 200 SMA). On the other hand, if you tend to be pretty consistent in the kind of results that you get, a shorter interval, so you can get a quicker warning that something is off with your trading (like 50 to 100 SMA).