Dollar weakens as Trump tweets rate cuts would help US companies
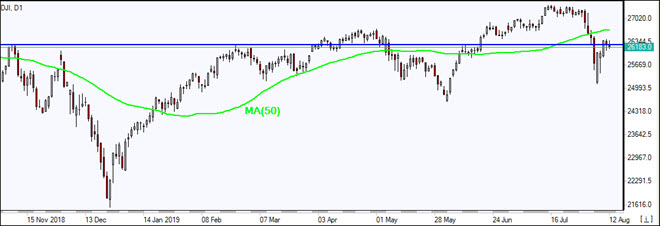
US stock indexes pulled back on Friday as President Trump told reporters he was “ not ready “ for a deal with China and negotiations earlier announced to continue in Washington in September may be cancelled. The S&P 500 lost 0.7% to 2918.65, falling 0.5% for the week. Dow Jones industrial slid 0.3% to 26287.44. The Nasdaq fell 1% to 7959.14. The dollar weakening continued as Trump tweeted Federal Reserve interest rate cuts “ will make it possible for our companies to win against any competition.” The live dollar index data show the ICE US Dollar index, a measure of the dollar’s strength against a basket of six rival currencies, slipped 0.02% to 97.52 but is higher currently. Stock index futures point to higher market openings today
DAX leads European indexes movement
European stocks resumed their retreat on Friday after the leader of Italy’s League Party called for a snap election. GBP/USD fell while EUR/USD rose on Friday with both pairs reversing their directions currently. The Stoxx Europe 600 Index lost 0.8% Friday. The DAX 30 fell 1.3% to 11693.80. France’s CAC 40 lost 1.1% and UK’s FTSE 100 slid 0.4% to 7253.85.
Shanghai Composite leads Asian indexes gains
Asian stock indices are mixed today in a thin trading with markets in Japan closed for a holiday. Yen accelerated its climb against the dollar. China’s markets are mixed as China’s central bank set the midpoint for the yuan weaker than 7 per dollar for the third day in a row: the Shanghai Composite Index is up 1.5% while Hong Kong’s Hang Seng Index is 0.3% lower. Australia’s All Ordinaries Index extended gains 0.1% as the Australian dollar accelerated its slide against the greenback.
Brent futures prices are edging lower today on world growth slowing concerns. Prices rose on Friday: Brent for October settlement ended 2% higher at $58.53 a barrel Friday, nevertheless closing 5.4% lower for the week.
Note: This overview has an informative and tutorial character and is published for free. All the data, included in the overview, are received from public sources, recognized as more or less reliable. Moreover, there is no guarantee that the indicated information is full and precise. Overviews are not updated. The whole information in each overview, including opinion, indicators, charts and anything else, is provided only for familiarization purposes and is not financial advice or а recommendation. The whole text and its any part, as well as the charts cannot be considered as an offer to make a deal with any asset. IFC Markets and its employees under any circumstances are not liable for any action taken by someone else during or after reading the overview.
The recent news that the US Fed, China and many of the global central banks are continuing to make efforts to lower rates and spark further consumer spending and economic activity is reminiscent of the late 2010~2013 global economic recovery efforts. This was a time when the economy was much slower than current levels and when central banks were doing everything possible to attempt to raise consumer and business activity related to capital.
The world’s governments and banks operate on a very simple premise – transactions and economic activity must continue to operate within a fairly standard range of consistency in order for tax revenues and transactional fees to drive profits/income. If extended periods of economic contraction persist, the capacity to function within standard operating parameters diminishes very quickly for these institutions. A -5% to -10% contraction in asset values, transactional business, tax revenues and/or consumer activity over an extended period of time could result in a catastrophic set of events taking place.
In the 2008-09 global credit market collapse, we witnessed an event that accelerated well beyond this -10% contraction very quickly. We believe the reason the US Fed and Global Central Banks are engaging in stimulus that is designed to attempt to spark further lending, borrowing and increased consumer activities to prompt another round of expansion within the global economy. We believe these efforts to support global asset prices and transactional processes and fees may end up supporting a process where many central banks and governments may end up paying consumers to borrow (negative interest rates) and pay consumers to continue engaging in economic activities.
Historically, central bank rates have never been this low in recent history and recent news that global central banks may continue to lower interest rates, ease monetary policy and introduce new stimulus programs suggests that concerns of a global market recession are real and that concerns the global consumer may contract economic activity and spending are real. Yet, is the answer to this problem related to real lending rates or something else?
Countries where risks are excessively higher rates
It appears from our research that the only countries that are capable of operating at rates that are closer to normal are countries where risks are excessive and rates are higher because they need to attract investment into their debt/bonds. Established markets appear to be operating in a mode where lending rates are not conducive to traditional economic mechanisms of spending, saving, investing and rational accounting fundamental. The closest example we can use to attempt to explain this process is to state that we believe the credit markets never fully recovered after the 2008-09 credit market collapse and the new debt created from that event has, as of yet, failed to prompt any real economic expansion.
We believe the global economy is within a transitional process that will result in a longer-term economic expansion – yet we believe the process of achieving this expansion may require the destruction of certain aspects of the current economic system. The chart below highlights the efforts from 2003 through early 2019 of global banks to stimulate and stabilize the global economy with every tool available.
As difficult as it is to see in this image, global central banks have engaged in various efforts, at various times, to enact a concerted effort to stimulated the global economy, then back away from stimulus to evaluate the individual processes of the global economy and its ability to support itself. Each rise in QE activity is marked with new challenges and new efforts to spark economic activity. We believe one of the main challenges of this policy is that QE efforts may have benefited the wrong segment of the global population at the time and further eroded the intended outcome of these efforts.
Throughout this incredible global effort to stimulate and stabilize the global economy, certain facets of the global economy have reacted positively while others have reacted negatively. Obviously, the benefits and failures of this continuing effort to transition through the recent economic malaise have resulted in a number of various advancements and declines over the years. It is rather interesting how capital has shifted into and out of various markets, segments, commodities and other forms in an effort to chase opportunity and returns while it appears the fundamental components of the global economy are still somewhat weak.
Next, in Part II of this article, we’ll take a look at some of the winners and losers over the past 10 to 20+ years as a series of global economic events continue to roil the global markets and we’ll discuss what we believe may become the final transitional phase of this global event.
MORE WARNING SIGNS AND TRADES TO BE AWARE OF: GOLD, SILVER, MINERS, AND S&P 500
In early June I posted a detailed video explaining in showing the bottoming formation and gold and where to spot the breakout level, I also talked about crude oil reaching it upside target after a double bottom, and I called short term top in the SP 500 index. This was one of my premarket videos for members it gives you a good taste of what you can expect each and every morning before the Opening Bell. Watch Video Here.
I then posted a detailed report talking about where the next bull and bear markets are and how to identify them. This report focused mainly on the SP 500 index and the gold miners index. My charts compared the 2008 market top and bear market along with the 2019 market prices today. See Comparison Charts Here.
On June 26th I posted that silver was likely to pause for a week or two before it took another run up on June 26. This played out perfectly as well and silver is now head up to our first key price target of $17. See Silver Price Cycle and Analysis.
More recently on July 16th, I warned that the next financial crisis (bear market) was scary close, possibly just a couple weeks away. The charts I posted will make you really start to worry. See Scary Bear Market Setup Charts.
Kill two birds with one stone and subscribe for two years to get yourFREE PRECIOUS METAL and get enough trades to profit through the next metalsbull market and financial crisis!
Copper is a fairly strong measure of the strength and capacity of the global economy and global manufacturing. Right now, Copper has been under quite a bit of pricing pressure and has fallen from levels above $4.50 (near 2011) to levels near $2.55. Most recently, Copper has rotated higher to levels near $3.25 after President Trump was elected on November 2016, yet has recently fallen as trade and global economic concerns become more intense.
This should be viewed as a strong warning sign that institutional traders and investors are very concerned that the future economic and manufacturing activities throughout the world are continuing to contract. Copper is used in various forms throughout all types of manufacturing and consumer products, such as computers, building & infrastructure, electronics, chemical & medical use as well as automobile and aircraft manufacturing. It makes sense that copper prices would be a leading indicator for much of the global economy and relate to economic output and capacity.
Copper Monthly Long Term Chart
As the US/China trade war continues and we enter the final stretch of the US Presidential election cycle, we believe that copper will breakdown below the $2.50 level and attempt to identify past support levels below slightly $1.50 over the next 6 to 12+ months. We believe the next big move in commodities will be a contraction move where certain commodities (mostly manufacturing & industrial related) will collapse as the world focuses on two of the most important events that are about to conclude in 16+ months: the US Presidential elections and the Global Trade/Economic issues.
Copper Monthly Pennant Pattern
The breakdown in commodity prices as related to slower expectations and global economic demand may see a dramatic downside move or may see a more measured “slide” towards the $1.45 level (much like what we saw happen between 2013 and 2016). Overall, though, we believe the downside price move outweighs the upside at this time – unless some type of dramatic resolution to the US/China trade issues and global economic slowdown are ended.
We’ve also highlighted an extended long-term Pennant/Flag formation in Copper that should provide further insight as to the range of price rotation before the bigger breakdown in price occurs. This pennant formation will likely contain the immediate price range/rotation over the next few months to between $2.30 to $3.00. Should price break below the $2.25 level within the next 2~6+ months, then we would expect an immediate downside move towards the $1.50 level.
CONCLUDING THOUGHTS:
Following the core commodities as related to global economic and manufacturing demand and capacity are key elements to understanding how traders and investors are viewing the future expectations for the global markets. Commodities like Copper, Gold, Silver, Oil, Natural Gas and others can often be leading indicators related to global economic output and expectations. We urge all traders to prepare for a broader market contraction event over the next 6 to 12+ months based on our research that suggests Copper is setting up for a breakdown move.
Following the core commodities as related to global economic and manufacturing demand and capacity are key elements to understanding how traders and investors are viewing the future expectations for the global markets. Commodities like Copper, Gold, Silver, Oil, Natural Gas, and others can often be leading indicators related to global economic output and expectations. We urge all traders to prepare for a broader market contraction event over the next 6 to 12+ months based on our research that suggests Copper is setting up for a breakdown move.
These global market price swings in 2019 and 2020 are going to be huge events that will present incredible opportunities for skilled technical traders. You don’t want to miss out on the opportunity these types of big moves present.
Recently warning that the next financial crisis (bear market) was scary close, possibly just a couple weeks away. The charts I posted will make you really start to worry. See Scary Bear Market Setup Charts.
I then posted a detailed report talking about where the next bull and bear markets are and how to identify them. This report focused mainly on the SP 500 index and the gold miners index. My charts compared the 2008 market top and bear market along with the 2019 market prices today. See Comparison Charts Here.
On June 26th I posted that silver was likely to pause for a week or two before it took another run up on June 26. This played out perfectly as well and silver is now head up to our first key price target of $17. See Silver Price Cycle and Analysis.
Kill two birds with one stone and subscribe for two years to get yourFREE PRECIOUS METAL and get enough trades to profit through the next metalsbull market and financial crisis!
This week – August 11 through August 17 – central banks from 5 countries or jurisdictions are scheduled to decide on monetary policy: Namibia, Mozambique, Norway, Uganda and Mexico.
Following table includes the name of the country, the date of the next policy decision, the current policy rate, the result of the last policy decision, the change in the policy rate year to date, and the rate one year ago.
The table is updated when the latest decisions are announced and can always accessed by clicking on This Week.
By CentralBankNews.info The Central Bank of Honduras left its monetary policy rate steady at 5.75 percent, saying inflation is expected to remain within the bank’s tolerance range by the end of this year and then converge to its middle point by the end of 2020. Inflation in Honduras eased for the second consecutive month to 4.69 percent in July from to 4.8 percent in June and 5.14 percent in May to within the central bank’s target range of 4.0 percent, plus/minus 1 percentage point. In a statement issued on Aug. 9, following a meeting of the open market commission on Aug.5, the bank added core inflation also slowed from the previous two months, partly due to the lower impact of indirect changes in residential electricity rates. Domestic economic activity continued to slow in June, according to the monthly IMAE index, mainly due to a moderation of growth in the manufacturing industry which was partly offset by a good performance by the financial intermediation and telecommunications sector. As of July 31, Honduras’ net international reserves eased to $5.068.3 billion, or the equivalent of 5.08 months of imports, from $5.071.6 billion on June 12, but were up $200 million on an annual basis due to higher remittances and the lower cost of imports, the bank said. Last month the International Monetary Fund (IMF) forecast inflation in Honduras would end this year at 4.4 percent and then ease to 4.2 percent by the end of 2020 while the outlook remains subject to downside risks from lower global growth, terms of trade shocks, tighter global financial conditions and uncertainties from trade tensions and U.S. immigration policies. The IMF’s executive board, which in July approved a 2-year standby credit facility for Honduras, commended authorities’ recent measures to modernize the central bank’s policy framework and make the exchange rate regime more flexible by reducing foreign exchange surrender requirements. The IMF also encouraged the central bank to gradually move toward exchange rate flexibility and efforts to strengthen the bank’s operational autonomy and governance with a view toward transitioning to inflation targeting. The IMF forecast economic growth in Honduras this year of 3.4 percent, down from an estimated 3.7 percent last year, and 3.5 percent in 2020. The Honduran lempira trades around 24.5 to the U.S. dollar and has gradually depreciated in recent years.
Here are the latest links to our coverage of the Commitment of Traders data changes.
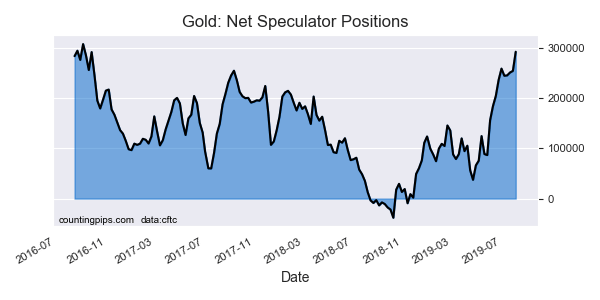
This week in the COT data, precious metals speculators pushed their positive sentiment sharply higher for Gold again this week. Gold positions rose for the 9th time in the past 10 weeks and have gained by a total of +205,857 net contracts over just that period.
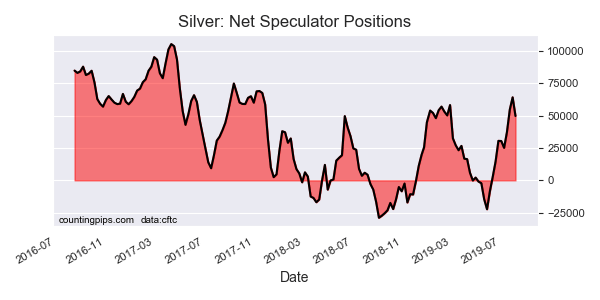
Silver bets, meanwhile, cooled off this week after rising for the previous three weeks in a row (to the best level since November 2017).
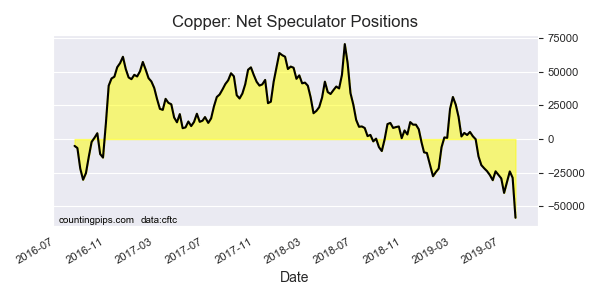
Copper speculator positions stand in stark contrast to the current Gold and Silver sentiment. Specs raised their bearish bets by the most on record for one week (by -29,694 contracts) and the overall net position fell to a new all-time record high bearish position of -58,449 contracts.
In currencies, the USD Index speculators once again boosted their bullish bets for a sixth straight week. Speculators also continued to push British pound sterling more bearish for an 8th straight week and for the 11th time out of the past 12 weeks.
Japanese yen bets improved for a 3rd week and rose into bullish territory (+10,561 contracts) for the first time in 60 weeks joining USD Index, MXN and the CAD on the bullish side.
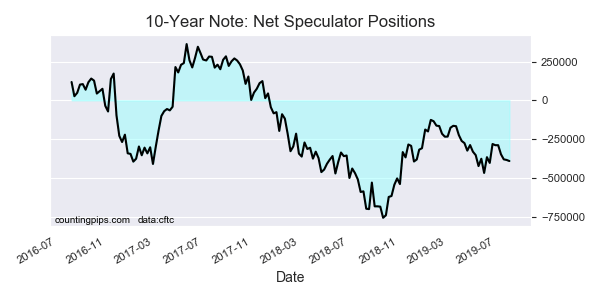
The 10-Year Bond speculators continued their bearish ways (despite the 10-year bond’s bullish ways) and raised bearish bets for a 4th week. Usually reliable trend-followers, the speculators have not been that this year.
The WTI Crude Oil speculators reduced their bullish bets again this week for a 3rd straight week.
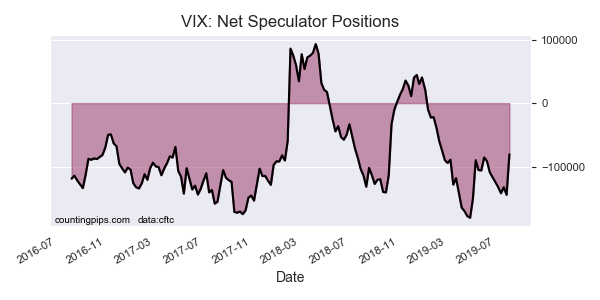
Finally, VIX speculators very sharply cut their bearish bets this week as risk off and volatility reined for the first two days of the week. The speculative bearish position had been rising consistently higher and gained in the previous nine of out eleven weeks before this week’s sharp turnaround.
Large currency speculators advanced their net positions in the US Dollar Index futures markets this week, according to the latest Commitment of Traders (COT) data released by the Commodity Futures Trading Commission (CFTC) on Friday. See full article.
The large speculator contracts of WTI crude futures totaled a net position of 375,641 contracts, according to the latest data this week. This was a change of -11,650 contracts from the previous weekly total. See full article.
Large speculator contracts of the 10-Year Bond futures totaled a net position of -390,886 contracts, according to the latest data this week. This was a change of -7,044 contracts from the previous weekly total. See full article.
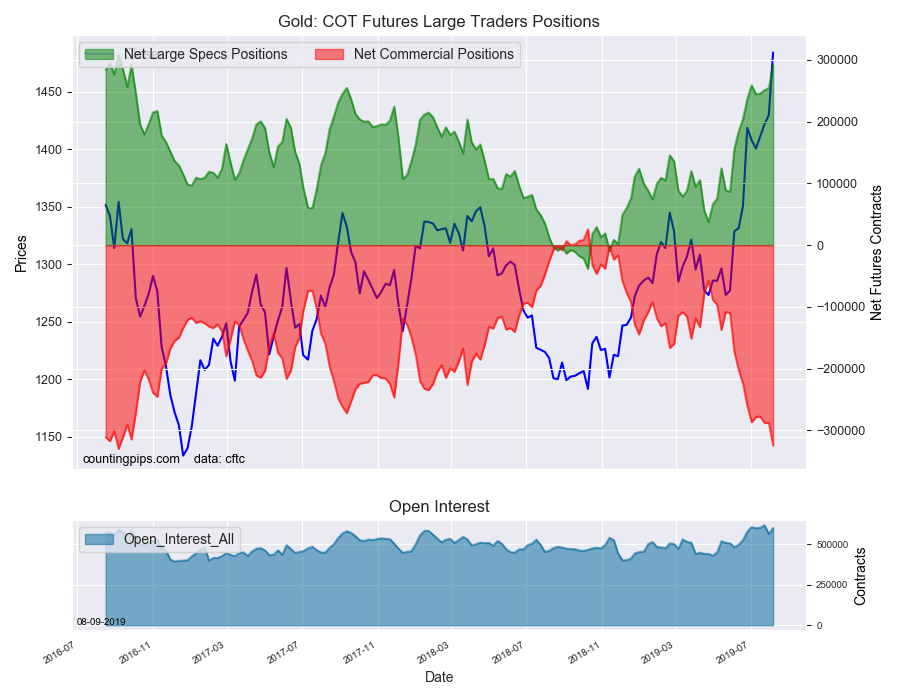
Large precious metals speculator contracts of the Gold futures totaled a net position of 292,545 contracts, according to the latest data this week. This was a change of 38,157 contracts from the previous weekly total. See full article.
Large stock market volatility speculator contracts of the VIX futures totaled a net position of -80,581 contracts, according to the latest data this week. This was a change of 63,733 contracts from the previous weekly total. See full article.
Large precious metals speculator contracts of the silver futures totaled a net position of 49,832 contracts, according to the latest data this week. This was a change of -14,465 contracts from the previous weekly total. See full article.
Metals speculator contracts of the copper futures totaled a net position of -58,449 contracts, according to the latest data this week. This was a change of -29,694 contracts from the previous weekly total. See full article.
*COT Report: The COT data, released weekly to the public each Friday, is updated through the most recent Tuesday (data is 3 days old) and shows a quick view of how large speculators or non-commercials (for-profit traders) were positioned in the futures markets.
The CFTC categorizes trader positions according to commercial hedgers (traders who use futures contracts for hedging as part of the business), non-commercials (large traders who speculate to realize trading profits) and nonreportable traders (usually small traders/speculators).
Large currency speculators continued to increase their bullish positions in the US Dollar Index futures markets this week while Japanese yen bets popped into an overall bullish position, according to the latest Commitment of Traders (COT) data released by the Commodity Futures Trading Commission (CFTC) on Friday.
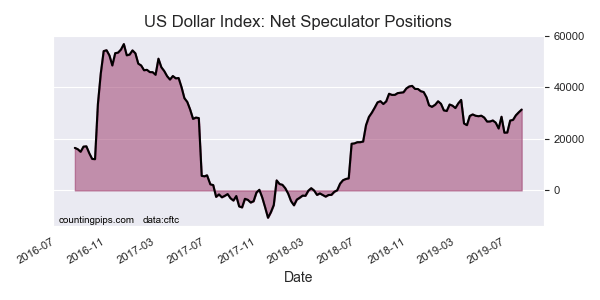
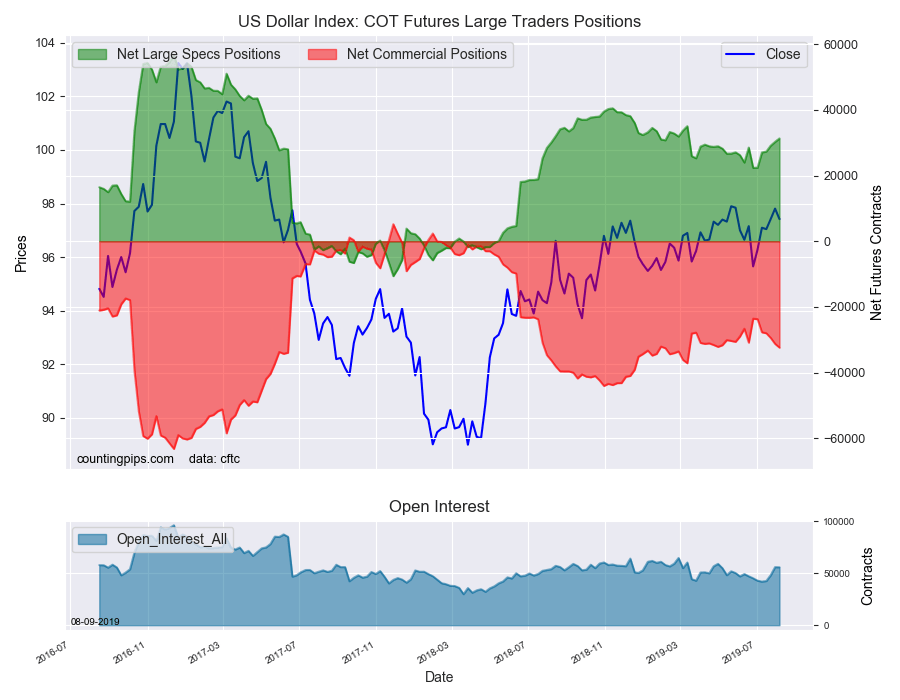
The non-commercial futures contracts of US Dollar Index futures, traded by large speculators and hedge funds, totaled a net position of 31,329 contracts in the data reported through Tuesday August 6th. This was a weekly lift of 1,046 contracts from the previous week which had a total of 30,283 net contracts.
This week’s net position was the result of the gross bullish position (longs) going up by just 26 contracts (to a weekly total of 49,331 contracts) but was helped out by the gross bearish position (shorts) which decreased by -1,020 contracts on the week (to a total of 18,002 contracts).
Speculators boosted their bullish bets for the sixth straight week and for the ninth time out of the past twelve weeks. The current standing for USD Index speculators is above the +30,000 net contract threshold for a second straight week and is at the most bullish level since March 12th.
Individual Currencies Data this week: (Also See Charts Below)
In the other major currency contracts data, we saw two substantial changes (+ or – 10,000 contracts) in the speculators category this week.
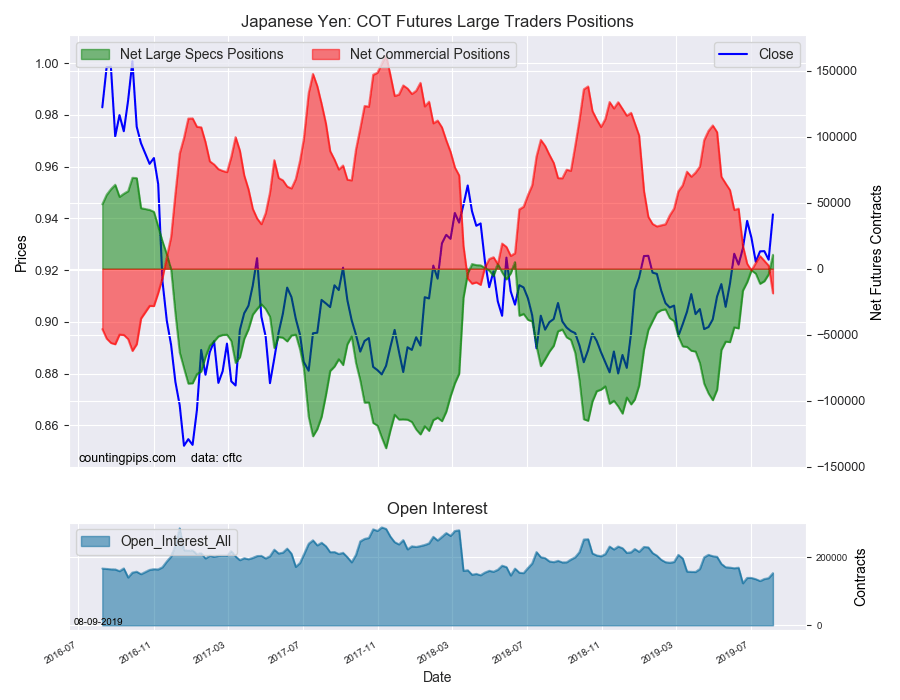
Japanese Yen positions rose this week (+14,779 contracts) for a 3rd straight week and went from an overall bearish position into a bullish position for the first time since June 12th of 2018 (a span of 60 weeks). The yen has been receiving growing positive sentiment in recent months due to its safe haven status and now joins the US Dollar Index, Mexican peso and the Canadian dollar with overall bullish speculator positions.
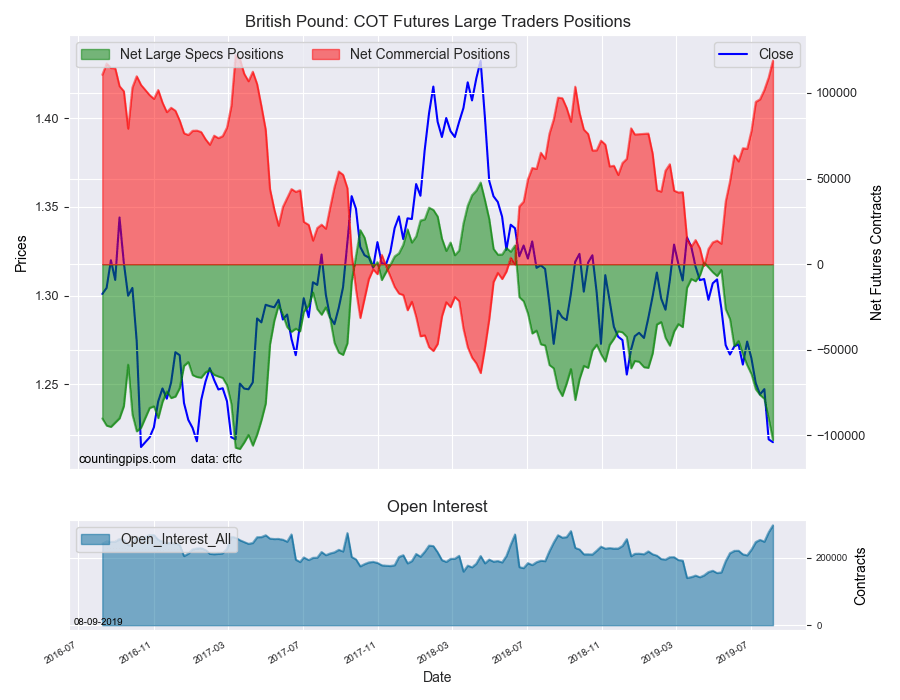
British pound sterling positions went further bearish (-12,552 contracts) for an eighth straight week and for the eleventh time out of the past twelve weeks. Speculators have added -99,384 contracts to their bearish positions in just the past twelve weeks as sentiment for the GBP has crumbled. The current standing is now at the most bearish level since April 11th of 2017 when the net position totaled -105,901 contracts.
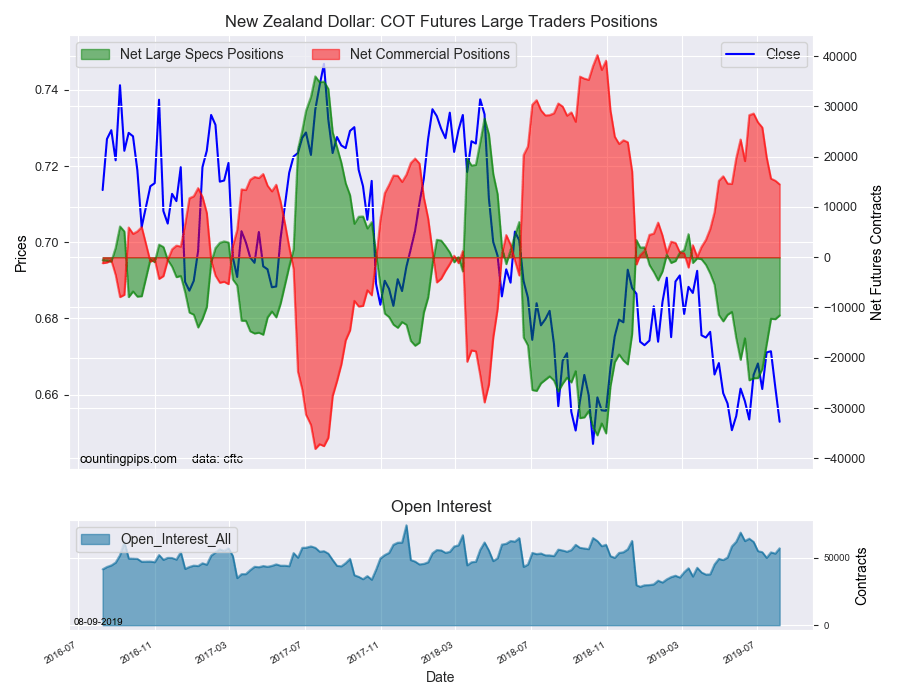
Overall, the major currencies that saw improving speculator positions this week were the US dollar index (1,046 weekly change in contracts), Euro (9,973 weekly change in contracts), Japanese yen (14,779 contracts), Canadian dollar (2,444 contracts) and the New Zealand dollar (755 contracts).
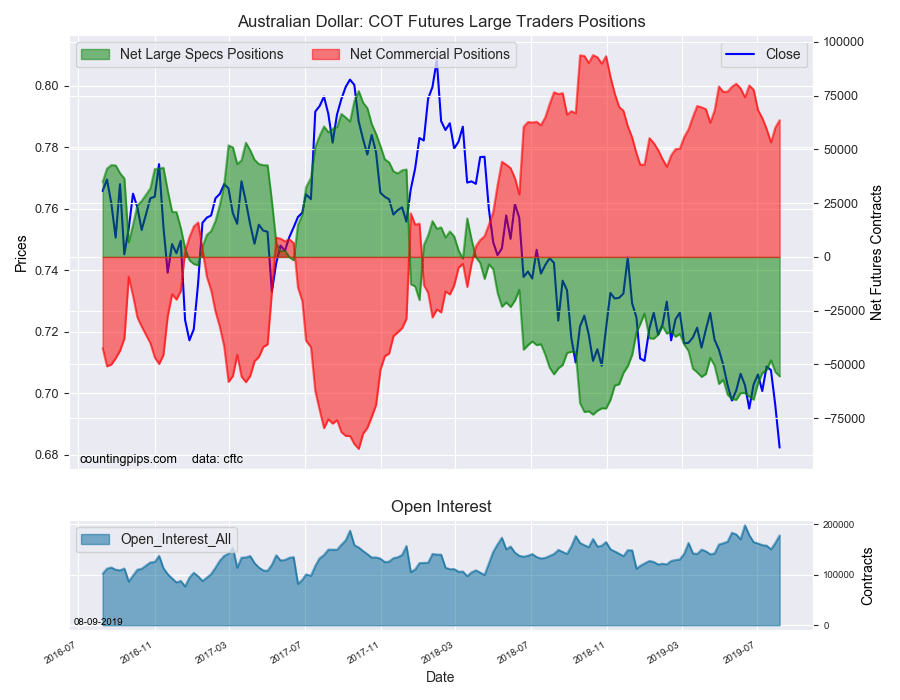
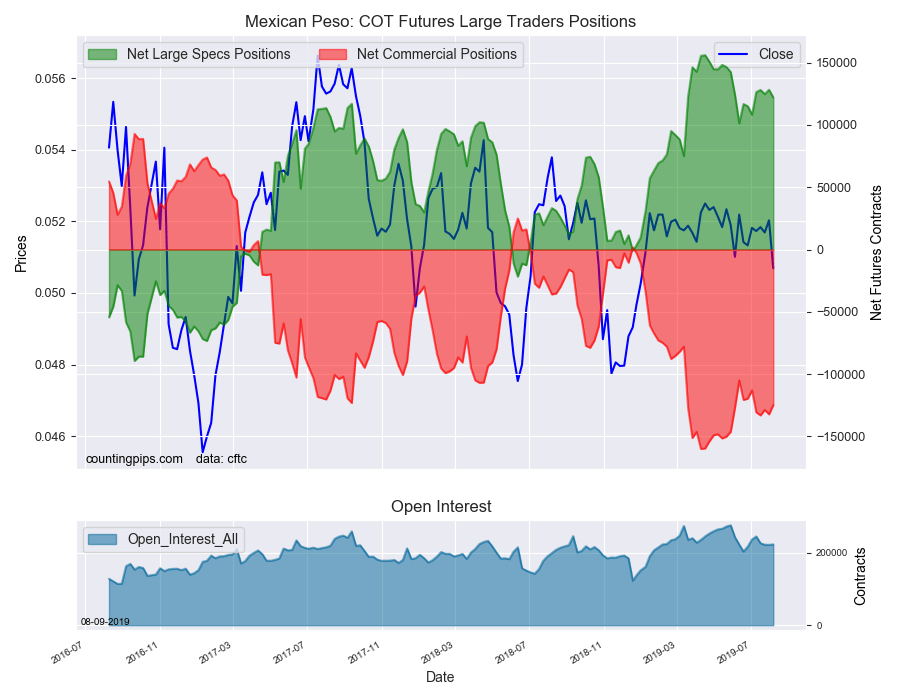
The currencies whose speculative bets declined this week were the British pound sterling (-12,552 contracts), Swiss franc (-1,943 contracts), Australian dollar (-2,069 contracts) and the Mexican peso (-6,199 contracts).
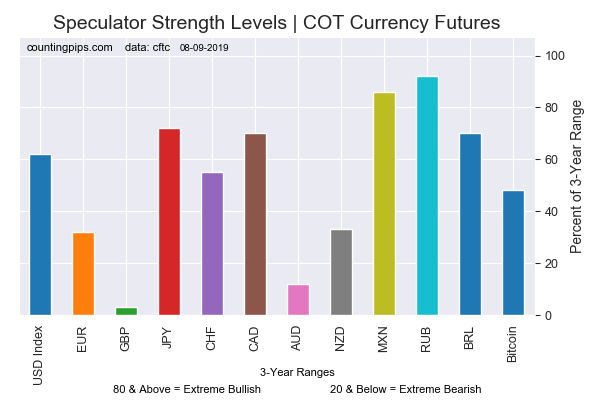
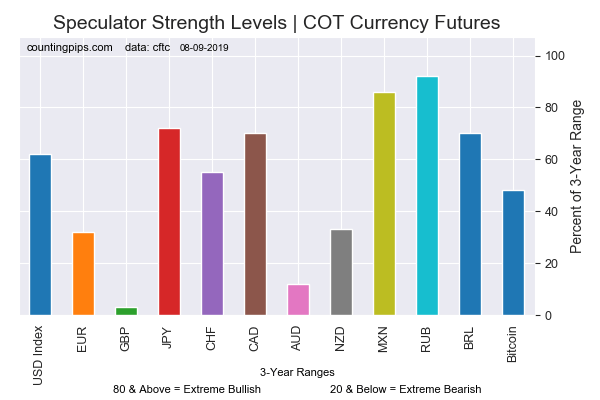
Current Strength of Each Currency compared to their 3-Year Range
See the table and individual currency charts below.
Table of Large Speculator Levels & Weekly Changes:
Currency
Net Speculator Position
Specs Weekly Change
USD Index
31,329
1,046
EuroFx
-44,010
9,973
GBP
-102,702
-12,552
JPY
10,561
14,779
CHF
-16,431
-1,943
CAD
24,166
2,444
AUD
-55,511
-2,069
NZD
-11,564
755
MXN
122,069
-6,199
This latest COT data is through Tuesday and shows a quick view of how large speculators or non-commercials (for-profit traders) were positioned in the futures markets. All currency positions are in direct relation to the US dollar where, for example, a bet for the euro is a bet that the euro will rise versus the dollar while a bet against the euro will be a bet that the dollar will gain versus the euro.
Weekly Charts: Large Trader Weekly Positions vs Price
EuroFX:
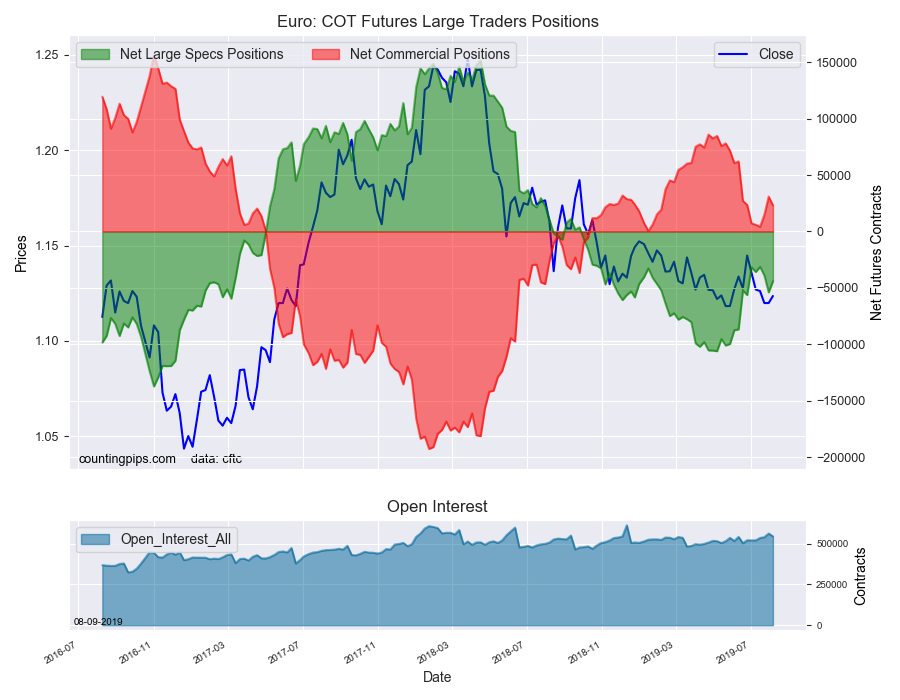
The Euro large speculator standing this week resulted in a net position of -44,010 contracts in the data reported through Tuesday. This was a weekly lift of 9,973 contracts from the previous week which had a total of -53,983 net contracts.
British Pound Sterling:
The large British pound sterling speculator level came in at a net position of -102,702 contracts in the data reported this week. This was a weekly lowering of -12,552 contracts from the previous week which had a total of -90,150 net contracts.
Japanese Yen:
Large Japanese yen speculators recorded a net position of 10,561 contracts in this week’s data. This was a weekly rise of 14,779 contracts from the previous week which had a total of -4,218 net contracts.
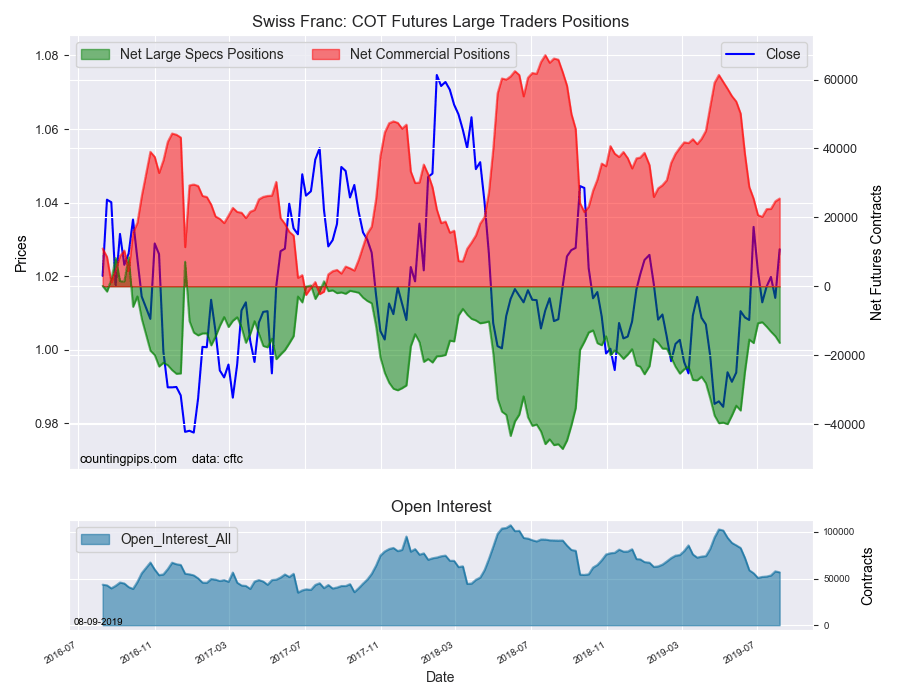
Swiss Franc:
The Swiss franc speculator standing this week came in at a net position of -16,431 contracts in the data through Tuesday. This was a weekly reduction of -1,943 contracts from the previous week which had a total of -14,488 net contracts.
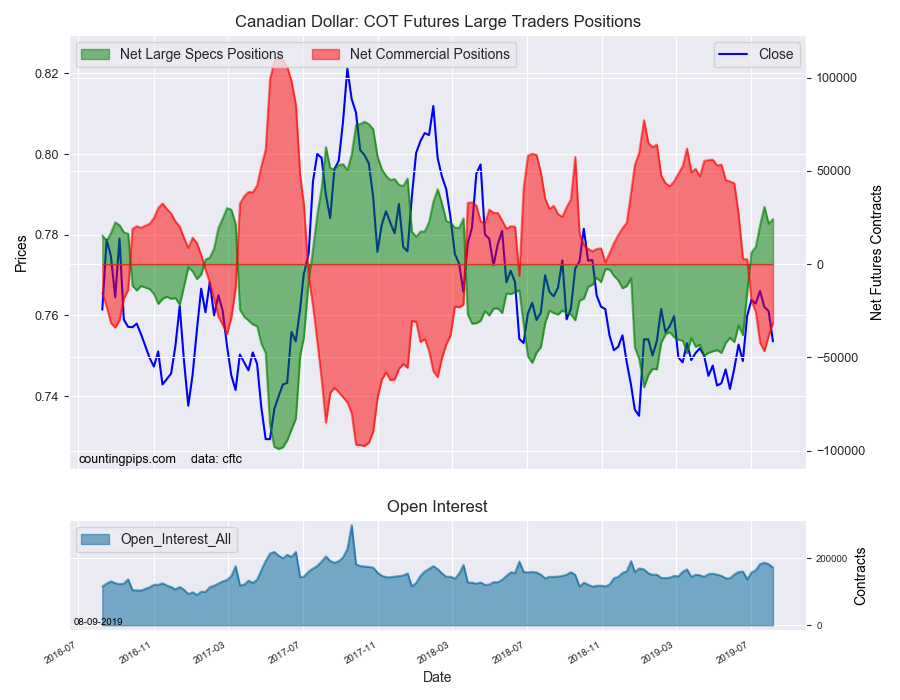
Canadian Dollar:
Canadian dollar speculators reached a net position of 24,166 contracts this week. This was a lift of 2,444 contracts from the previous week which had a total of 21,722 net contracts.
Australian Dollar:
The large speculator positions in Australian dollar futures was a net position of -55,511 contracts this week in the data ending Tuesday. This was a weekly decline of -2,069 contracts from the previous week which had a total of -53,442 net contracts.
New Zealand Dollar:
The New Zealand dollar speculative standing equaled a net position of -11,564 contracts this week in the latest COT data. This was a weekly rise of 755 contracts from the previous week which had a total of -12,319 net contracts.
Mexican Peso:
Mexican peso speculators resulted in a net position of 122,069 contracts this week. This was a weekly reduction of -6,199 contracts from the previous week which had a total of 128,268 net contracts.
*COT Report: The COT data, released weekly to the public each Friday, is updated through the most recent Tuesday (data is 3 days old) and shows a quick view of how large speculators or non-commercials (for-profit traders) were positioned in the futures markets.
The CFTC categorizes trader positions according to commercial hedgers (traders who use futures contracts for hedging as part of the business), non-commercials (large traders who speculate to realize trading profits) and nonreportable traders (usually small traders/speculators).
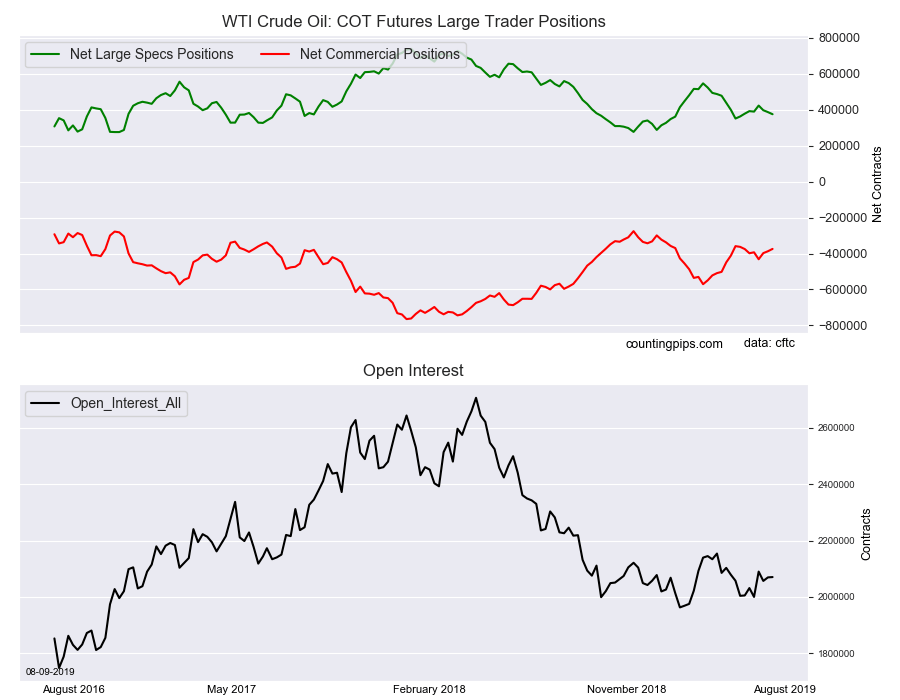
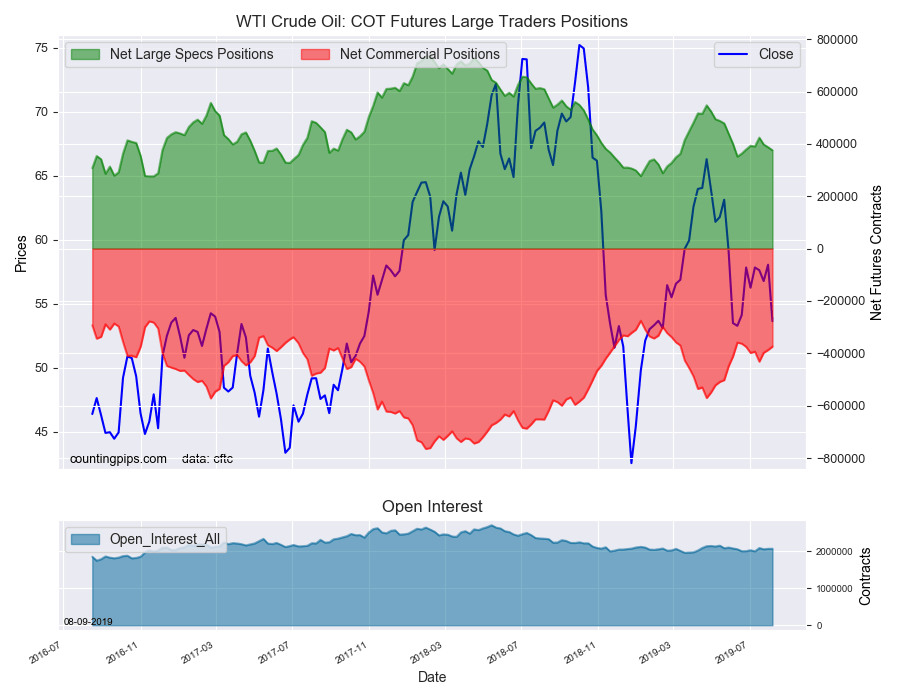
Large energy speculators cut back on their bullish net positions in the WTI Crude Oil futures markets this week, according to the latest Commitment of Traders (COT) data released by the Commodity Futures Trading Commission (CFTC) on Friday.
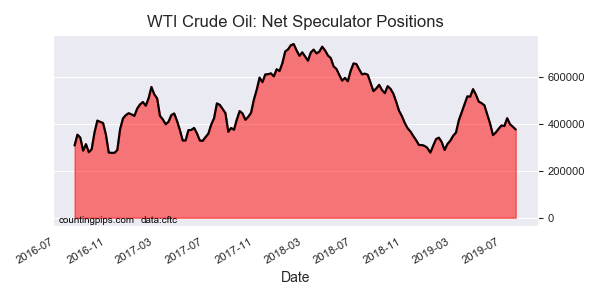
The non-commercial futures contracts of WTI Crude Oil futures, traded by large speculators and hedge funds, totaled a net position of 375,641 contracts in the data reported through Tuesday August 6th. This was a weekly decrease of -11,650 net contracts from the previous week which had a total of 387,291 net contracts.
The week’s net position was the result of the gross bullish position (longs) advancing by just 686 contracts (to a weekly total of 540,924 contracts) while the gross bearish position (shorts) rose by 12,336 contracts on the week (to a total of 165,283 contracts).
Speculative bullish positions declined for a third straight week this week and for the fourth time in the past five weeks. The crude oil position remains bullish but has fallen under the average position for 2019 (+401,007 contracts) for a third straight week.
WTI Crude Oil Commercial Positions:
The commercial traders position, hedgers or traders engaged in buying and selling for business purposes, totaled a net position of -374,089 contracts on the week. This was a weekly rise of 12,978 contracts from the total net of -387,067 contracts reported the previous week.
WTI Crude Oil Futures:
Over the same weekly reporting time-frame, from Tuesday to Tuesday, the WTI Crude Oil Futures (Front Month) closed at approximately $53.63 which was a drop of $-4.42 from the previous close of $58.05, according to unofficial market data.
*COT Report: The COT data, released weekly to the public each Friday, is updated through the most recent Tuesday (data is 3 days old) and shows a quick view of how large speculators or non-commercials (for-profit traders) as well as the commercial traders (hedgers & traders for business purposes) were positioned in the futures markets.
The CFTC categorizes trader positions according to commercial hedgers (traders who use futures contracts for hedging as part of the business), non-commercials (large traders who speculate to realize trading profits) and nonreportable traders (usually small traders/speculators).
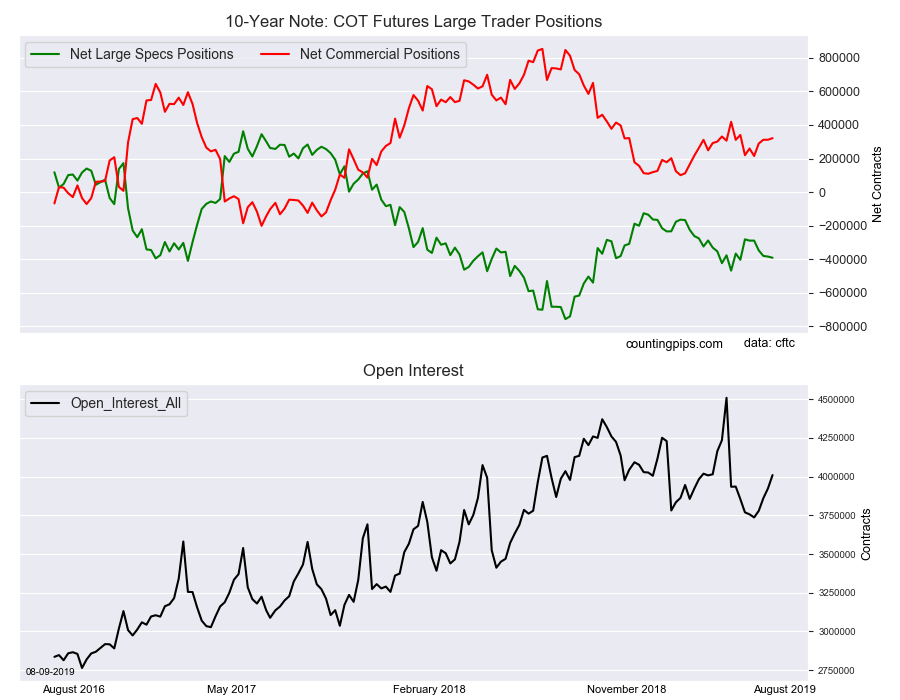
Large bond speculators raised their bearish net positions in the 10-Year Note futures markets once again this week, according to the latest Commitment of Traders (COT) data released by the Commodity Futures Trading Commission (CFTC) on Friday.
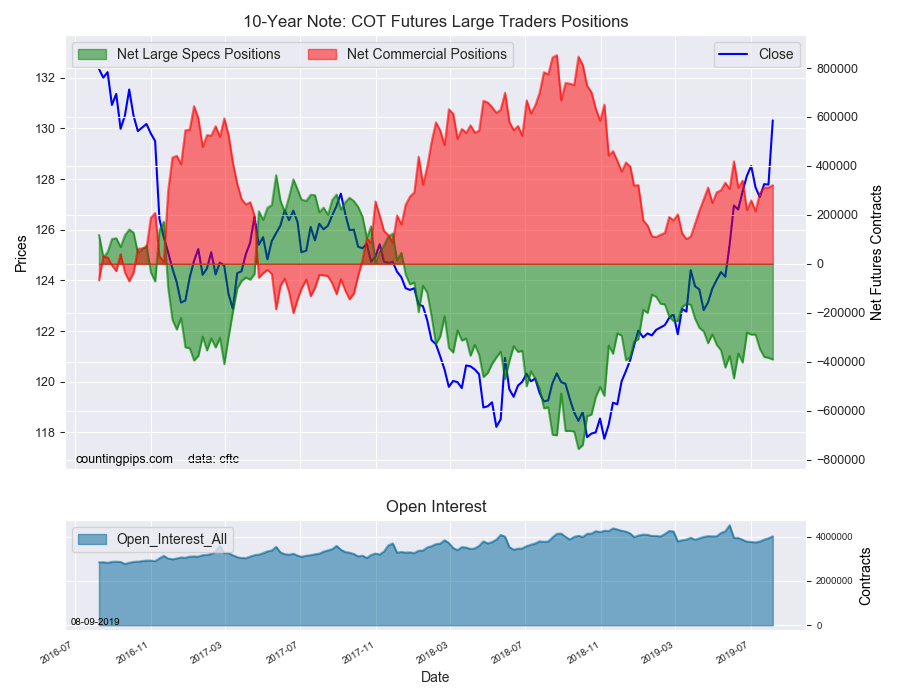
The non-commercial futures contracts of 10-Year Note futures, traded by large speculators and hedge funds, totaled a net position of -390,886 contracts in the data reported through Tuesday August 6th. This was a weekly change of -7,044 net contracts from the previous week which had a total of -383,842 net contracts.
The week’s net position was the result of the gross bullish position (longs) falling by -34,857 contracts (to a weekly total of 658,446 contracts) which overcame a decline in the gross bearish position (shorts) by -27,813 contracts for the week (to a total of 1,049,332 contracts).
Speculators increased their bearish bets for a fourth straight week and for the fifth time out of the last six weeks (also 15 times out of last 20 weeks). Specs have consistently been bearish on the 10-year note this year and have been consistently on the wrong side of this market as the 10-year note has surged due to safe haven demand and concerns over the economy.
The speculator’s total net position was a total of -188,068 contracts on January 8th (this year’s first release) compared to the current net position of -390,886 contracts on August 6th. Meanwhile, the yield on the 10-year note was as high as 2.75 percent on January 8th (yield up, bond prices down) but has sharply deteriorated since then and currently the yield is sitting at 1.75 percent (yield down, bond prices up) and even reached as low as 1.59 percent earlier this week.
10-Year Note Commercial Positions:
The commercial traders position, hedgers or traders engaged in buying and selling for business purposes, totaled a net position of 321,413 contracts on the week. This was a weekly gain of 9,495 contracts from the total net of 311,918 contracts reported the previous week.
10-Year Note Futures:
Over the same weekly reporting time-frame, from Tuesday to Tuesday, the 10-Year Note Futures (Front Month) closed at approximately $130.31 which was an uptick of $2.53 from the previous close of $127.78, according to unofficial market data.
*COT Report: The COT data, released weekly to the public each Friday, is updated through the most recent Tuesday (data is 3 days old) and shows a quick view of how large speculators or non-commercials (for-profit traders) as well as the commercial traders (hedgers & traders for business purposes) were positioned in the futures markets.
The CFTC categorizes trader positions according to commercial hedgers (traders who use futures contracts for hedging as part of the business), non-commercials (large traders who speculate to realize trading profits) and nonreportable traders (usually small traders/speculators).
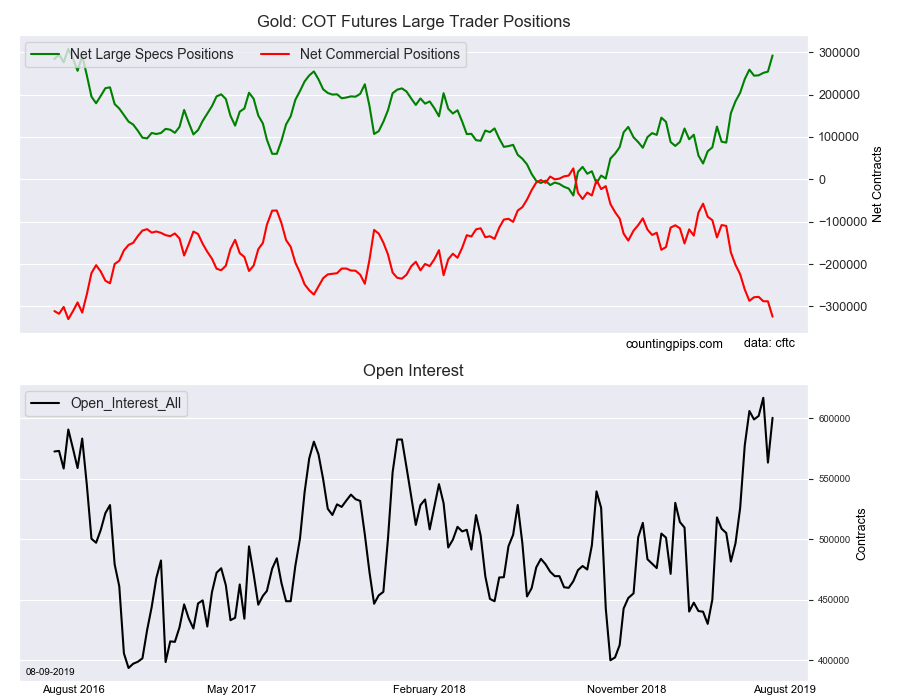
Large precious metals speculators continued to raise their bullish net positions higher in the Gold futures markets this week, according to the latest Commitment of Traders (COT) data released by the Commodity Futures Trading Commission (CFTC) on Friday.
The non-commercial futures contracts of Gold futures, traded by large speculators and hedge funds, totaled a net position of 292,545 contracts in the data reported through Tuesday August 6th. This was a weekly gain of 38,157 net contracts from the previous week which had a total of 254,388 net contracts.
The week’s net position was the result of the gross bullish position (longs) going up by 38,344 contracts (to a weekly total of 350,558 contracts) while the gross bearish position (shorts) edged up by just 187 contracts on the week (to a total of 58,013 contracts).
Gold speculators added to their bullish sentiment for a fourth straight week and for the ninth time out of the past ten weeks. The gold position has now risen by a total of +205,857 net contracts in just the past ten weeks.
The bullish level is currently at the highest standing since September 6th of 2016 when the net position had a total of +307,860 contracts.
Gold Commercial Positions:
The commercial traders position, hedgers or traders engaged in buying and selling for business purposes, totaled a net position of -324,325 contracts on the week. This was a weekly fall of -36,358 contracts from the total net of -287,967 contracts reported the previous week.
Gold Futures:
Over the same weekly reporting time-frame, from Tuesday to Tuesday, the Gold Futures (Front Month) closed at approximately $1484.20 which was an uptick of $54.50 from the previous close of $1429.70, according to unofficial market data.
*COT Report: The COT data, released weekly to the public each Friday, is updated through the most recent Tuesday (data is 3 days old) and shows a quick view of how large speculators or non-commercials (for-profit traders) as well as the commercial traders (hedgers & traders for business purposes) were positioned in the futures markets.
The CFTC categorizes trader positions according to commercial hedgers (traders who use futures contracts for hedging as part of the business), non-commercials (large traders who speculate to realize trading profits) and nonreportable traders (usually small traders/speculators).