Namibia’s central bank lowered its benchmark repo rate by 25 basis points to 6.50 percent, saying economic growth, inflation and growth in credit to individuals slowed during the first six months and “key risks to the global outlook remain, amongst others, escalating trade and geopolitical tensions and higher policy uncertainty across many countries, including Brexit.” It is Bank of Namibia’s (BON) first rate cut since August 2017 and brings the rate back to its level in January 2016 before the central bank embarked on a tightening cycle that lasted 17 months. The bank’s monetary policy committee said the decision to cut the rate was “to support domestic economic activity and to maintain the one-to-one link between the Namibia Dollar and the South African Rand.” Since BON’s previous policy meeting in June, the South African Reserve Bank (SARB) on July 18 lowered its policy rate by 25 basis points, its first cut since March 2018 and one of 31 central banks that lowered their rates in the third quarter of this year in response to slowing global growth. As of July 31, Namibia’s stock of international reserves rose to N$35.2 billion from N$34.1 billion in June, enough to cover 4.8 months of imports, and a level BON said was sufficient to protect the peg of the Namibia Dollar to the Rand and to meet its international financial obligations. The Namibian dollar trades at a rate of 1:1 to the rand, which has fallen against the U.S. dollar since SARB’s rate cut. This has pulled down the Namibian dollar, which fell 1.4 percent today after the rate cut to 15.34 to the U.S. dollar to be down 5.9 percent this year. In April BON lowered its forecast for economic growth this year to 0.3 percent from December’s forecast of 1.5 percent and said today the domestic economy was projected to remain weak in 2019. Last year Namibia’s economy shrank for the second consecutive year and in June the International Monetary Fund said it expected growth to “remain mildly negative in 2019, as a poor rain season and reduced diamond production continued to weigh on a tentative recovery.” The central bank said the slowdown in the first six months of this year was reflected in the mining, construction, electricity, and wholesale and retail trade, while the sectors of manufacturing, transport and communication improved as compared to the same 2018 period. Namibia’s gross domestic product contracted 2.0 percent year-on-year in the first quarter of this year, up from 1.9 percent fall in the fourth quarter of 2018 and a 0.2 percent decline in the third quarter of 2018 for a 2018 decline of 0.1 percent after a 0.9 percent fall in 2017. Inflation in Nambia slowed to 3.9 percent in June from 4.1 percent in May and averaged 4.4 percent in the first half, with BON attributing the moderation to a decline in housing inflation. BON forecast average inflation of 4.3 percent in 2019, down from its June forecast of 4.5 percent. While average growth in private sector credit extension (PSCE) rose to 6.9 percent in the first half from 5.9 percent in the same 2018 period, BON said this was mainly due to higher uptake by credit in the retail, real estate, financial and mining sectors. But growth in credit to individuals “slowed somewhat” during the first half, BON added. Together with the country’s ministry of finance, BON revised the country’s loan-to-value (LTV) ratios, with the new maximum LTV for the first, non-primary residence raised to 90 percent from a previous 80 percent. The ratios for second, third and fourth residences were also raised. “At these adjusted levels, the Bank believes that LTVs will continue to shield the financial system from undue risks going forward,” BON said. BON began implementing the macroeconomic tool of LTVs in 2017 to mitigate the impact of an overheating housing market on the financial system. Since then, BON said, there have been developments that warranted a review of this policy, including a significant slowdown in the economy and a sharp correction in the housing market.
The terms of the financing package and the company’s plans for the rest of 2019 are described in an Echelon Wealth Partners report.
In an Aug. 8 research note, Echelon Wealth Partners analyst Ryan Walker reported that Pure Gold Mining Inc. (PGM:TSX.V; PUR:LSE) negotiated a $90 million financing package with Sprott Resource Lending to fund development of an underground mine at the explorer’s Madsen gold project in Red Lake, Ontario.
Composed of a $65 million credit facility and a $25 million callable gold stream, the financing will fully cover building the mine. Pure Gold plans to start development work immediately and anticipates pouring first gold there by year-end 2020. The company already started hiring and is currently formalizing plans for detailed engineering and procurement.
Walker explained the terms of the credit facility and callable gold stream. The credit facility is for seven years and collects interest at a rate of three month LIBOR plus 5.5% during construction, which increases to three month LIBOR plus 6.75% during construction, post completion (defined by successfully completing an agreed completion test).
Sixty-five percent of the total amount advanced must be paid before the facility matures. The principal is to be paid in quarterly installments starting in September 2022. There is the option to repay the outstanding principal and interest without incurring a penalty after August 2022.
As for the callable gold stream, noted Walker, it constitutes 5% of gold production (up to 50,000 ounces) and decreases to 2.5% afterward in return for $25 million upon closing. “The stream includes ongoing payments of 30% of the prevailing spot gold price.” Pure Gold may buy back the stream for $35 million on June 30, 2021 or for $38 million on June 30, 2022.
Sprott also will receive a fixed $10 per ounce payment on the first 500,000 ounces of production. Pure Gold may do away with that payment at any time by paying an early termination fee.
Walker highlighted that while the Canadian gold company advances Madsen, it also intends to continue exploring elsewhere on the property until this December, highlighted Walker. It will concentrate its activities on the Wedge discovery to upgrade Inferred resources there and test along strike and downplunge extensions. It plans limited drilling at Fork and Russet South, including initial drilling at the Fork EXT Target, which is downplunge of Fork. Further, Pure Gold will “continue to advance another 24 high-priority exploration targets across the property,” added Walker.
Echelon trimmed its target price on Pure Gold, which it rates Buy, to CA$1 per share from CA$1.05, primarily to reflect the “higher than previously modelled interest on the recently arranged credit facility plus the introduction of the gold stream,” Walker indicated. Shares are currently trading at around CA$0.65 per share.
Walker concluded his report by noting, “We continue to highlight Madsen’s high-grade nature, potential for solid near-term, high-margin production, and substantial exploration potentialall situated in a prolific Canadian mining camp.”
Disclosure: 1) Doresa Banning compiled this article for Streetwise Reports LLC and provides services to Streetwise Reports as an independent contractor. She or members of her household own securities of the following companies mentioned in the article: None. She or members of her household are paid by the following companies mentioned in this article: None. 2) The following companies mentioned in this article are billboard sponsors of Streetwise Reports: None. Click here for important disclosures about sponsor fees. 3) Comments and opinions expressed are those of the specific experts and not of Streetwise Reports or its officers. The information provided above is for informational purposes only and is not a recommendation to buy or sell any security. 4) The article does not constitute investment advice. Each reader is encouraged to consult with his or her individual financial professional and any action a reader takes as a result of information presented here is his or her own responsibility. By opening this page, each reader accepts and agrees to Streetwise Reports’ terms of use and full legal disclaimer. This article is not a solicitation for investment. Streetwise Reports does not render general or specific investment advice and the information on Streetwise Reports should not be considered a recommendation to buy or sell any security. Streetwise Reports does not endorse or recommend the business, products, services or securities of any company mentioned on Streetwise Reports. 5) From time to time, Streetwise Reports LLC and its directors, officers, employees or members of their families, as well as persons interviewed for articles and interviews on the site, may have a long or short position in securities mentioned. Directors, officers, employees or members of their immediate families are prohibited from making purchases and/or sales of those securities in the open market or otherwise from the time of the interview or the decision to write an article until three business days after the publication of the interview or article. The foregoing prohibition does not apply to articles that in substance only restate previously published company releases.
Disclosures from Echelon Wealth Partners, Pure Gold Mining Inc., August 8, 2019
Echelon Wealth Partners compensates its Research Analysts from a variety of sources. The Research Department is a cost centre and is funded by the business activities of Echelon Wealth Partners including, Institutional Equity Sales and Trading, Retail Sales and Corporate and Investment Banking.
I, Ryan Walker, hereby certify that the views expressed in this report accurately reflect my personal views about the subject securities or issuers. I also certify that I have not, am not, and will not receive, directly or indirectly, compensation in exchange for expressing the specific recommendations or views in this report.
Important Disclosures: Is this an issuer related or industry related publication? Issuer.
Does the Analyst or any member of the Analysts household have a financial interest in the securities of the subject issuer? No
The name of any partner, director, officer, employee or agent of the Dealer Member who is an officer, director or employee of the issuer, or who serves in any advisory capacity to the issuer. No
Does Echelon Wealth Partners Inc. or the Analyst have any actual material conflicts of interest with the issuer? No
Does Echelon Wealth Partners Inc. and/or one or more entities affiliated with Echelon Wealth Partners Inc. beneficially own common shares (or any other class of common equity securities) of this issuer which constitutes more than 1% of the presently issued and outstanding shares of the issuer? No
During the last 12 months, has Echelon Wealth Partners Inc. provided financial advice to and/or, either on its own or as a syndicate member, participated in a public offering, or private placement of securities of this issuer? No
During the last 12 months, has Echelon Wealth Partners Inc. received compensation for having provided investment banking or related services to this Issuer? No
Has the Analyst had an onsite visit with the Issuer within the last 12 months? Yes. July 31, 2018 – Madsen Mine Site Underground and Surface Infrastructure and ancillary buildings
Has the Analyst or any Partner, Director or Officer been compensated for travel expenses incurred as a result of an onsite visit with the Issuer within the last 12 months? No
Has the Analyst received any compensation from the subject company in the past 12 months? No
Is Echelon Wealth Partners Inc. a market maker in the issuers securities at the date of this report? No
Between the two main schools of thought for analyzing the financial markets, technical analysis often trumps fundamental analysis. If you look around, technical analysis is more widely quoted than fundamentals. And almost any forex trader you meet is more likely to learn about the technical indicators rather than the fundamental analysis.
Part of this is because traders prefer to make a quick buck rather than wait and invest in the long term.
Technical analysis is the study of past price history to predict future price action. In combination with the volatility in the currency markets and the use of leverage to help traders maximize their profits, traders make their gains.
You will, therefore, see many traders focusing on building a trading system, or looking for an automated solution. They do this to take advantage of technical analysis for the mere purpose of maximizing the returns from forex trading.
The Problems with Fundamental Analysis
Meanwhile, fundamental analysis is often relegated to the background.
This is primarily because fundamental analysis is regarded as being complex. Plus, the impetus to using fundamental analysis is also lesser.
Traders ignore fundamental analysis, or perhaps give it less relevance as it is the study of the factors behind the price behavior. After all, who would want to spend time learning what the reason is behind every move?
The markets are irrational most of the time. Thus, in a way, technical analysis makes more sense.
With most of the traders in forex being day traders, it is not surprising that most of the media focuses on the technical charts. However, as a quick comparison, if you look to the equity markets, you will find that fundamentals are more often quoted.
This is due to the very nature of the equity markets. The stock markets usually have a majority of investors who are long term investors (via the 401k plans, etc.).
Thus, fundamentals tend to outshine technical analysis when it comes to stocks. To add to this, big names such as Warren Buffet who make use of value investing, a niche form of valuation. And this also adds to the weight of the argument.
Secrets of Fundamental Analysis
That being said, fundamental analysis does have its own flair. It can make you gain an edge in the market.
Simply put, fundamental analysis is all about forming an opinion about the markets. Sometimes, the opinions formed can be contrary to the general expectations. Here are a few things to help you get started when it comes to fundamental analysis.
You can call these secrets, but it is just common sense.
Buy the rumor, sell the news: This phrase is something every forex trader has come across. But if you give it some thought, you will see that in many cases, the markets have a different perception than the policymakers. When there is a big disconnect between the expectations and the actual outcome, you can gain an edge here.
Look at the longer term trends: Fundamentals often hit the headlines, but for the wrong reasons. For example, the February jobs report made big headlines. If you read that news release in isolation, you would be led into believing that the US economy just jumped off a cliff. But the long term trends give you better insights.
Everything is inter-related: With the markets today, what happens in Asia has an impact in Europe and in other markets too. With the markets so closely interlinked, fundamental analysis can help you in anticipating some big moves. For example, a dovish message from the Fed often pushes US equities higher. You can also expect to see a similar performance from Asian and even European equity markets too.
In Summary
The above three points might seem minor, but when applied correctly, they can yield a ton of information. Traders often want to find an edge in the markets. They focus on gaining this edge by testing new methods of both trading and of technical analysis.
But if you spend some time trying to understand the fundamentals, there is a good chance that you will find an edge. The trick, of course, is in trusting yourself with your analysis. This is something that will come only with practice.
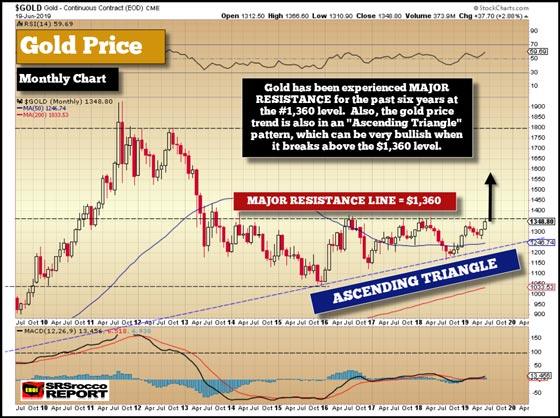
After six long years, the precious metals are finally setting up for BIG MOVES higher. Even though the gold price has increased significantly over the past two months, we haven’t seen anything yet. Of course, gold has already enjoyed big moves in other currencies such as the British Pound where it has reached an all-time new high.
However, we have to be a bit more patient for gold to reach a new high in the U.S. Dollar as the Federal Reserve has a monopoly on the world’s printing press. But, it is important to understand that gold has broken through a KEY LEVEL and is giving the green light to the market that a new bull market has begun.
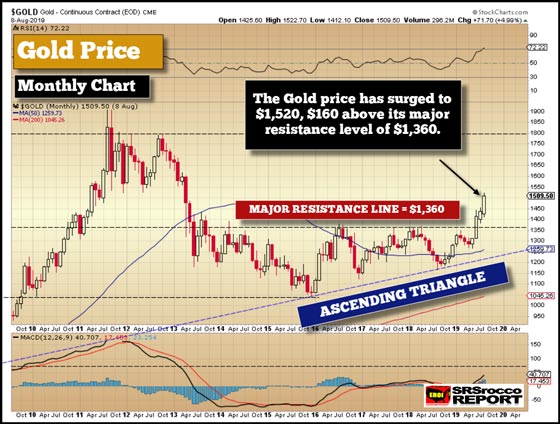
As of trading yesterday, the gold price closed at $1,509, but reached a high of $1,520. Thus, the gold price surged by $160 once it broke above that critical 5-year resistance level:
However, as I stated, this is just the beginning stage for much higher gold prices moving forward. Why? Well, the Fed and Central banks haven’t solved any problems since the 2008 financial crisis. Rather, the central bankers have papered over the problem with money printing and a zero-interest-rate policy. According to a few sources, there are $14 trillion in negative-yielding bonds in the world. Thus, bondholders are paying the central banks to borrow money from them.
Economists and analysts suggest that negative interest rates are a sign that the financial market has entered into unchartered territory. Unfortunately, they don’t understand the TRUE underlying reason for negative interest rates. While some economists have stated that negative interest rates are the central bank’s policy to force investors to put their funds into the economy, the real problem is that global debt is too high and the net energy profit in the system is falling.
I will get into this in more detail in upcoming articles and videos, but put simply, if the NET ENERGY that drives the economy is falling, then the interest rates must fall as well. So, get used to even lower interest rates and even more money printing by the Fed and Central banks. And, as the central banks continue with even lower interest rates and money printing, it means that BIG MOVES in the precious metals are coming.
IMPORTANT: While the precious metals have broken through key levels and will reach new highs in the future, we must understand that CORRECTIONS will take place. We should not be surprised if gold and silver experience significant corrections before moving into the next stage.
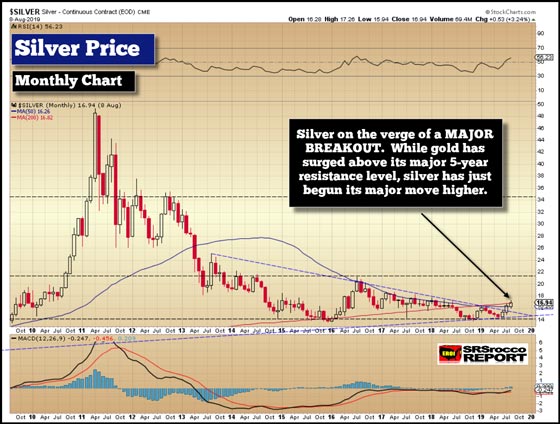
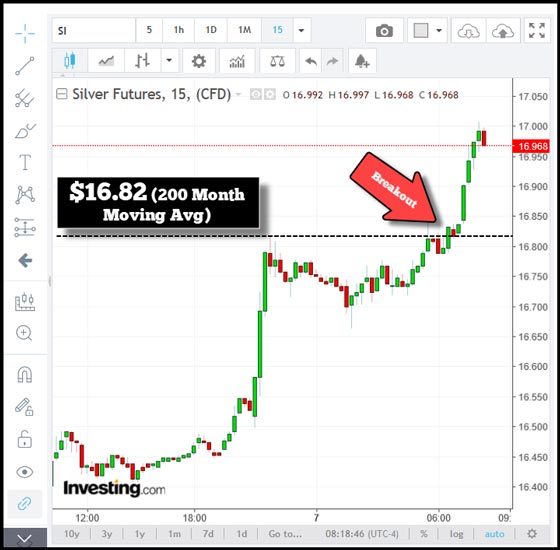
Now, while the gold price has enjoyed a MAJOR BREAKOUT, we are still waiting for silver to make its move. Yes, the silver price has broken above an important symmetrical triangle formation that I wrote about several weeks ago, but it must close significantly higher above its 200 Month Moving Average (MMA) of $16.82 to be in the first stage of a new BULL MARKET:
So, why is this 200 MMA (Red Line) such a critical level? Well, it was the next important level to take out after silver broke through the 50 MMA (Blue Line). I will be doing a new YouTube video on the precious metals this weekend, so please subscribe to my channel to receive updates.
As I have stated several times, while the FUNDAMENTALS are the underlying price drivers, the KEY TECHNICAL LEVELS provide the big punch as Traders, Investors, Hedge Funds, and Institutions all jump aboard. We can clearly see this taking place as silver approached the important 200 MMA. Please look at the following intraday silver price charts:
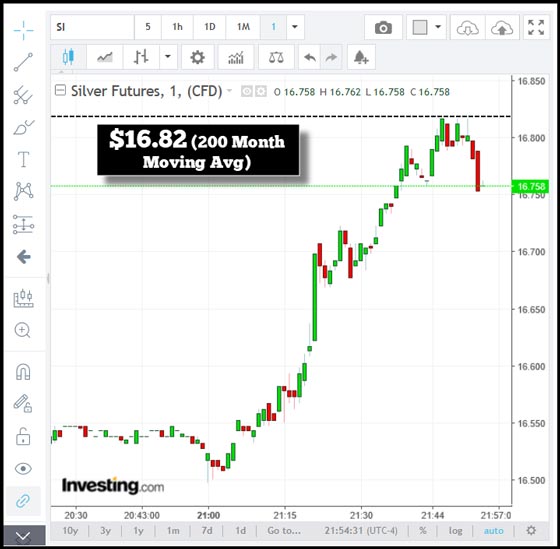
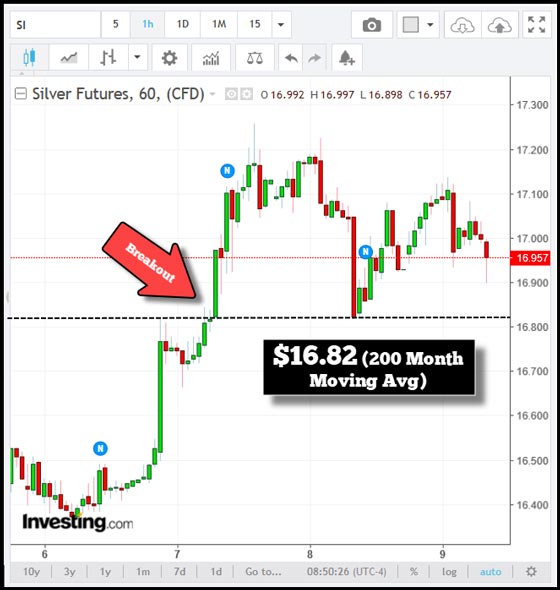
When the silver price first approached that key $16.82 level during Asian trading Tuesday night, it touched it several times and bounced off of it and corrected lower. Then in the next chart, we can see that as the silver price finally broke above that $16.82, it enjoyed a MINI-BREAKOUT to $17.00, and then eventually to $17.20:
Once silver broke above the $16.82 level (200 MMA), we see that it corrected right back down to the same level during trading yesterday (Thursday):
Now, I am going to repeat myself. THERE IS NO COINCIDENCE that silver traded off this important 200 MMA of $16.82. So, these KEY LEVELS mean something to traders and the charts are showing it right in front of our eyes, whether you believe in technical analysis or not.
Thus, when silver broke above that 200 MMA, it quickly shot up to $17.20 as it came on the radar of TRADERS, INVESTORS, HEDGE FUNDS, and INSTITUTIONS. These key levels act as a magnifying glass for the market. When they are broken, we see a HUGE increase in trading volume and investor interest.
I discussed this in my newest interview with Chris Marcus of Arcadia Economics:
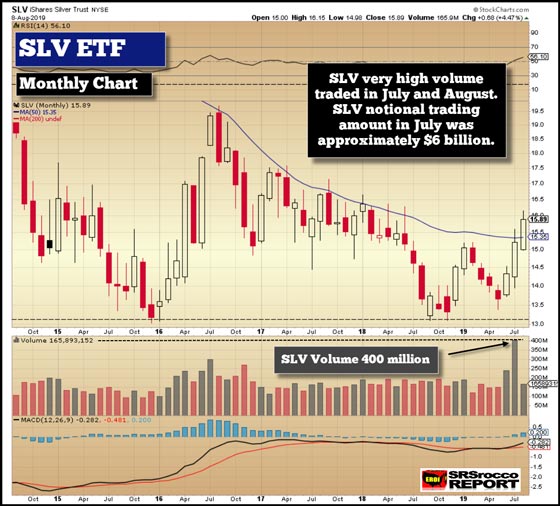
In my interview, I explained that even though the silver price chart had broken through key levels, the Silver SLV ETF didn’t until this week on Tuesday:
We don’t see the daily price action in this monthly chart, but once the SLV broke above its 50 Month Moving Average of $15.35, it jumped to $16.20 before correcting. And, if you notice the trading volume of 400 million shares traded in the SLV ETF in July, it was much higher than the monthly volume in early 2016 when the SLV price went from $13 to $19. Furthermore, the SLV ETF trading volume in August is already at 170 million shares, and we still have three more weeks remaining in the month.
So, this 50 MMA in the SLV ETF will be a KEY LEVEL to remain above this month. Again, I will discuss this in my newest video this weekend. However, if we compare the trading activity of the SLV ETF to ROKU, a new high-tech stock, we can clearly see how insane the market has become:
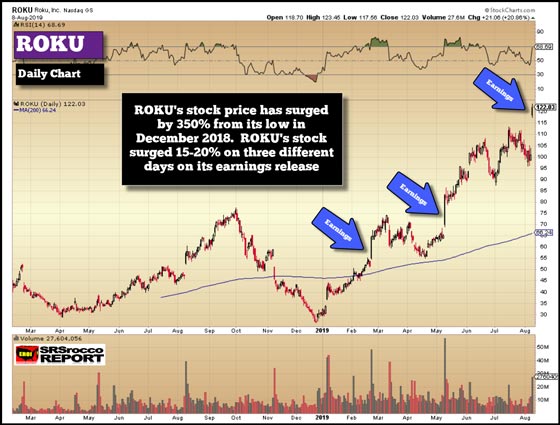
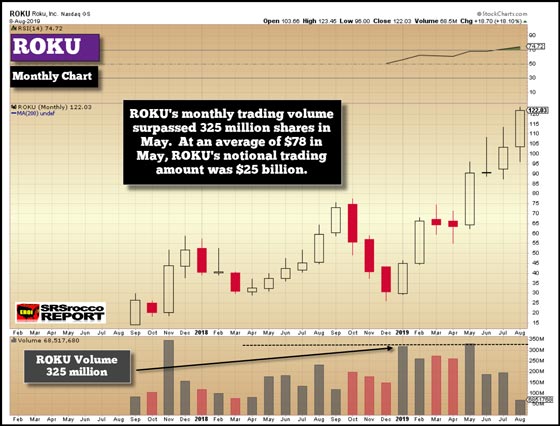
After ROKU, an entertainment streaming content provider, bottomed in December at $27, it exploded 350% to $122 yesterday. All of those large single-day stock price moves occurred after earnings releases. Yesterday, ROKU surged 20% after Q2 2019 results reported a large growth in subscribers. However, the company continues to lose money, which doesn’t seem to be a concern to Wall Street or Investors anymore. It’s all about the growth, forget about profits or increasing debt levels.
Why would investors pay attention to gold or silver when they can make BIG MONEY in stocks like ROKU?? And, if we look at ROKU’s monthly trading volume, it’s right up there with the SLV ETF:
In May, ROKU’s trading volume reached 325 million shares. Thus, ROKU’s notional trading amount was approximately $25 billion in May compared to $6 billion for the SLV ETF in July.
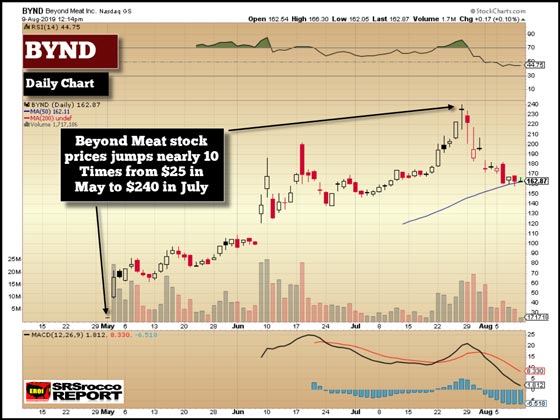
Regardless, investors have gone utterly insane by driving up stocks prices of ROKU and even Beyond Meat, ticker BYND. As we can see in the chart below Beyond Meat’s stock price exploded nearly ten times its IPO price of $25 in May to $240 in July:
When investors are provided with these types of companies to bet on in the GRAND STOCK MARKET CASINO, then it’s no surprise that gold and silver have been overlooked for the past six years. However, that is about to change for the precious metals as the Fed, and Central banks take the next big step to prop up their fiat currencies.
Lastly, while gold and silver are finally showing some life as they break through key levels, we are just in the beginning stages for much higher prices in the future. Please check out my newest Precious Metals video update this weekend.
The Money Metals News Service provides market news and crisp commentary for investors following the precious metals markets.
The U.S. postponed the introduction of new import duties on Chinese goods until December 15, 2019. Within two weeks, additional negotiations will be held on mutual trade. Will the USDJPY quotations grow?
Earlier, the United States was going to introduce a 10% duty on imports of Chinese goods worth $ 300 billion a year from September 1, 2019. Now this question has been postponed to December. By the end of August, the parties will conduct telephone calls. Investors regarded this message as a real opportunity to mitigate the US-China foreign trade conflict. This weakened the Japanese yen, which was previously seen as a safe haven currency and appreciably strengthened. Earlier, Deputy Minister of Finance for International Affairs Yoshiki Takeuchi said that his department and the Central Bank of Japan could take measures to prevent the yen from becoming too strong. A regular meeting of the Bank of Japan will be held on September 19, 2019, at which additional statements can be made to weaken the yen. On August 14, data on industrial orders will be released in Japan, and on August 15, industrial production for June. They can affect the dynamics of the yen.
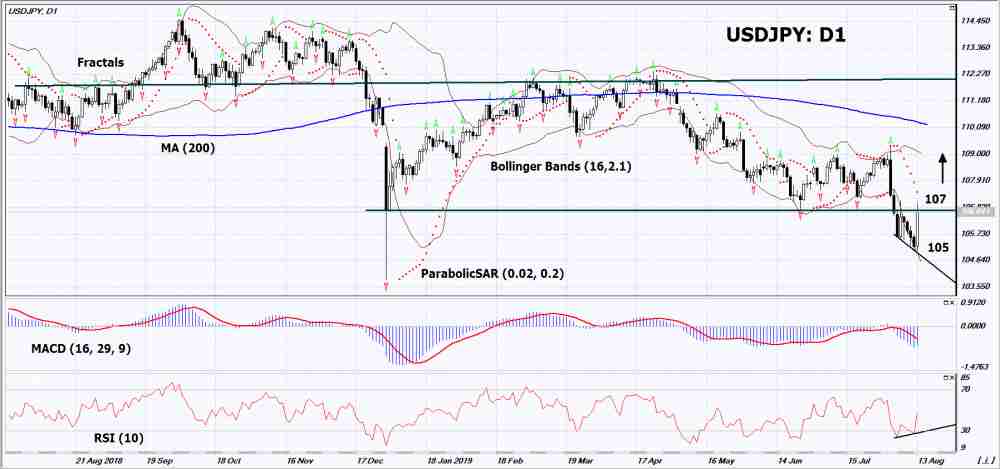
On the daily timeframe USDJPY: D1 trying to return to the previous wide neutral range. Various technical analysis indicators have generated uptrend signals. Further growth of quotations is possible if negative macroeconomic data are published in Japan and positive in the USA, as well as normalization of US-Chinese foreign trade relations.
The Parabolic indicator demonstrates a downtrend signal. It can be considered as an additional resistance level that must be overcome to open a buy position.
The Bolinger bands greatly expanded, indicating high volatility.
The RSI indicator is below the 50 mark. It has formed a divergence to increase.
The bullish momentum may develop if USDJPY exceeds its last maximum and the Parabolic signal: 107. This level can be used as an entry point. The initial stop lose may be placed below the last minimum: 105. After opening a pending order, stop shall be moved following the Bollinger and Parabolic signals to the next fractal minimum. Thus, we are changing the potential profit/loss to the breakeven point. More risk-averse traders may switch to the 4-hour chart after the trade and place a stop loss moving it in the direction of the trade. If the price meets the stop level (105) without reaching the order (107), we recommend to cancel the order: the market sustains internal changes that were not taken into account.
Traders saw strong reversals across the board yesterday as the market reacted to the unexpected news from the US. Some of the goods due to be under new tariffs from September 1st will now be exempt until a later date. In a statement released yesterday, US Trade Representative Robert Lighthizer explained that the US is delaying imposing tariffs on some imports from China until 15 December because of
“health, safety, national security and other factors”.
Trump’s “Gift” To US Shoppers
Among the products due to have tariffs postponed are mobile phones, laptops, video game consoles, some toys, computer monitors, and certain footwear and clothing. Speaking with reporters as he left a rally in Pittsburgh, President Trump said “We’re doing this for the Christmas season,” to avoid hurting US shoppers.
The news was welcomed by traders following the recent deterioration in relations between the US and China and the growing fear that trade talks would be abandoned. Two weeks ago, Trump unexpectedly announced a fresh set of 10% tariffs due to be applied to a further $300 billion of Chinese goods as of September 1st.
Lists published by the USTR show that a broad category of items taken off a $200bn tariff list last year are due to be subject to the 10% tariff as of 1st September. This list includes major products such as smartwatches by Apple and Fitbit, smart speakers by Amazon and Apple and Alphabet’s Google and Bluetooth connected devices.
News of the fresh tariffs was met with immediate counteraction from china. This in turn sharply devalued the Yuan. It sent USDCNH over 7 for the first time since the global financial crisis in 2008. The US then responded by issuing a statement labeling China a currency manipulator. The PBoC then issued its own statement in response denying the claims and accusing the US of maliciously targeting them.
Trade Talk Hopes
However, the announcement of a delay to some of the tariffs has been met by a wave of relief across asset markets. Although just a first step, traders are hopeful that this move will be enough to keep trade talks intact. Indeed, the more optimistic among forecasters are now hoping that China will be ready to work with the US properly to avoid the tariffs which could be scrapped altogether.
Trump Under Fire Over Hong Kong Protests
However, there are those who have criticized Trump for backing down from China. They have said that he has now given them an edge in the negotiations. This also comes at a time when the president is under scrutiny over his soft dealings with China regarding the treatment of protesters in Hong Kong. Writing on Twitter, Trump said of the situation:
“I hope it works out for everybody including China. I hope it works out peacefully, nobody gets hurt, nobody gets killed.”
This tweet was followed by Trump saying that US intelligence
“has informed us that the Chinese Government is moving troops to the border with Hong Kong. Everyone should be calm and safe!“
Technical Perspective
The cross-market reaction saw a bounce in equities, which sapped the safe-haven flows into JPY and gold. This sent USDJPY surging higher. Price has recovered strongly off the 105.03 lows. However, for now, the move has been capped by the 106.77 level resistance. Price is stalling in the middle of the bearish channel from year to date highs. While below here, focus is on further downside in the near term. A move above here will bring the channel top into focus next, with the next big structural level above at 108.99.
HMRC’s bid to claw back taxes on cryptocurrencies demonstrates the digital assets are the future of money, affirms the CEO of one of the world’s largest independent financial advisory organizations.
Nigel Green, chief executive of deVere Group, which launched the cryptocurrency app deVere Crypto in early 2018, is speaking out after it is revealed that HM Revenue & Customs is asking cryptocurrency exchanges to reveal customers’ names and transaction histories, in a bid to recover unpaid taxes.
Mr Green comments: “This move by the UK’s tax authority cannot be viewed as anything other than another clear sign that cryptocurrencies like Bitcoin, Ethereum and XRP are not only part of mainstream finance, but also the future of money.”
He continues: “There is a continual and increasingly rapid slew of indicators that digital currencies are gaining traction in our increasingly digitalised world –much to the chagrin of financial traditionalists like Warren Buffet and Donald Trump.
“For instance, financial regulators around the world are preparing and looking to implement regulatory guidelines for cryptocurrencies in order to keep pace with countries like Japan, Malta, Switzerland and South Korea which already have pro-crypto policies.
“Most major financial institutions globally already have or are preparing to establish crypto desks.
“A growing number of retail and institutional investors are piling into the crypto sector market.
“Tech giants, like Facebook, are planning to launch their own cryptocurrency – and where Facebook goes other tech monoliths will follow.
“And just this week, China’s central bank, which oversees the world’s second largest economy, has revealed it will soon launch its own state-backed cryptocurrency following five years of research.”
When Donald Trump last month criticised Bitcoin, the deVere CEO said the president was “placing himself on the wrong side of history.”
He went on to note: “Standing on the sidelines, or worse looking backwards, on the issue of cryptocurrencies – which are redefining and reshaping the financial system – is a baffling approach for the leader of the world’s largest economy to take.”
Mr Green concludes: “HMRC’s growing interest in cryptocurrencies underscores that their public influence and appeal is growing.”
About:
deVere Group is one of the world’s largest independent advisors of specialist global financial solutions to international, local mass affluent, and high-net-worth clients. It has a network of more than 70 offices across the world, over 80,000 clients and $12bn under advisement.
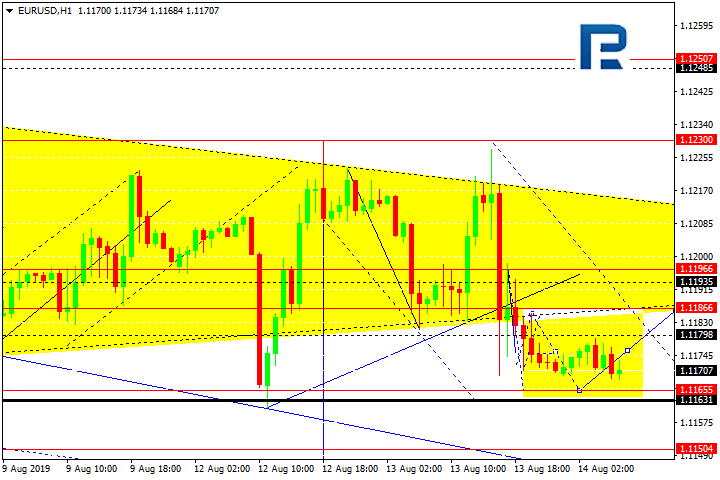
EURUSD is moving downwards. Possibly, today the pair may reach 1.1166 and then start a new correction towards 1.1190. After that, the instrument may resume trading downwards with the short-term target at 1.1144.
GBPUSD, “Great Britain Pound vs US Dollar”
GBPUSD is still moving downwards. Today, the pair may reach 1.2027 and then start another correction towards 1.2080. Later, the market may continue trading inside the downtrend with the target at 1.1955.
USDCHF, “US Dollar vs Swiss Franc”
USDCHF is forming the ascending impulse towards 0.9780. After that, the pair may be corrected to reach 0.9720 and then continue moving upwards with the target at 0.9873.
USDJPY, “US Dollar vs Japanese Yen”
USDJPY is moving upwards to reach 107.07. After that, the instrument may start a new correction towards 106.00 and then form one more ascending structure with the target at 107.22.
AUDUSD, “Australian Dollar vs US Dollar”
AUDUSD is forming the third ascending wave. Possibly, today the pair may break 0.6808 and then continue moving upwards with the target at 0.6830. After that, the instrument may return to 0.6808 to test it from above and then resume trading upwards to reach the short-term target at 0.6870.
USDRUB, “US Dollar vs Russian Ruble”
USDRUB has finished the first descending impulse at 64.90. Today, the pair may be corrected to reach 65.40 and then resume trading downwards to break 64.84. Later, the market may continue moving inside the downtrend with the short-term target at 64.28.
XAUUSD, “Gold vs US Dollar”
Gold has completed the first descending impulse at 1480.00. Today, the pair may start a new correction to reach 1509.00 and then form one more descending structure with the target at 1463.20.
BRENT
Brent has reached the predicted upside target. Possibly, today the pair may be corrected towards 60.20 and then start a new ascending wave with the target at 62.34. After that, the instrument may resume trading downwards to reach 58.50.
Attention! Forecasts presented in this section only reflect the author’s private opinion and should not be considered as guidance for trading. RoboForex LP bears no responsibility for trading results based on trading recommendations described in these analytical reviews.
The gold bears have finally caved under the deafening barrage of fiscal and geopolitical catalysts, from Fed hints to intensely brewing conflict with Iran. But there is one key trend that stands to push gold up beyond $1,700–regardless of the day’s news.
Of course, it’s difficult for the bears to ignore a nearly $50/ounce gain for gold, which is now trading well above its 5-year high.
Not only has the U.S.-Iran conflict reached a boiling point, with Trump readying to deploy an additional 1,000 troops to the Middle East, but the European Central Bank has issued a defiant, dovish tone, saying it won’t hesitate to provide further stimulus: That means rate cuts.
The icing on the gold cake is the US Fed, which has now clearly indicated that it hasn’t abandoned the idea of rate cuts for 2019.
But in this perfect storm for gold prices, EuroSun Mining (TSE:ESM, OTCMKTS:CPNFF) CEO Scott Moore says we’re overlooking a significant trend that will outlast the current geopolitical meltdown and even the Fed’s policies: It’s a global push for de-dollarization.
“Government’s around the world are becoming increasingly wary of the dollar’s hegemony in international trade,” says Moore. “And they’re doing their best to distance themselves from it by using their gold reserves to buy more gold instead.”
This process is already underway mainly in nations with strong anti-U.S. sentiment including Russia, China, Iran, Venezuela, Syria, Turkey, Qatar, India, Pakistan, Libya, Egypt and the Philippines among others.
Naturally, these countries are turning to gold since the yellow metal is not under lock-and-key like the greenback and other electronic payment methods.
This trend is abundantly clear when you look at central banks’ buying activity.
According to the World Gold Council, central banks purchased nearly 70 percent more gold during the first quarter of the year than they did during the previous year’s corresponding period.
That’s the most they bought since the first quarter of 2013.
For EuroSun’s Rovina Valley project in Romania–the largest in-development gold mine in Europe–the de-dollarization drive will been a boon for the 10 million ounces of gold equivalent they’re hoping to get out of the ground in the simple geography of Romania’s prolific Tethyan Gold Belt.
There are plenty of billionaire fund managers who think today’s ‘crazy’ gold prices are just getting started.
Not least among them is Paul Tudor Jones, who says that gold “has everything going for it”, and sees it pushing to $1,700 an ounce “rather quickly”, as he noted in an interview with Bloomberg.
And this is all just thanks to near-term trends wrapped up in the Fed and wild geopolitics.
We’re interested instead in the long-term trend that is says gold will be a major winner of the global de-dollarization trend.
There’s nothing like a sanctions frenzy to create a major uptick in momentum here.
Most notably, Russia and China have pledged to accelerate their de-dollarization strategies because of Trump’s sanctions push. And they’ve reached a deal to use national currencies for bilateral trade. No more U.S. dollar, then.
So, we’re carefully watching what the central banks are doing.
The latest countries to jump on the de-dollarization bandwagon are Serbia and the Philippines. Serbia is boosting its national gold reserves, increasing them from 20 to 30 tons by the end of this year. It’s shooting for 50 tons by the end of 2020.
Tudor is watching these developments closely, and to him, it suggests an unprecedented shift:
“Remember we’ve had 75 years of expanding globalization and trade, and we built the machine around the belief that’s the way the world’s going to be. Now all of a sudden it’s stopped, and we are reversing that,” he told Bloomberg.
“When you break something like that, the consequences won’t be seen at first, it might be seen one year, two years, three years later. That would make one think that it’s possible that we go into a recession. That would make one think that rates in the US go back toward the zero bound and in the course of that situation, gold is going to scream. ”
EuroSun’s (TSE:ESM, OTCMKTS:CPNFF) Moore agrees: “What’s happening with Iran right now will only further the de-dollarization push. The dollar isn’t necessarily king anymore, and gold is more than ready to resume its rightful place on the safe haven throne.”
Five gold companies to watch as more countries push for de-dollarization:
Yamana Gold (NYSE:AUY) (TSE:YRI)
Yamana, has recently completed its Cerro Moro project in Argentina, giving its investors something major to look out for. The company plans to ramp up its gold production by 20% through 2019 and its silver production by a whopping 200%. Investors can expect a serious increase in free cash flow if precious metal prices remain stable.
Recently, Yamana signed an agreement with Glencore and Goldcorp to develop and operate another Argentinian project, the Agua Rica. Initial analysis suggests the potential for a mine life in excess of 25 years at average annual production of approximately 236,000 tonnes (520 million pounds) of copper-equivalent metal, including the contributions of gold, molybdenum, and silver, for the first 10 years of operation.
The agreement is a major step forward for the Agua Rica region, and all of the miners working on it.
Eldorado Gold Corp. (NYSE:EGO) (TSE:ELD)
This Canadian mid-cap miner has assets in Europe and Brazil and has managed to cut cost per ounce significantly in recent years. Though its share price isn’t as high as it once was, Eldorado is well positioned to make significant advancements in the near-term.
In 2018, Eldorado produced over 349,000 ounces of gold, well above its previous expectations, and is set to boost production even further in 2019. Additionally, Eldorado is planning increased cash flow and revenue growth this year.
Eldorado’s President and CEO, George Burns, stated: “As a result of the team’s hard work in 2018, we are well positioned to grow annual gold production to over 500,000 ounces in 2020. We expect this will allow us to generate significant free cash flow and provide us with the opportunity to consider debt retirement later this year. ”
Barrick Gold Corp. (NYSE:GOLD) (TSE:ABX) and Goldcorp Inc. (NYSE:GG):
All eyes are on the billion-dollar partnership these two giants are forming in Chile’s gold belt. Goldcorp is putting up $1 billion to get in on this deal as miners scramble for new sources of growth. This joint venture will see the two giant miners operate three properties in Chile’s Maricunga region, and these will be major catalysts for both.
Newmont Mining Corp (NYSE:NEM) Founded over 100 years ago, Newmont Mining Corporation (NYSE:NEM) is one of the leading mining companies in the world. The company holds assets in Peru, Australia, Ghana, Indonesia, Mexico, and around the United States. Primarily focusing on gold and copper, Newmont has steadily carved out a name for itself among those in the industry. In Q1 2017 alone, the company secured over 1.2M ounces of gold. Definitely noteworthy for investors.
Wheaton is a company with its hands in operations all around the world. As one of the largest ‘streaming’ companies on the planet, Wheaton has agreements with 19 operating mines and 9 projects still in development. Its unique business model allows it to leverage price increases in the precious metals sector, as well as provide a quality dividend yield for its investors.
Recently, Wheaton sealed a deal with Hudbay Minerals Inc. relating to its Rosemont project. For an initial payment of $230 million, Wheaton is entited to 100 percent of payable gold and silver at a price of $450 per ounce and $3.90 per ounce respectively.
Randy Smallwood, Wheaton’s President and Chief Executive Officer explained, “With their most recent successful construction of the Constancia mine in Peru, the Hudbay team has proven themselves to be strong and responsible mine developers, and we are excited about the same team moving this project into production. Rosemont is an ideal fit for Wheaton’s portfolio of high-quality assets, and when it is in production, should add well over fifty thousand gold equivalent ounces to our already growing production profile.”
Centerra Gold Inc. (OTCMKTS: CAGDF) (TSE:CG)
Centerra Gold is a Canada-based gold miner with flagship assets, the Mount Milligan Mine and the Kumtor Mine which are located in Canada and the Kyrgyz Republic respectively. It also owns the Öksüt Gold Mine in Turkey, making it the single-largest North American gold company operating in Asia, with over 22 years of experience in the region.
Centerra’s biggest selling points, however, are its strong balance sheets. For 2018, the company reported over $100 million in net earnings, generating over $217 million from cash operations, exceeding many analyst’s expectations.
Scott Perry, President and Chief Executive Officer of Centerra stated, “As a result of the strong fourth quarter operating performance at both operations, the Company exceeded its overall 2018 production and cost guidance producing 729,556 ounces of gold at an all-in sustaining cost on a by-product basis of $754 per ounce sold, beating the low-end of our all-in-sustaining cost guidance for the year.
IMPORTANT NOTICE AND DISCLAIMER
Oilprice.com, Advanced Media Solutions Ltd, and their owners, managers, employees, and assigns (collectively “the Publisher”) has not been paid to publish this communication. This communication is not, and should not be construed to be, an offer to sell or a solicitation of an offer to buy any security. The Publisher is not, and does not purport to be, a broker-dealer or registered investment adviser. This communication is not, and should not be construed to be, personalized investment advice directed to or appropriate for any particular investor. Any investment should be made only after consulting a professional investment advisor and only after reviewing the financial statements and other pertinent corporate information about the company.
SHARE OWNERSHIP. The owner of Oilprice.com owns shares of the featured company and is therefore extremely biased and has an incentive to see its stock perform well. The owner of Oilprice.com has no present intention of selling any shares in the near future but also does not assume any obligation to notify the market when it decides to buy or sell shares.
As we can see in the daily chart, the descending tendency has almost reached the post-correctional extension area between 138.2% and 161.8% fibo at 1.2019 and 1.1788 respectively. At the same time, there is a convergence on MACD, which indicates further growth. The resistance is at 1.2395.
The short-term scenario is shown on the H1 chart. Here, there is a convergence, which may indicate a new correction soon. The possible correctional targets may be 23.6%, 38.2%, and 50.0% fibo at 1.2143, 1.2222, and 1.2286 respectively.
EURJPY, “Euro vs. Japanese Yen”
As we can see in the daily chart, after testing the low again, the price has rebounded from it. At the same time, there is a convergence on MACD, which may indicate a possible reverse and a pullback. After breaking the low, the descending tendency may continue towards the post-correctional extension area between 138.2% and 161.8% fibo at 114.34 and 112.09 respectively.
In the H4 chart, the pair has already been corrected to the upside by 23.6%. Judging by the convergence on MACD, the correction may yet continue to reach 38.2%, 50.0%, and 61.8% fibo at 119.74, 120.43, and 121.11 respectively. The support is the low at 117.51.
Attention! Forecasts presented in this section only reflect the author’s private opinion and should not be considered as guidance for trading. RoboForex LP bears no responsibility for trading results based on trading recommendations described in these analytical reviews.