The US dollar is moving in different directions against a basket of currency majors despite the weakness of the US economy. The US bonds yield curve has become inverted for the first time since 2007, indicating a possible recession in the US economy. It means that the two-year US government bonds yield rose above the standard 10-year government bonds yield. Experts forecast that the economic growth in the country may slow down so much that the Fed is likely to be forced to stimulate economic growth by lowering interest rates. At the same time, the US dollar index (#DX) closed the trading session in the positive zone (+0.20%).
The tense trade relations between the US and China are a key reason why the global economy is worsening. The US President hopes that China will be able to resolve the situation in Hong Kong, as well as countries, will come to a trade agreement. Investors following the relevant information on these issues.
The “black gold” prices show negative dynamics. Currently, futures for the WTI crude oil are testing the $54.75 mark per barrel.
Market Indicators
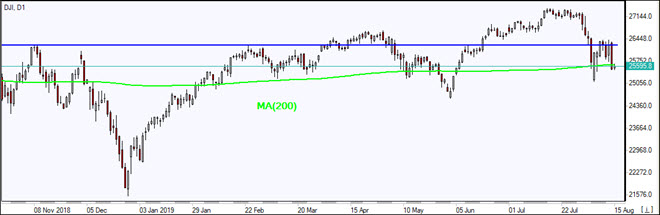
Yesterday, aggressive sales were observed in the US stock markets: #SPY (-2.96%), #DIA (-3.07%), #QQQ (-2.99%).
The 10-year US government bonds yield has collapsed again. At the moment, the indicator is at the level of 1.58-1.59%.
The news feed for 2019.08.15:
– Statistics on retail sales in the UK at 11:30 (GMT+3:00); – Philadelphia Fed manufacturing index at 15:30 (GMT+3:00); – Report on retail sales in the US at 15:30 (GMT+3:00).
The monthly retail sales report for the United States will be released by the Commerce Department today.
The data will provide a glimpse into the strength of US consumer spending at retail outlets during July. The retail sales data comes at a crucial time amid the never-ending US-China trade war.
Economists forecast that headline retail sales rose 0.3% on the month in July. This follows a 0.7% increase in the month before. Excluding autos, monthly retail sales are forecast to rise by 0.4%, the same pace as the previous month.
In June, the year over year growth in retail sales was 3.4%.
U.S. Retail Sales, June 2019
On a monthly basis, retail sales data is recovering from the sluggish growth in the latter part of 2018 and in the first few months of 2019.
Consumer spending, which was averaging around 4.3%, was one of the main contributors to the US GDP in the second quarter of the year. Consumer spending is supported by the strong labor market in the backdrop.
US employers added 164,000 jobs during the month, with the labor force hitting a new high. There was also an increase in average wages. Wages rose 3.2% from the year before. While the annualized pace has flatlined, there was a modest pick up on a month to month basis.
Household savings also got a boost by the stable interest rates and the prospects of a rate cut. Meanwhile, consumer confidence is back to historically high levels.
Consumer Sentiment Firm in July
Consumer sentiment also plays a key role in determining the retail sales figure. Various measures of consumer confidence give a fairly stable picture. This should be supportive of a somewhat modest picture of the retail sales sector.
The Conference Board’s consumer sentiment index showed a slight increase. Consumer confidence rebounded in July, with the index registering a print of 135.7 during the month. It was up from 124.3 in June.
Expectations for the index based on consumer assessment of the businesses and labor markets rose from 164.3 to 170.9. But, other measures of consumer confidence were mixed. For example, the University of Michigan consumer confidence index posted a decline.
The index fell just below the expectations of 98.5, to register a reading of 98.4. Consumer confidence, as measured by the UoM, was slightly higher compared to June’s print of 98.2
Dampening the outlook somewhat has been weaker than expected auto sales in July. The seasonally adjusted annualized pace of sales was at 16.82 million. While this was a decline, it was still higher compared to the average estimates. But the data for July was the fourth consecutive month that auto sales fell below the 17-million threshold.
Higher rates and transaction prices were some of the reasons for undermining sales. This comes despite an overall steady trend in the US economy and the labor market.
Fuel prices are also one of the contributing factors. Gasoline prices rose during the month. The data suggests that we could see another month of retail sales data with fairly solid gains, especially in the core control group.
The core control group excludes food services, building material, auto, and gas. For the month, the retail sales control group is forecast to rise by 0.3%, following a 0.7% increase in the month before.
For the second quarter, the control group subset rose 7.5% on an annualized basis. This was one of the strongest quarterly performances since 2005.
By Hussein Sayed, Chief Market Strategist (Gulf & MENA), ForexTime
US stock markets experienced one of their worst days so far this year on Wednesday. The S&P 500 declined 2.93% after disappointing data from China and Germany increased the odds of a global slowdown. However, it was the warning signals from the bond markets that led to the steep selloff.
If you have been reading through recent financial headlines, the yield curve inversion topic seems to be the top concern for global financial markets. An inverted yield curve occurs when short-term bonds pay more than longer-term bonds. In other words, it’s when long-term interest rates fall below the shorter-term ones.
A part of the yield curve has been fully inverted since May, when the 10-year bond yields fell below the 3-month Treasury bill. Markets haven’t taken this inversion seriously as they pointed out to distortions due to global monetary policy, quantitative easing programs and negative interest rates, which were all factors that led to this inversion. But when the 10-year yields fell below the two-year notes yesterday, markets began to panic. The countdown to a recession has just started.
The yield curve has inverted before each recession in the past half-decade. Usually, a recession is hit 12 to 18 months after inversion occurs, and each one has slightly different circumstances.
What’s interesting about this one is that long-term interest rates are falling at a rapid pace. The 30-year bond yields have fallen 24% in just 14 days, and for the first time ever they trade below 2%. That’s despite the fact that the Fed has stopped tightening monetary policy and has begun reducing rates, which was supposed to have the opposite effect on long-term interest rates.
While investors may still make an annual return of 1.98% for holding 30-year bonds until maturity, when taking inflation into consideration they may end up with negative real returns. That’s a terrible situation for pension funds and some insurance companies who are obliged to have exposure to long duration bonds.
Given that it’s the first time we experience a yield curve inversion at such low interest rates it’s difficult to know the consequences on the global economy, but it certainly looks very alarming. Even the New York Fed puts the odds of a US recession at more than 30% in the next 12 months according to its recession probability indicator.
Historically, stocks continue to trend higher after the yield curve inverts, but given the different circumstances this time, investors need to be cautious. One sector investors tend to avoid is banks. Banks borrow at short-term from depositors and lend for the longer-term. When the yield curve is inverted, they struggle to make profit, and hence have less incentives to lend which eventually tighten credit markets.
No one knows when a bear market begins, but if the US and China don’t reach a trade agreement soon, the chance of one is highly likely. Increasing cash and gold holdings sounds like a good strategy at this point.
Disclaimer: The content in this article comprises personal opinions and should not be construed as containing personal and/or other investment advice and/or an offer of and/or solicitation for any transactions in financial instruments and/or a guarantee and/or prediction of future performance. ForexTime (FXTM), its affiliates, agents, directors, officers or employees do not guarantee the accuracy, validity, timeliness or completeness, of any information or data made available and assume no liability as to any loss arising from any investment based on the same.
On Wednesday the 14th of August, trading on the EURUSD pair closed down. The euro dropped against the dollar during the US session despite the safe haven assets making gains. For some reason, euro traders had their attention turned towards recession fears in Germany. The pair found some resistance at 1.1131.
Day’s news (GMT+3):
11:30 UK: retail sales (Jul).
15:30 US: retail sales (Jul), initial jobless claims (9 Aug), Philadelphia Fed manufacturing survey (Aug), NY Empire State manufacturing index (Aug).
16:15 US: industrial production (Jul).
Current situation:
Yesterday’s forecast didn’t entirely work out. After reaching the balance line, we saw an aggressive wave of sales. There doesn’t seem to be any basis for this decline. There are more questions than answers. German GDP data came out in the afternoon, but the drop came during the evening. This is quite a big delay. The euro’s status as a funding currency didn’t help, although this should have saved it from decline.
Yesterday, there were multiple reports of a yield curve inversion, with US 10-year bond yields overtaking 2-year yields. This has triggered fears of a recession in the US among experts. Some people look at the difference between 2-year and 10-year bonds, while others prefer to go by the difference between 5-year and 2 and 3-year bonds. Yesterday, we looked at the difference between 2 and 10-year bond yields, which wasn’t in negative territory. Now it’s at 0.01%. Those that are in negative territory have been since the beginning of August, so it’s unclear what led the euro bulls to close their long positions.
The EURUSD pair is currently trading at 1.1142. Since we got a false breakout of the channel’s lower boundary, we expect the pair to inch upwards towards the balance line. This should stop at around 1.1160, although if we get a convincing breakout of this level, the pair could rise as far as 1.1190.
Mozambique’s central bank lowered its monetary policy rate, MIMO, by a further 50 basis points to 12.75 percent as inflation continues to decelerate while the outlook has become more favorable following last week’s signing of a peace accord.
It is Bank of Mozambique’s (BOM) second rate cut this year and the 11th since April 2017 as inflation has steadily fallen since topping 26 percent in November 2016 and the exchange rate of the metical has risen since hitting almost 80 to the U.S. dollar in October 2016.
“The decision to reduce the minimum rate is justified by the continued improvement in the medium-term inflation outlook, which consolidates the stability of this indicator at single-digit levels,” BOM said.
BM also lowered its deposit rate by 50 basis points and the rate on its permanent lending facility to 9.75 percent and 15.75 percent, respectively. However, it left the reserve ratio of domestic currency deposits at 14.0 percent and foreign currency deposits at 36.0 percent. The signing of the Peace and National Reconciliation Agreement on Aug. 6 between Mozambique’s president and the leader of the main opposition group, paves the way for peaceful elections on Oct. 15 and ends violence that has persisted since a civil war ended in 1992 that has cost the lives of an estimated 1 million people. BOM said the outlook for inflation had become more favorable following the peace agreement and the beginning of the disarmament and demobilization process, though uncertainties still justify a conservative stance that should help bring down the cost of financing. Mozambique’s inflation rate fell further to 2.16 percent in June and BOM said its forecast of stable domestic prices is still based on lower pressure in the foreign exchange market given that aggregate demand remains below potential and the favorable movement of oil prices. As far as Mozambique’s economy, the central bank said it expects activity to decelerate further this year but then gradually recover in 2020, albeit it would remain below its potential. Last month BOM said growth in the medium term would be stimulated by post-disaster reconstruction and the completion of natural gas projects. Mozambique’s gross domestic product grew an annual 2.5 percent in the first quarter of this year, down from 3.0 percent in the previous quarter while international reserves remain at a level that covers six months of imports, excluding large projects. Gross international reserves rose by US$111 million since the June monetary policy meeting to $3.244 billion. The exchange rate of Mozambique’s metical has firmed sharply since late April this year after the country was hit by Tropical Cyclones Idai and Kenneth in March and April, which the International Monetary Fund estimated would dent economic growth this year from 3.3 percent last year. In April the IMF approved $118 million in emergency assistance to Mozambique, with the death toll from the two cyclones estimated at more than 1,000 people. The metical was trading at 60.49 to the U.S. dollar today, up 7 percent since late April and 1.8 percent since the start of this year.
US stock indexes closed sharply lower on Wednesday as the US Treasury yield curve inverted. The S&P 500 lost 2.9% to 2840.60 . The Dow Jones industrial average dropped 3.05% to 25479.42. Nasdaq composite index fell 3.02% to 7773.94. The dollar strengthening decelerated as US export prices recorded a decline over the same period a year ago in July too. The live dollar index data show the ICE US Dollar index, a measure of the dollar’s strength against a basket of six rival currencies, inched up 0.1% to 97.95 and is higher currently. Stock index futures point to higher market openings today
DAX 30 leads European indexes retreat
European stocks pulled back on Wednesday on weak data and heightened recession fears. Both the GBP/USD and EUR/USD continued their slide yesterday with both pairs rising currently. The Stoxx Europe 600 fell 1.8%. Germany’s DAX 30 dropped 2.2% to 11492.66 as data showed German economy shrank 0.1 over quarter in the three months from April to June. France’s CAC 40 fell 2.1% and UK’s FTSE 100 lost 1.4% to 7147.88 as UK inflation remained at 2%.
Chinese stocks rise while Asian indexes retreat
Asian stock indices are mixed today after 30-year Treasury bond yield fell below 2% level for first time. Nikkei ended 1.2% lower at 20405.65 despite yen resuming its slide against the dollar. Chinese stocks are rising as President Trump suggested a meeting with President Xi Jinping to resolve the Hong Kong crisis: the Shanghai Composite Index is up 0.3% and Hong Kong’s Hang Seng Index is 0.5% higher. Australia’s All Ordinaries Index tumbled 2.9% as the Australian dollar resumed its climb against the greenback.
Brent falls after another US crude inventories build
Brent futures prices are higher today. Prices slumped yesterday after the Energy Information Administration report US crude inventories rose for the second week in a row, increasing by 1.6 million barrels, while gasoline inventories fell by 1.4 million. October Brent crude tumbled 3% to $59.48 a barrel on Wednesday.
Note: This overview has an informative and tutorial character and is published for free. All the data, included in the overview, are received from public sources, recognized as more or less reliable. Moreover, there is no guarantee that the indicated information is full and precise. Overviews are not updated. The whole information in each overview, including opinion, indicators, charts and anything else, is provided only for familiarization purposes and is not financial advice or а recommendation. The whole text and its any part, as well as the charts cannot be considered as an offer to make a deal with any asset. IFC Markets and its employees under any circumstances are not liable for any action taken by someone else during or after reading the overview.
Deciphera Pharmaceuticals announced positive top-line results from the INVICTUS pivotal phase 3 clinical study of ripretinib in patients with advanced gastrointestinal stromal tumors.
Early this morning, clinical-stage biopharmaceutical company Deciphera Pharmaceuticals Inc. (DCPH:NASDAQ) focused on addressing key mechanisms of tumor drug resistance, announced positive top-line results from the INVICTUS Pivotal Phase 3 Clinical Study of ripretinib in patients with advanced gastrointestinal stromal tumors. Investors reacted very positively to the news by piling into the stock, sending the firm’s shares 115% higher at the market open over the prior day’s closing price on extraordinarily high trading volume.
The company explains in the release that ripretinib is a broad-spectrum KIT and PDGFRα inhibitor, for patients with fourth-line and fourth-line plus gastrointestinal stromal tumors (GIST). The INVICTUS Phase 3 clinical study is a randomized (2:1), double-blind, placebo-controlled, international, multicenter study to evaluate the safety, tolerability and efficacy of ripretinib compared to placebo in 129 patients with advanced GIST whose previous therapies have included at least imatinib, sunitinib and regorafenib.
The key findings of the study were outlined as follows: INVICTUS achieved primary endpoint, Ripretinib significantly improved progression free survival (PFS) versus placebo in patients with fourth-line and fourth-line plus GIST, median PFS for Ripretinib of 6.3 months versus placebo of 1.0 month; hazard ratio of 0.15, p<0.0001; and that the company expects to submit a New Drug Application (NDA) to the FDA in Q1/20 for the treatment of patients with advanced GIST who have received prior treatment with imatinib, sunitinib and regorafenib.
Regarding the study, Margaret von Mehren, MD, in the Department of Medical Oncology of the Fox Chase Cancer Center in Philadelphia, commented, “These top-line data from a Phase 3, randomized, placebo-controlled study are highly impressive and suggest that ripretinib’s approach of targeting the broad spectrum of KIT and PDGFRα mutations known to drive GIST can significantly improve progression free survival in the most heavily pretreated patients. Particularly notable is the magnitude of benefit observed for overall survival in this study.”
Steve Hoerter, president and CEO of Deciphera added, “Today’s announcement represents a significant milestone in our mission to deliver important new medicines for the treatment of cancer…The data from INVICTUS reinforces our belief that ripretinib has the potential to transform the treatment of GIST, and our focus now turns to working closely with the FDA as they evaluate ripretinib for those patients with GIST who, having failed all currently approved therapies, are in desperate need of a treatment option.”
Based on the positive INVICTUS data, the company expects to submit an NDA to the FDA in Q1/20 for ripretinib for the treatment of patients with advanced GIST who have received prior treatment with imatinib, sunitinib and regorafenib. In 2019, the FDA already granted fast track designation to ripretinib for the treatment of patients with advanced GIST who have received prior treatment with imatinib, sunitinib and regorafenib.
In addition to the Phase 3 study mentioned above, the company also issued a second release reporting positive updated Phase 1 data for Ripretinib in gastrointestinal stromal tumors, adding that the data from the Phase 1 study supports the ongoing INTRIGUE Phase 3 clinical study in patients with second-line GIST, and median progression free survival (mPFS) sustained across all cohorts.
Regarding the updated Phase 1 results, Mr. Steve Hoerter, president and CEO of Deciphera noted, “We believe the updated data from our ongoing Phase 1 clinical study, with the additional six months of maturity from our last Phase 1 data cut-off, continue to support ripretinib’s potential across the broad range of KIT and PDGFRα mutations known to occur in patients with GIST following therapy with imatinib…In the updated data from the second-line cohort, we believe ripretinib has demonstrated encouraging clinical benefit based on the objective response rate, disease control rate and median progression free survival rates observed. These results strengthen our confidence in the INTRIGUE pivotal Phase 3 clinical study comparing ripretinib to sunitinib, the standard of care for patients receiving second-line treatment for GIST.”
Gastrointestinal stromal tumor (GIST) is a cancer affecting the digestive tract or nearby structures within the abdomen, most often presenting in the stomach or small intestine. GIST is the most common sarcoma of the gastrointestinal tract, with approximately 4,000 to 6,000 new GIST cases each year in the U.S. and a similar incidence rate in European and other countries. Estimates for five-year survival range from 48% to 90%, depending on the stage of the disease at diagnosis.
Deciphera Pharmaceuticals indicates that it is a clinical-stage biopharmaceutical company developing new drugs to “improve the lives of cancer patients by addressing key mechanisms of drug resistance that limit the rate and durability of response of many cancer therapies.” Its targeted, small molecule drug candidates, designed using its proprietary kinase switch control inhibitor platform, inhibit the activation of kinases, an important family of enzymes, that when mutated or over expressed, are known to be directly involved in the growth and spread of many cancers. The firms is studying its lead drug candidate, ripretinib (DCC-2618) in two ongoing Phase 3 studies in gastrointestinal stromal tumors, or GIST, and in an ongoing Phase 1 trial in patients with multiple advanced malignancies, including GIST.
Deciphera shares opened up 115% higher today at $42.90 (+$22.95, +115.03%) compared to yesterday’s closing price of $19.95. Since the open the stock has traded between $34.55-42.99/share on more than 25 times average volume setting a 52-week intraday high price. At present, shares are trading at $35.72 (+$15.77, +79.05%).
Disclosure: 1) Stephen Hytha compiled this article for Streetwise Reports LLC and provides services to Streetwise Reports as an independent contractor. He or members of his household own securities of the following companies mentioned in the article: None. He or members of his household are paid by the following companies mentioned in this article: None. 2) The following companies mentioned in this article are billboard sponsors of Streetwise Reports: None. Click here for important disclosures about sponsor fees. 3) Comments and opinions expressed are those of the specific experts and not of Streetwise Reports or its officers. The information provided above is for informational purposes only and is not a recommendation to buy or sell any security. 4) The article does not constitute investment advice. Each reader is encouraged to consult with his or her individual financial professional and any action a reader takes as a result of information presented here is his or her own responsibility. By opening this page, each reader accepts and agrees to Streetwise Reports’ terms of use and full legal disclaimer. This article is not a solicitation for investment. Streetwise Reports does not render general or specific investment advice and the information on Streetwise Reports should not be considered a recommendation to buy or sell any security. Streetwise Reports does not endorse or recommend the business, products, services or securities of any company mentioned on Streetwise Reports. 5) From time to time, Streetwise Reports LLC and its directors, officers, employees or members of their families, as well as persons interviewed for articles and interviews on the site, may have a long or short position in securities mentioned. Directors, officers, employees or members of their immediate families are prohibited from making purchases and/or sales of those securities in the open market or otherwise from the time of the interview or the decision to write an article until three business days after the publication of the interview or article. The foregoing prohibition does not apply to articles that in substance only restate previously published company releases.
In this last segment of our multi-part research post regarding the US Fed and the global central banks, it is becoming evident that the fear of a further market contraction is resulting in the decrease in rates and the push for additional QE functions. Our research has shown that the global economy has partially recovered from the 2008-09 credit market collapse, but the process of the recovery has resulted in a “blowout” type of event where shifting capital intents and the transition from the 19th century economic model towards a new 21st century economic model is setting up the global markets for a massive rotation event over the next 12 to 24 months – possibly longer.
It is our belief that capital is still doing what capital always does, seeking out the best opportunities for safety and returns. Right now, that location is easily found in only certain segments of the markets; volatility, precious metals, certain energy sectors, US Treasuries and CASH. The future events, including the massive rotational event that we believe is about to unfold in the global markets, will change the way capital is deployed for many years to come.
It is very likely that this rotation event will create incredible opportunities for skilled technical traders or subscribers to our trade signal newsletter over the next 12 to 36 months and will likely prompt a further shift towards the new 21st-century economic model that we believe will be the ultimate outcome.
Taking a brief look at our recent history highlights the fact that capital becomes fearful about 12 to 16 months before a major US election event. Additionally, certain other factors related to the global economy heighten this fear as US/China trade issues, global debt issues and economic output issues continue to plague the markets. The combination of these types of events set up a “perfect storm” type of economic cycle where skilled technical traders are just waiting for the impact event to hit before the markets begin a bigger rotational event.
These types of events, similar to the 2000 and 2008-09 market crash event, are a process where price rotates out of a normal range and attempts to explore lower price levels that act as price support. It is not uncommon for these types of events to happen, although the severity of these events is difficult to determine prior to their execution.
The US Fed and global central banks set up an easy money process over the past 9+ years that allowed for capital to be deployed as a process that has setup this current massive rotational event. At first, the intent was to support collapsing markets and institutions – we understand that. But the nature of capital is to always seek out suitable safety and returns, so capital did what is always does hunt out the best opportunities for profits. First, it rallied into the crashing real estate market and emerging markets – which had been crushed by the 2008-09 credit crisis event. Next, it piled into the Asian markets and healthcare/technology markets. At this time, it also started piling into the startup/VC markets throughout the world as well as certain commodities. The recovery seemed to have created a booming and cash-flush market for anyone with two dollars to rub together.
Then came the 2015-16 market contraction and the end of the US Fed QE processes. At this time, China realized the need to control capital outflows and the US/Global markets slowed to a crawl as the US Presidential election cycle ramped-up. It was just 12 months prior to this 2015-16 event that oil crashed from $114 to $46. Within 2015-16, Oil continued to crash to levels below $30. This was the equivalent of the blowout cycle for the global economy. Headed into the 2016 US elections, the global economy was running on only 5 of 8 cylinders and was limping along hoping to find some way out of this mess.
The November 2016 US elections were just what the global economy needed and everyone’s perceptions about the future changed almost overnight. I remember watching the price of Gold on election night; +$75 early in the evening as Clinton was expected to win, then it continued to fall back to +$0 fairly late in the evening, then it fell to -$75 as the news of a Trump win was solidified. This rotation equated to a nearly 10% rotation in less than 24 hours based on FEAR. Once fear was abated, global investors and capital went to work seeking out the safest environments and best returns – like normal.
This resurgence of capital into the markets set up of a new SOP (standard operating procedure) where capital began to be deployed in more risky environments and into broader and bigger investment structures. This is the SETUP I’m trying to highlight that was created by the US Fed and central banks. I don’t believe anyone thought, at that time in early 2017, that the current set of events would have transpired and I believe global governments, central banks, and global financial institutions thought, “Party on, dude! We’re back to 2010 all over again”. Boy, were they wrong.
This time, the global central banks, governments and state-run enterprises engaged in bigger and more complex credit/debt structures while attempting to run the same game they were running back in 2010 and 2011. The difference this time is that the US Fed started raising Fed Fund Rates and destroyed the US Dollar carry trade while putting increasing pressure on the global market, global debt and global trade. The continued rally of the US Dollar after the 2018 lows helped to solidify the advantages and risks in the markets. This upside rally in the US Dollar, after the 2014 to 2016 rally, really upset the balance of the global markets and setup an increasing pressure point for foreign markets.
It soon became very evident that risks in the foreign markets could be partially mitigated by investing in the US stock market and by moving capital away from risky currencies and into US Dollar based assets. Capital is always doing what it always does – seeking out the best environment for returns and protection from risk. Thus, we have the setup right now – only 15 months before the 2020 US Presidential elections. What happens now?
This setup is likely to prompt a rotation in the global markets as well as within the US stock market. It is very likely that a continued contraction in consumer and banking activity (think business, real estate, trade, commodities, and others) will prompt a contraction in global economics very similar to what happened in 2014~2016. This process will likely put extreme risk factors at play in some of the most fragile economies and state-run enterprises on the planet. Once the flooring begins to crack in some of these markets, we’ll see how this event will play out. Right now, our eye is watching Europe and Asia for early warning signs.
The US Fed will continue to manipulate the FFR levels in an attempt to help mitigate the risks associated with this contraction event. It is likely that the US Fed already sees what we see and it attempting to position themselves into a more responsive stance given the potential outcomes. Inadvertently, the US Fed and global central banks presented an offer that was too good for anyone to ignore – easy cash. What they didn’t expect is that the 2014 to 2019 rally in the US Dollar and US stock market would transition capital deployment within the global market in such a way that it has – setting up the current event cycle.
We believe a downside pricing event is very likely over the next 10 to 25+ days where the US stock market may fall 12 to 25%, targeting levels shown on this chart (or slightly lower) as this rotational event takes place. Ultimately, the US markets will recover much quicker than many foreign/global markets. Our estimates are that the recovery in the US markets will likely begin to take place near March or April 2020 and continue higher beyond this date.
This Custom Smart Cash Index chart highlights the type of capital shift activity we’ve been describing to our readers and followers. It is easy to see that capital moved out of risky investments within the downturns on this chart and into the most opportunistic equity markets within the uptrends on this chart. Remember, most opportunistic markets are sometimes outside of the scope of this Smart Cash index. For example, this chart does not relate strength in the Precious Metals markets or other commodities/currencies. All this chart is trying to highlight for followers is how capital is being deployed in viable global equity markets and when capital is exiting or entering these markets.
Given the current setup, we would expect a breakdown in this Smart Cash Index over the next 4+ months to set up a new lower price level establishing a base/bottom before attempting to move higher. We believe the 100 level, shown as historical support, is a proper target price level for this move initially.
Lastly, we believe capital is moving aggressively into the precious metals markets and we urge all skilled technical traders to pay attention to this chart of the Gold/Silver ratio. If our analysis is correct and a larger rotation price cycle is about to unfold in the global markets, which may last well into 2020 (or beyond) for certain global markets, then you really need to pay attention to the upside potential for this Gold/Silver ratio.
As we’ve drawn on this chart, if this ratio recovers to 50% of the 2011 peak levels as this rotation unloads on the global market, this would push Gold and Silver prices to levels potentially 60% to 140%+ higher than current levels. I understand how hard it is to understand these types of incredible price increases and how they could possibly be relative to current prices, but trust us in our research. Gold and Silver prices have been measurably depressed over the past 3 to 4 years. Unleashing the real valuation levels of these precious metals at a time when risk factors are excessive suggests that Gold could easily be trading above $3200 and Silver above $60 to $65 within 6 to 12 months.
CONCLUDING THOUGHTS:
In closing, we want to urge all skilled technical traders to keep a very open perspective to the “Party on, Dude” mode of the global central banks and be aware that a very fragile floor is the only thing holding up the markets in another massive US presidential election cycle event. In our opinion, the writing is already on the wall and we are preparing for this rotational event and alerting our members on what to do to profit from these moves.
The Federal Reserve and global central banks will attempt to keep the party rolling for as long as possible because they know the downside event could be something they don’t want to have to deal with. So watch how these global central banks attempt to nudge public perception away from risks and towards the “party on” mode. Stay alert. Stay aware. When this breaks, it will break quickly and aggressively.
Using technical analysis and proven strategies we can follow the market trends and profit from them no matter which the market moves. We bet with the market (the house) and provide entry, target, and stops for all trades we initiate.
NEXT MOVES FOR GOLD, SILVER, MINERS, AND S&P 500
In early June I posted a detailed video explaining in showing the bottoming formation and gold and where to spot the breakout level, I also talked about crude oil reaching it upside target after a double bottom, and I called short term top in the SP 500 index. This was one of my premarket videos for members it gives you a good taste of what you can expect each and every morning before the Opening Bell. Watch Video Here.
I then posted a detailed report talking about where the next bull and bear markets are and how to identify them. This report focused mainly on the SP 500 index and the gold miners index. My charts compared the 2008 market top and bear market along with the 2019 market prices today. See Comparison Charts Here.
On June 26th I posted that silver was likely to pause for a week or two before it took another run up on June 26. This played out perfectly as well and silver is now head up to our first key price target of $17. See Silver Price Cycle and Analysis.
More recently on July 16th, I warned that the next financial crisis (bear market) was scary close, possibly just a couple weeks away. The charts I posted will make you really start to worry. See Scary Bear Market Setup Charts.
Coming up we have some key figures that routinely jog the Aussie and Kiwi.
These are the first employment figures from Australia that have the full effect of the RBA’s back-to-back rate cut, so investors are going to be just as keen as the central bank to see if the policy is having an effect. And, if so, how much?
Governor Lowe has made it quite clear that he believes further reductions in the unemployment rate are necessary to boost inflation back to where the bank wants it. With the RBA open to further cuts (and the market pricing in at least one more for the rest of the year) employment figures are likely to have an impact on the markets going forward.
Looking Ahead and Around
As usual, this one of the last major economic figures for the month. Therefore, based on what we get overnight, we could see the fundamental trend set. Attention is on Australia’s largest trade partner, China, out of which we are expecting a wealth of data over the next few days.
A significant portion of the economic underperformance is being attributed to a lack of capital flows from the world’s second-largest economy. In fact, China has expressed concerns about Australia’s largest export being too expensive and is looking to cut prices. So, despite the RBA’s best efforts, the situation might not improve in the near term.
What We Are Looking For
Projections for the labor sector in Australia are for it to, at best, say the same, if not get slightly worse.
The consensus is that there were 14K net jobs created in July. This would be an improvement over the 0.5K in the prior month. But, expectations are for the employment rate to remain at 5.2% according to the median survey of analysts. There are a substantial number of Australian economists who are projecting the rate to tick up to 5.3%, which would be a disappointment for the RBA.
Lately, job adds have settled into a “normal” range of 10-40K. And it’s beyond those ranges where we’d expect a stronger move in the markets. However, two consecutive months on the lower end of the range, and with such a strong emphasis on employment by the RBA, might be enough to take the AUD down a bit.
A result closer to 40K would be quite unexpected and would help support the currency.
Why We Care So Much
In its latest projections, the RBA said that they expected the unemployment rate to slowly settle towards 4.5%. That’s the level where they consider the economy to be at full employment. However, since bouncing off 4.9% in February, the unemployment rate has been slowly growing.
We’re also in the middle of the Australian winter when, usually, employment is not at its strongest. This would contribute to further expectations of weakness in the next couple of months. A survey of executives showed that they were front-loading investment, meaning that the latter half of the year would have less investment, and therefore less job creation.
The Prices
With sluggish job creation, even though the rate is relatively low (just three decimals over the lowest rate in years), we have less pressure on wage increases. Wage inflation is the primary driver of overall inflation, which is what the RBA is banking on for their fiscal policy.
The worrying part, though, is that hiring in mining and construction, the two largest drivers of wage growth, is in a holding pattern due to lack of spending from China. With talk of the trade war lasting to near the end of this year, that holding pattern could be becoming the norm.
By Jameel Ahmad, Global Head of Currency Strategy and Market Research at ForexTime
If there was any remaining doubt, the EU economic data released Wednesday has provided even further support to the view that the ECB will need to cut interest rates to a new record-low as early as September.
Global economic health fears are once again making the rounds, following confirmation that the German economy contracted in the previous quarter. This follows the UK GDP contraction at the end of last week, meaning we are now looking at increased prospects that two of the largest advanced economies in the world will enter a technical recession over the coming quarter.
It wasn’t just economic data in Germany that disappointed from Europe today. GDP in the Eurozone expanded by only 0.2% in the last quarter, half of the size of growth seen in Q1 2019 and world recession fears have been further compounded by the U.S. 2-year and 10-year treasury yield curve inverting for the first time since 2007.
The alarming data in recent days essentially compliments the view that has been steadily growing in recent months – the world economy is encountering another slowdown.
The EURUSD has fallen as much as 60 pips at time of writing and eyes will be on whether the pair will drop below 1.11, which would be seen as a signal that 1.10 is once again in reach for the Eurodollar.
It is the Japanese Yen that is once again an investor favorite as a safe haven. The USDJPY has dropped as much as 110 pips with eyes now on whether the pair can slip below the 105 psychological support level.
EURJPY has lost 140 pips. If the current selling momentum in the pair pushes below 117.50, the cross will have achieved its lowest level since April 2014.
Disclaimer: The content in this article comprises personal opinions and should not be construed as containing personal and/or other investment advice and/or an offer of and/or solicitation for any transactions in financial instruments and/or a guarantee and/or prediction of future performance. ForexTime (FXTM), its affiliates, agents, directors, officers or employees do not guarantee the accuracy, validity, timeliness or completeness, of any information or data made available and assume no liability as to any loss arising from any investment based on the same.