Tomorrow we have what could be one of the biggest events for the Mexican peso so far this year. Banxico must decide what to do with the interest rate. Mexico’s central bank is between a rock and a hard place. Inflation is quite high, but the economy is struggling to lift off. In this context, world banks are cutting rates, widening the bond rate differential and making things difficult for Mexican exporters.
What can the Banxico do? There are quite a lot of people who would like to see a rate cut, including the Mexican Government. President López has repeatedly called for a cut to rates, although at the same time insisting on the independence of the central bank. So far, though, the central bank hasn’t agreed.
What Are We Expecting?
The consensus among analysts is that the Banxico will hold rates steady for one more month, but strike as dovish a tone as possible. However, almost everyone still sees a rate cut by September. This means that although they expect the bank to hold fast, a rate cut this time around also would not be a surprise.
This would be the first rate cut since 2014, after a prolonged tightening cycle as the bank fought rising inflation. The arguments for a rate cut are based on keeping pace with the Fed, as well as most major central banks around the world. If the Banxico were to keep rates on hold, it would be relatively equivalent to a rate hike; and have a consequent effect on the peso over the next month. Those analysts also point to moderation in the inflation rate lately, in line with the central bank’s projections earlier in the year.
The Structural Issues
The thing is, though, even with the third highest interest rate in the BIS system at 8.25%, Mexico has been suffering from capital flight. Over $8.5B in capital has left the country in the last six months. Adjusted for inflation, Mexico has the highest interest rate in the (free market) world.
As mentioned previously, many economists believe Mexico’s economic problem is structural, and a change in monetary policy won’t correct the problem. This view is shared by the Banxico. In its last meeting, they blamed a drop in foreign direct investment, reversing capital flows and sluggish growth on institutional and structural problems.
It’s Not Unique
Of course, Mexico isn’t the only country where the central bank warns about structural problems. Eurozone is another example of this. In the end, monetary policy is often trimmed to try to maximize growth regardless of the lack of political will to improve fiscal policy.
Lately, data has suggested that at least domestically, the economy is drifting towards where the central bank is more comfortable. Last week we saw consumer demand was still firmly in growth, and annualized inflation fell below 4.0% for the first time in years. Even the trade balance has been positive for the last few months.
Is it International or Domestic?
Mexico is, of course, subject to the general economic softness in the world’s economy. On top of that, though, is the unpredictable nature of their largest customer. Trump has repeatedly threatened to lay tariffs on Mexico, and the USMCA has still not been ratified by the US Congress. This adds additional uncertainty to an economy already wary of the new president’s policies.
With the peso weakening lately, the Banxico has a balance a lot of moving parts in determining policy. Even if they do cut rates, it might not be seen as enough by the markets to prop up the economy. There seems little they can do that will provide strength to the peso for now.
Peter Epstein profiles recent developments with this company that has a large vanadium deposit in Nevada, with a PEA on the way.
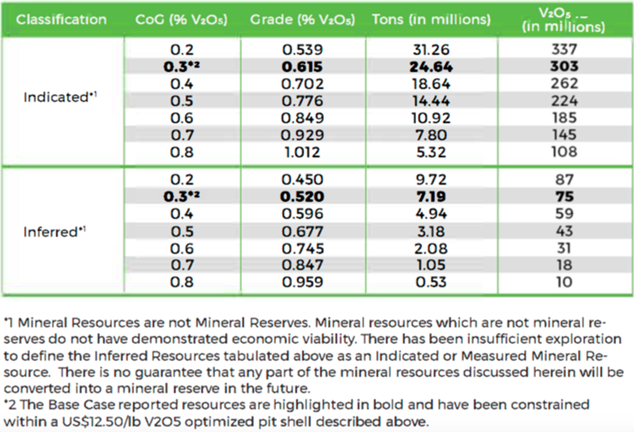
First Vanadium Corp. (FVAN:TSX.V; FVANF:OTCQB) has a large, near-surface vanadium resource (303 million pounds, Indicated category only), with a very good grade (0.615% V2O5) in the great mining jurisdiction of Nevada. The company has 42.4 million shares outstanding & $1.7 million in cash. Its enterprise value (EV) [market cap + debt cash] = $12.5 million = US$9.4 million. First Vanadium is fully funded through delivery of a preliminary economic assessment (PEA), expected by Q1 2020.
The technical team is nothing short of world class. I can’t imagine a better team to optimize a greenfield project than this one. The company’s board, management and technical team’s core competence is in the exploration, permitting, development, construction and operation of mining projects around the globe, with over 400 years combined experience. Not only are these highly experienced professionals good at what they do, they’re passionate about it. {see August corporate presentation}
The Carlin vanadium project, one of the best in North America
The Carlin Vanadium project is situated on 3,608 acres in mining-friendly Elko County, in north-central Nevada, and surrounded by exceptional infrastructure. It’s road accessible from the towns of Carlin and Elko. Carlin, 7 miles away, is a major rail hub to both coasts. A power line runs within five miles of the property. There are nearby mining communities, a skilled workforce, mining services, suppliers and venders, and an airport.
It would be hard to overstate the importance of potentially developing a vanadium project in the U.S., with the president having named V2O5 a “strategic mineral,” and the very significant and growing need for vanadium in steel, the backbone of global growth. Not to mention the emerging Vanadium Redox Flow Battery (VRB) market.
The U.S. Department of Energy (DOE) has pledged to streamline and cut red tape from permitting and approval processes. And don’t forget, last year the federal tax rate was slashed from 35% to 21%.
The Carlin Vanadium project is one that I think could be up and running within five years. Especially if permitting and environmental protocols are reset for critical minerals in light of the escalating trade war between the U.S. and China.
A large, near-surface, high-grade resource
The high-grade, primary vanadium resource at Carlin consists of 303 million pounds V2O5 in the NI 43-101 compliant Indicated category. At a cut-off grade of 0.30%, the Indicated resource (80% of total resource) is 0.615% V2O5. There is also 75 million pounds in the Inferred category. Management believes there’s room to grow the resource if or when needed.
On August 7, First Vanadium announced that ongoing metallurgical test work on samples from the Carlin project resulted in a preliminary process flow sheet delineating extraction and recovery of vanadium as high-quality vanadium pentoxide (V2O5).
In my view, a very important and necessary milestone has been achieved, at reasonable cost, paving the way for a (fully funded) PEA by Q1 2020. The fact that management has announced a flow sheet signals confidence that they are well on the way to a viable PEA.
Paul Cowley, president & CEO, commented in the press release,
“The Company is very pleased at achieving this major metallurgical milestone for the project. With a preliminary flow sheet defined, the Company will now initiate Requests for Proposals from qualified engineering firms for a Preliminary Economic Assessment (PEA).”
And, here’s a great summary of the process flow sheet,
“The flow sheet follows four steps, 1) crushing & grinding, 2) pre-concentration to reduce the volume of feed to the pressure oxidation circuit, 3) acid leach & pressure oxidation to extract vanadium into solution, and 4) solvent extraction to generate a high-value, pure vanadium pentoxide (V2O5) flake product.”
The press release emphasized that the flow sheet uses conventional, off-the-shelf technology,
“The extraction process uses conventional unit operations (crushing, grinding, flotation, leaching, solid-liquid separation, solvent extraction & ion exchange, precipitation & calcination) and common chemicals (oxygen, sulfuric acid, ammonium carbonate & ammonium sulfate).“
A lot of the work to date has been aimed at driving capital and operating costs lower through optimization of the flow sheet. An example is the pre-concentration step that captures the bulk of the vanadium in a smaller volume of feed to the autoclave. This means a smaller autoclave could be constructed, which would be cheaper to build and operate. Importantly, additional test work to refine and optimize the process is expected to lower costs even further, in time for the PEA.
There are some very smart and talented metallurgists and engineers working on First Vanadium’s flow sheet! (see image below).
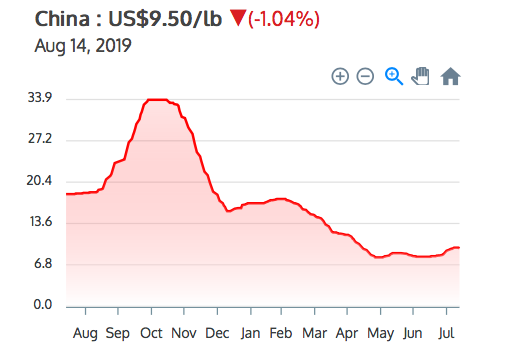
Regarding vanadium pricing, I’m not one to predict or forecast. I thought the price would remain close to $15/lb. Still, at the current vanadium pentoxide (China) price of US$9.5/lb, the in-situ value of the Indicated-only portion of the resource (303 million pounds) is ~US$2.9 billion = ~C$3.8 billion. Compare that to First Vanadium’s EV of US$9.4 million. This is the largest, high-grade primary vanadium resource in North America.
VRBs are coming on strong, VRB technology advances will help a lot
Vincent Sprenkle, a lead researcher at the U.S. DOE’s Pacific Northwest National Laboratory, recently said, “Vanadium Redox Flow Battery costs could be lowered by another 50%.” I think that sentiment speaks to the inevitability of additional technological advancements, which will be bullish for the vanadium market, as it will allow for more widespread adoption of utility scale VRBs outside of China, where VRB projects already have a strong foothold.
There are hundreds of battery metals juniors out there: vanadium, cobalt, lithium, nickel, graphite, but very few are moving the ball forward as rapidly and prudently as First Vanadium. Moving towards a PEA with the quoted (V2O5)Chinaprice at US$9.5/lb signals a strong belief in both the flow sheet and the project. The vanadium price dipped to US$8.1/lb in mid-July, but it’s up 17.3% since then.
First Vanadium Corp., (TSXV: FVAN) / (OTCQX: FVANF) with a PEA in hand early next year, a tremendous management, board, technical team and retained consultants, and a strong (high-grade primary vanadium)/sizable (303 million pounds Indicated) project, in a top mining jurisdiction, is worth a closer look.
Peter Epstein is the founder of Epstein Research. His background is in company and financial analysis. He holds an MBA degree in financial analysis from New York University’s Stern School of Business.
Disclosures: The content of this article is for information only. Readers fully understand and agree that nothing contained herein, written by Peter Epstein of Epstein Research [ER], (together, [ER]) about First Vanadium Corp., including but not limited to, commentary, opinions, views, assumptions, reported facts, calculations, etc. is not to be considered implicit or explicit investment advice. Nothing contained herein is a recommendation or solicitation to buy or sell any security. [ER] is not responsible under any circumstances for investment actions taken by the reader. [ER] has never been, and is not currently, a registered or licensed financial advisor or broker/dealer, investment advisor, stockbroker, trader, money manager, compliance or legal officer, and does not perform market making activities. [ER] is not directly employed by any company, group, organization, party or person. The shares of First Vanadium Corp. are highly speculative, not suitable for all investors. Readers understand and agree that investments in small cap stocks can result in a 100% loss of invested funds. It is assumed and agreed upon by readers that they will consult with their own licensed or registered financial advisors before making any investment decisions.
At the time this article was posted, Peter Epstein owned no shares of First Vanadium Corp. and the Company was an advertiser on [ER].
Readers understand and agree that they must conduct their own due diligence above and beyond reading this article. While the author believes he’s diligent in screening out companies that, for any reasons whatsoever, are unattractive investment opportunities, he cannot guarantee that his efforts will (or have been) successful. [ER] is not responsible for any perceived, or actual, errors including, but not limited to, commentary, opinions, views, assumptions, reported facts & financial calculations, or for the completeness of this article or future content. [ER] is not expected or required to subsequently follow or cover events & news, or write about any particular company or topic. [ER] is not an expert in any company, industry sector or investment topic.
Streetwise Reports Disclosure: 1) Peter Epstein’s disclosures are listed above. 2) The following companies mentioned in the article are billboard sponsors of Streetwise Reports: None. Click here for important disclosures about sponsor fees. The information provided above is for informational purposes only and is not a recommendation to buy or sell any security. 3) Statements and opinions expressed are the opinions of the author and not of Streetwise Reports or its officers. The author is wholly responsible for the validity of the statements. The author was not paid by Streetwise Reports for this article. Streetwise Reports was not paid by the author to publish or syndicate this article. Streetwise Reports requires contributing authors to disclose any shareholdings in, or economic relationships with, companies that they write about. Streetwise Reports relies upon the authors to accurately provide this information and Streetwise Reports has no means of verifying its accuracy.
4) The article does not constitute investment advice. Each reader is encouraged to consult with his or her individual financial professional and any action a reader takes as a result of information presented here is his or her own responsibility. By opening this page, each reader accepts and agrees to Streetwise Reports’ terms of use and full legal disclaimer. This article is not a solicitation for investment. Streetwise Reports does not render general or specific investment advice and the information on Streetwise Reports should not be considered a recommendation to buy or sell any security. Streetwise Reports does not endorse or recommend the business, products, services or securities of any company mentioned on Streetwise Reports. 5) From time to time, Streetwise Reports LLC and its directors, officers, employees or members of their families, as well as persons interviewed for articles and interviews on the site, may have a long or short position in securities mentioned. Directors, officers, employees or members of their immediate families are prohibited from making purchases and/or sales of those securities in the open market or otherwise from the time of the interview or the decision to write an article until three business days after the publication of the interview or article. The foregoing prohibition does not apply to articles that in substance only restate previously published company releases.
Norway’s central bank kept its policy rate steady at 1.25 percent, saying the outlook for the policy rate ahead is little changed since June, when it forecast another rate hike would be likely this year, but acknowledged “the global risk outlook entails greater uncertainty about policy rates going forward.”
Norges Bank (NB), which raised its rate in June for the third time since September 2018 to contain inflation from strong economic growth, added the upturn in the Norwegian economy was continuing as it had expected though underlying inflation was a little lower than projected and “deepening trade tensions and heightened uncertainty surrounding the UK’s relationship with the EU may weigh on growth abroad and in Norway.”
“On the other hand, a weaker krone may contribute to higher inflation ahead,” NB added, waking a tightrope between inflation close to its target and a strong domestic economy amid a weaker currency and slowing global growth.
NB’s decision to retain its rate today was widely expected by analysts who said the bank’s executive board normally doesn’t change rates during an interim meeting, pencilling in the next rate hike for September when NB updates its quarterly economic forecast.
Propelled by an investment boom in its oil and gas industry, and government spending on infrastructure, such as railways, Norway’s economy has defied the slowdown in the global economy and the central bank has remained an outlier amid a sharp easing of global monetary policy.
Recalling its latest monetary policy report on June 20, NB said capacity utilization in the country’s economy was somewhat above normal, underlying inflation was a little higher than the bank’s 2.0 percent target and the board’s assessment was the “policy rate would most likely be increased further in the course of 2019.”
In response, analysts expected NB to raise its rate again in September or December, when it publishes its economic forecasts, with only a minority looking for NB to end its tightening campaign. While today’s guidance from NB was balanced, the verdict from the foreign exchange market was one-sided, with Norway’s krone continuing its recent decline. The krone fell 0.3 percent to 8.99 to the U.S. dollar in response to the NB’s statement and is now down 3.2 percent this year and down by 8.8 percent since the start of 2018 despite three rate hikes. Norway’s headline inflation rate was steady at 1.9 percent in July and June while gross domestic product shrank 0.1 percent in the first quarter from the previous quarter for annual growth of 2.5 percent, up from 1.9 percent in the previous quarter. In its June monetary policy report NB forecast its policy rate would average 1.1 percent this year, then 1.6 percent in 2020 and 1.7 percent in 2021 and 2022.
But NB also lowered both its inflation and growth forecasts from its March forecasts.
Consumer price inflation was seen averaging 2.2 percent this year, down from a previous forecast of 2.3 percent, then 1.9 percent in 2020 and 2.0 percent in 2021 and 2022.
The 2019 growth forecast for mainland Norway was lowered to 2.6 percent from a previous 2.7 percent and the 2020 forecast to 1.9 percent from 2.0 percent. In 2021 growth was seen slowing further to 1.2 percent and then remaining at that rate in 2022.
Norges Bank published the following press release:
“Norges Bank’s Executive Board has decided to keep the policy rate unchanged at 1.25 percent.
In Monetary Policy Report 2/19, which was published on 20 June 2019, the Executive Board’s assessment was that capacity utilisation in the Norwegian economy was somewhat above a normal level. Underlying inflation was a little higher than the 2 percent inflation target. The policy rate was raised by 0.25 percentage point to 1.25 percent. The Executive Board’s assessment of the outlook and balance of risks suggested that the policy rate would most likely be increased further in the course of 2019.
The upturn in the Norwegian economy is continuing broadly as expected in June. Underlying inflation has been a little lower than projected. Deepening trade tensions and heightened uncertainty surrounding the UK’s relationship with the EU may weigh on growth abroad and in Norway. On the other hand, a weaker krone may contribute to higher inflation ahead.
“Overall, new information indicates that the outlook for the policy rate for the period ahead is little changed since the June Report. The global risk outlook entails greater uncertainty about policy rates going forward”, says Governor Øystein Olsen.”
German economy slowed in second quarter. Will the DE30 continue declining?
Recent German economic data were negative: second quarter GDP contracted as expected, and German economic sentiment tumbled in August. The GDP shrank 0.1% in the second quarter as forecast, and ZEW survey results showed the ZEW indicator of economic sentiment for Germany slumped from -24.5 in July to -44.1 August, the worst level since December 2011. And experts cite continuing US-China trade dispute and the increased likelihood of a no-deal Brexit as additional downside risks for German economy.
Pressure on the already weak economic growth concerns about slowing growth of China’s economy. China’s industrial profits dropped sharply in the first two months of the year – 14%, adding to data pointing to slowing of Chinese economy. Weak economic data are bearish for DE30.
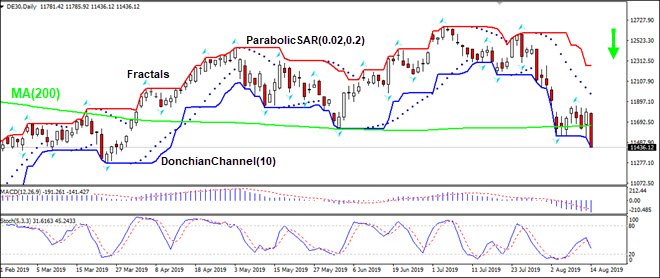
On the daily timeframe the DE30: D1 is retracing after climbing to 12-month high in the beginning of July. It has fallen below the 200-day moving average MA(200). This is bearish.
The Parabolic indicator gives a sell signal.
The Donchian channel indicates downtrend: it is widening down.
The MACD indicator gives a bearish signal: it is below the signal line and the gap is widening.
We believe the bearish momentum will continue after the price breaches below lower boundary of Donchian channel at 11436.00. This level can be used as an entry point for placing a pending order to sell. The stop loss can be placed above the last fractal high at 11858.50. After placing the order, the stop loss is to be moved every day to the next fractal high, following Parabolic signals. Thus, we are changing the expected profit/loss ratio to the breakeven point. If the price meets the stop loss level (11858.50) without reaching the order (11436.00), we recommend cancelling the order: the market has undergone internal changes which were not taken into account.
It’s been another volatile week for the crude market as traders have seen strong moves in both directions. The market was buoyed earlier in the week by some unexpected news. Some of the goods due to be hit by new 10% tariffs in September, will now be exempt until December 15th. The US Trade Representative released a statement on Tuesday saying that due to “health, safety, national security, and other factors”, some of these goods will see the tariff postponed. Trump told reporters that the decision was aimed at reducing costs for US shoppers over the Christmas season.
US Recession Fears Growing
The news was met with a strong relief rally across risk assets, which lifted oil prices. However, the bounce proved to be short-lived as markets then traded lower on growing fears of a global recession. InGermany, GDP contracted over Q2. This means that the second-largest economy in the eurozone is now on the brink of recession for the first time in a decade. The data follows a spate of weak sentiment data, with Ifo readings already highlighting a recession.
Meanwhile, movements in US treasury yields have also raised concerns. This week, yields on US 2Y treasuries moved above yields on 10Y treasuries for the first time since 2007. Typically, such movement has preceded a recession in the US. Equities have moved sharply lower subsequently, weighing on oil prices.
Goldman Sachs Warn Of Recession
The market will be keeping a close watch on both the US/China trade situation and the prospect of a recession. Indeed, the move in treasuries comes just after Goldman Sachs issued a client note last week. They warned that the risk of a recession is rising in the US.
US Crude Stores Rise Again
The latest industry data has added further downside for oil with the EIA reporting a second consecutive weekly build in US crude stores. The report from the Energy Information Administration covering the week ending August 9th showed Crude inventories increased by 1.6 million barrels. This beat analyst expectations for a decline of 2.8 million barrels. Now sitting at 440.5 million barrels, inventories are roughly 3% above the five-year average for this time of year.
Gasoline demand Hits Record Highs
However, the report wasn’t all bearish. Gasoline stores were seen down by 1.4 million barrels, this was in contrast to forecasts for a 25,000 barrel increase. Gasoline inventories are now 4% above the five-year average for this time of year. The report also noted that US gasoline demand rose by 281,000 barrels per day to a record 9.93 million bpd last week.
Technical Perspective
The initial rally in crude this week saw the continued reversal off the recent 50.69 lows with price exploding higher to break above the 54.95 level. However, the rally was capped as it tested the bearish trend line from 2019 highs. This turned price lower once again, moving back below the 54.95 level, which price is currently hovering around. While above here, a further topside run looks likely with bulls eyeing a break of the 57.39 level. However, if we fail here, bears will need to see a break of lower support at 53.60 to open the way for a deeper run down to test the 50.69 lows once again.
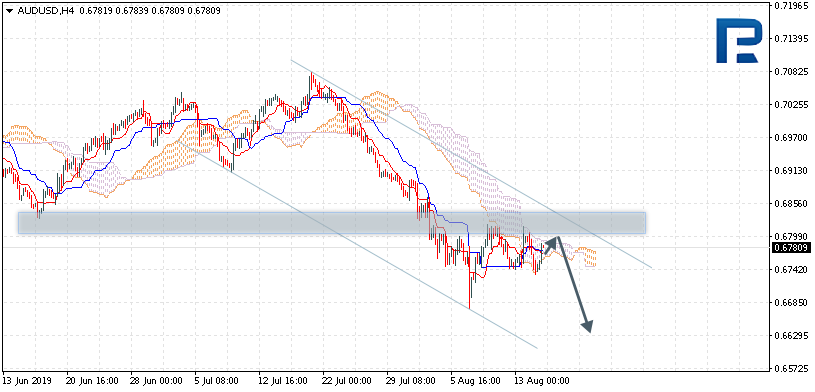
AUDUSD is trading at 0.6780; the instrument is moving inside Ichimoku Cloud, thus indicating a sideways tendency. The markets could indicate that the price may test the cloud’s upside border at 0.6795 and then resume moving downwards to reach 0.6645. Another signal to confirm further descending movement is the price’s rebounding from the resistance level. However, the scenario that implies further decline may be canceled if the price breaks the cloud’s upside border and fixes above 0.6830. In this case, the pair may continue growing towards 0.6905. After breaking the cloud’s downside border and fixing below 0.6720, the price may continue moving downwards.
NZDUSD, “New Zealand Dollar vs US Dollar”
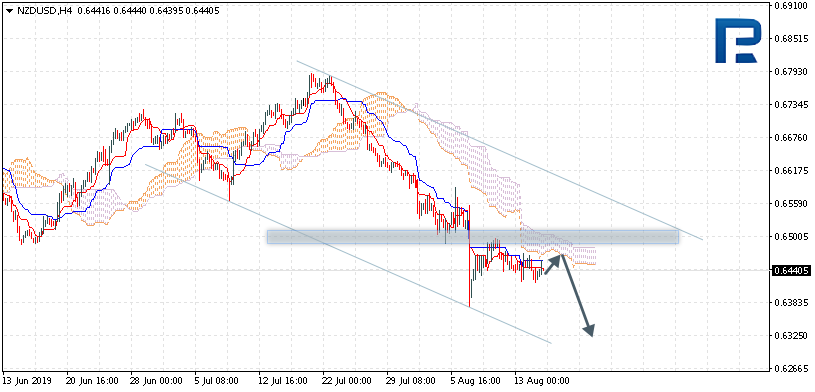
NZDUSD is trading at 0.6440; the instrument is moving below Ichimoku Cloud, thus indicating a descending tendency. The markets could indicate that the price may test the cloud’s downside border at 0.6455 and then resume moving downwards to reach 0.6325. Another signal to confirm further descending movement is the price’s rebounding from the resistance level. However, the scenario that implies further decline may be canceled if the price breaks the cloud’s upside border and fixes above 0.6525. In this case, the pair may continue growing towards 0.6645.
USDCAD, “US Dollar vs Canadian Dollar”
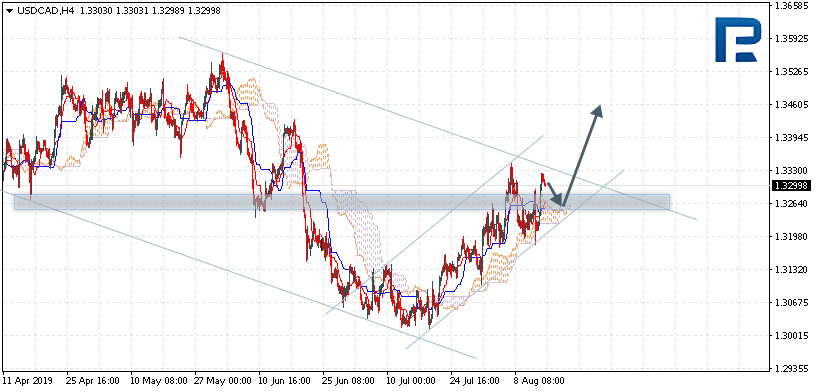
USDCAD is trading at 1.3299; the instrument is moving above Ichimoku Cloud, thus indicating an ascending tendency. The markets could indicate that the price may test the cloud’s upside border at 1.3225 and then resume moving upwards to reach 1.3460. Another signal to confirm further ascending movement is the price’s rebounding from the support level. However, the scenario that implies further growth may be canceled if the price breaks the cloud’s downside border and fixes below 1.3205. In this case, the pair may continue falling towards 1.3125. After breaking the descending channel’s upside border and fixing above 1.3355, the price may continue moving upwards.
Attention! Forecasts presented in this section only reflect the author’s private opinion and should not be considered as guidance for trading. RoboForex LP bears no responsibility for trading results based on trading recommendations described in these analytical reviews.
The US dollar has had a softer start to the penultimate European session of the week. USD index trades 97.76 last, down slightly from the recent 97.91 highs. Stronger than expected CPI data lifted USD earlier in the week though momentum has stalled as concerns grow regarding the threat of a US recession. This week, the yield in 2Y USTs moved above the yield in 10Y USTs for the first time since 2007. This same event has typically preceded a US recession historically.
EUR Outlook Clouded By Data Weakness
EURUSD has been a little firmer against USD so far today though remains heavy with price trading 1.1145 last, following the rejection at the 1.1217 level. Data weakness in the eurozone, particularly Germany, has compounded fears over the slowdown, keeping ECB easing expectations elevated.
GBP Boosted By Data Beats
GBPUSD remains bid so far today with price boosted by a further raft of positive UK data. July CPI this week came in stronger than expected on both headline and core readings while retail sales released today also surprised to the upside. GBPUSD trades 1.2009 last, however, as positive data is unable to provide much of a lift in the face of the ongoing Brexit uncertainty clouding the outlook.
Equities Extend Their Decline
Risk assets continue to trade heavily today as the growing fears of a global recession weigh on risk sentiment. Data weakness in Germany as well as worrying developments in US treasury yields, combined with the ongoing US/China trade wars and the uncertainty of Brexit, are sending equities slower into the end of the week. SPX500 trades 2831.53 last with price continuing to rollover following the break back below the 2908.55 level.
JPY & Gold Rally
Safe havens have continued to trade to the upside today with both JPY and gold trading higher against USD in light of the ongoing equities slide. USDJPY trades 105.84 last with price having conceded most of the gains made earlier in the week. XAUUSD is trading back up towards the major 1522.75 level. This is a big long- term level for gold. A violent reaction lower was seen when it was first tested earlier in the week.
Crude Continues Lower
Oil prices have come back under pressure today. Ongoing fears around the escalating US/China trade war, as well as emerging fears about the threat of a possible global recession, are keeping crude weighed. Price trades 54.23 last sitting just above the recent 54 level lows.
CAD Down, AUD Up
USDCAD has been firmly higher again today as weakness in oil prices, as well as growing fears over the health of the global economy, weigh on CAD. USDCAD is trading back above the 1.33 level now, having retest the level as support overnight and looks on course to end the week above the level, keeping the focus on further upside in the near term.
AUDUSD has been a little higher today as price continues to fight it out at the .6758 level. AUD remains under pressure given the volatile nature of the trade situation between the US and China. The RBA recently noted that it foresees further rate cuts as likely. The market is pricing in another cut by November. Currently, though, this could be brought forward given the recent deterioration in global sentiment.
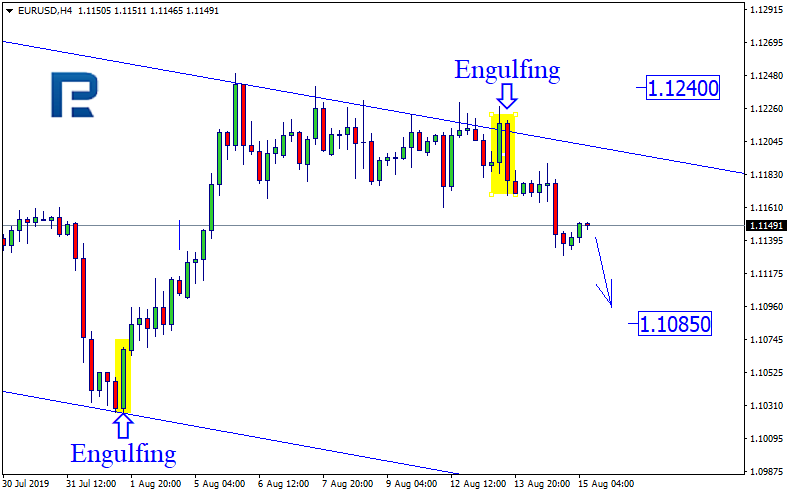
As we can see in the H4 chart, after completing Engulfing pattern, EURUSD has rebounded from the descending channel’s upside border. Right now, the pair is being corrected. After finishing the correction, the price may fall towards 1.1085 to continue forming the descending channel. However, one shouldn’t exclude a possibility that the price may break the resistance level and continue growing towards 1.1240.
USDJPY, “US Dollar vs. Japanese Yen”
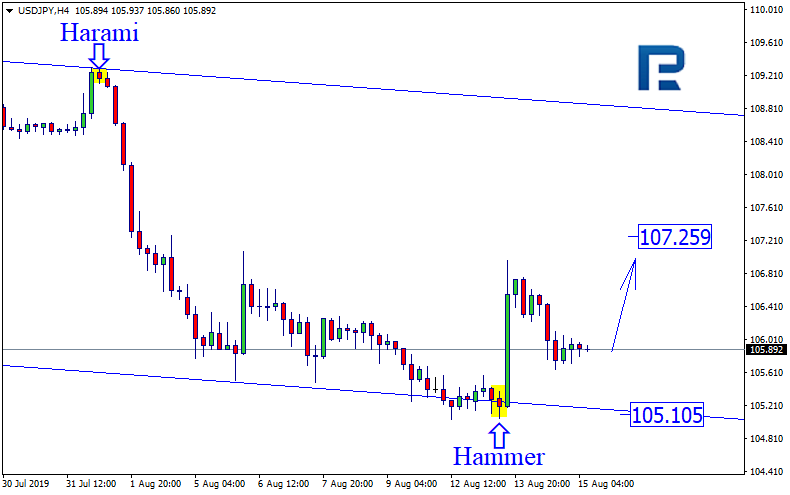
As we can see in the H4 chart, after testing the channel’s downside border and forming several reversal patterns, including Hammer, close to the support level, USDJPY has rebounded from it. Right now, it is forming another correction. Judging by the previous movements, it may be assumed that after finishing the pullback, the price may resume trading upwards to reach 107.25. However, we shouldn’t ignore a possibility that the instrument may return to the support line and update the low.
Attention! Forecasts presented in this section only reflect the author’s private opinion and should not be considered as guidance for trading. RoboForex LP bears no responsibility for trading results based on trading recommendations described in these analytical reviews.
The EUR/USD currency pair has been declining after a continuous consolidation. Quotes have updated key lows. Demand for the euro weakened after the release of weak data on German GDP. At the moment, the key support and resistance levels are 1.11300 and 1.11650, respectively. Today, investors will assess important economic releases from the US. We also recommend paying attention to the dynamics of the US government bonds yield curve. Financial market participants are concerned about a possible inversion of the yield curve of two- and ten-year government bonds, which signals an oncoming recession. Positions should be opened from the key levels.
The News Feed on 15.08.2019:
– Report on retail sales in the US at 15:30 (GMT+3:00);
– Philadelphia Fed manufacturing index at 15:30 (GMT+3:00).
Indicators point to the power of sellers: the price has fixed below 50 MA and 100 MA.
The MACD histogram is in the negative zone, but above the signal line, which gives a weak signal to sell EUR/USD.
Stochastic Oscillator is near the overbought zone, the %K line has been crossing the %D line. There are no signals at the moment.
Trading recommendations
Support levels: 1.11300, 1.11000, 1.10700
Resistance levels: 1.11650, 1.11900, 1.12200
If the price fixes below 1.11300, a further drop in the EUR/USD quotes is expected. The movement is tending to 1.11000-1.10800.
An alternative could be the growth of the EUR/USD currency pair to a round level of 1.12000.
The GBP/USD currency pair
Technical indicators of the currency pair:
Prev Open: 1.20591
Open: 1.20548
% chg. over the last day: -0.01
Day’s range: 1.20506 – 1.20638
52 wk range: 1.2015 – 1.3385
The technical pattern is still ambiguous on the GBP/USD currency pair. The British pound continues to consolidate. The local support and resistance levels are 1.20450 and 1.20750, respectively. Yesterday, positive data on inflation were published in the UK. In the near future, we do not exclude the correction of GBP/USD quotes after a continuous fall. We recommend monitoring the current information on the Brexit issue. Positions should be opened from key levels.
At 11:30 (GMT+3:00), a report on retail sales will be published in the UK.
Indicators do not give accurate signals: 50 MA has been crossing 100 MA.
The MACD histogram is near the 0 mark.
Stochastic Oscillator is in the neutral zone, the %K line is above the %D line, which indicates the bullish sentiment.
Trading recommendations
Support levels: 1.20450, 1.20150, 1.20000
Resistance levels: 1.20750, 1.21050, 1.21400
If the price fixes above 1.20750, the GBP/USD quotes are expected to correct. The movement is tending to 1.21000-1.21300.
An alternative could be a decrease in the GBP/USD currency pair to 1.20150-1.20000.
The USD/CAD currency pair
Technical indicators of the currency pair:
Prev Open: 1.32228
Open: 1.33143
% chg. over the last day: +0.67
Day’s range: 1.32944 – 1.33222
52 wk range: 1.2727 – 1.3664
Yesterday, aggressive purchases were observed on the USD/CAD currency pair. The growth of quotes exceeded 90 points. The loonie reached key extremes. The Canadian dollar is under pressure due to the negative dynamics of oil prices. At the moment, the local support and resistance levels are 1.32850 and 1.33100, respectively. A trading instrument has the potential for further growth. Today we recommend paying attention to economic reports from the US. Positions should be opened from key levels.
The news feed on Canada’s economy is calm.
The price has fixed above 50 MA and 100 MA, which signals the power of buyers.
The MACD histogram is in the positive zone, but below the signal line, which gives a weak signal to buy USD/CAD.
Stochastic Oscillator is in the neutral zone, the %K line has been crossing the %D line. There are no signals at the moment.
Trading recommendations
Support levels: 1.32850, 1.32500, 1.32150
Resistance levels: 1.33100, 1.33250, 1.33450
If the price fixes above 1.33100, further growth of the USD/CAD currency pair is expected. The movement is tending to 1.33400-1.33600.
An alternative could be a drop in the USD/CAD quotes to 1.32600-1.32400.
The USD/JPY currency pair
Technical indicators of the currency pair:
Prev Open: 106.732
Open: 105.882
% chg. over the last day: -0.78
Day’s range: 105.727 – 106.774
52 wk range: 104.97 – 114.56
The USD/JPY currency pair has been growing again. At the moment, the trading instrument is testing key extremes. The USD/JPY quotes have the potential for further correction after a continuous fall. The local support and resistance levels are 105.750 and 106.450, respectively. Today we recommend paying attention to statistics from the US. Positions should be opened from key levels.
The news feed on Japan’s economy is quite calm.
Indicators do not give accurate signals: the price has crossed 50 MA and 100 MA.
The MACD histogram is near the 0 mark.
Stochastic Oscillator is in the neutral zone, the %K line has crossed the %D line. There are no signals at the moment.
Trading recommendations
Support levels: 105.750, 105.100
Resistance levels: 106.450, 106.900, 107.300
If the price fixes above 106.450, further correction of the USD/JPY currency pair is expected. The movement is tending to 107.000-107.300.
An alternative could be a drop in the USD/JPY quotes to 105.350-105.100.
Risk appetite waned on Wednesday after the 10-year treasury yields fell below the 2-year treasury yields. The inverted yield curve set off panic among investors. As a result, they rushed to safe-haven assets. This came just a day after the equity markets were seeing some kind of recovery. The inverted yield curve once again reminded investors about slowing economic growth and a possible recession.
Euro Slips as Eurozone GDP Confirmed at 0.2% in Q2
The euro currency was seen trading weaker on the day. Eurozone’s second-quarter GDP was confirmed rising by 0.2% in the second quarter of the year. This was an unchanged print from the flash estimates. Germany’s GDP was seen contracting 0.1% in the second quarter of the year. The slowdown was attributed to the cooling export markets due to the trade dispute with the US.
EURUSD Dips to Lower Support
EURUSD was seen easing lower on the day as it broke out from its range. The euro currency fell to the lower support at 1.1140 and is seen testing this level at the time of writing. We expect this support level to hold in the short term. Failure to hold the declines could send the euro lower to the previously established lows at 1.1028.
UK Inflation Rises Slightly Higher than Expected
Inflation data for the UK showed a modest increase. Headline inflation rose 2.1% on the year ending July 2019. This was slightly above estimates of a 1.9% increase and up from 2.0% registered in the month before. Core inflation was seen inching from 1.8% to 1.9% in July on the year. The data, however, failed to move the sterling higher on the day.
GBPUSD Maintains its Flat Range
The GBPUSD currency pair continues to remain trading within the established range of 1.2082 and 1.2026. The descending wedge pattern remains in play, however. This indicates a possible breakout to the upside. This bias holds as long as GBPUSD doesn’t break down below the 1.2026 level where the previous lows were established.
Gold Advances Higher as Risk Appetite Fades
The previous metal was seen rising slightly higher on the day by Wednesday’s close. However, the gains in the precious metal were rather muted. Gold prices failed to advance on the rising risk aversion, which could possibly indicate that a top has been formed. Economic data from the US was also limited, keeping gold prices in check.
XAUUSD Has Likely Formed a Top
Failure to post higher highs on the back of the recent risk aversion gives rise to the view that gold prices might be forming a top. After rising to a fresh six-year high at 1532, gold failed to rebound above this level. While support has been established at 1494, failure to post higher highs could signal a possible consolidation or a move lower. Watch the support at 1494 which could give further clues. A close below this level could signal further declines in gold prices.